Terapia hormonal a largo plazo para pacientes perimenopáusicas y posmenopáusicas
Información
- DOI:
- https://doi.org/10.1002/14651858.CD004143.pub5Copiar DOI

- Base de datos:
-
- Cochrane Database of Systematic Reviews
- Versión publicada:
-
- 17 enero 2017see what's new
- Tipo:
-
- Intervention
- Etapa:
-
- Review
- Grupo Editorial Cochrane:
-
Grupo Cochrane de Ginecología y fertilidad
- Copyright:
-
- Copyright © 2017 The Cochrane Collaboration. Published by John Wiley & Sons, Ltd.
Cifras del artículo
Altmetric:
Citado por:
Autores
Contributions of authors
For the 2017 update of the review, Jane Marjoribanks (JM) extracted and entered data and drafted the text, and Jasmine Lee (JL) checked study selection and data extraction. Helen Roberts (HR), Cindy Farquhar (CF) and Anne Lethaby (AL) commented on and contributed to the drafts.
For the 2008 and 2012 updates of the review, JM extracted and entered data and drafted the text, and CF checked study selection and data extraction. HR, CF and AL commented on and contributed to the drafts.
CF and AL developed the original protocol and circulated it to members of the Cochrane HT Study Group for comment. The following people contributed specifically to the protocol: Professor Shah Ebrahim, Dr Peter Tugwell, Teresa Moore and Maria Judd. For the original version of the review, JM and Jane Suckling searched for relevant studies and selected studies for inclusion, and JM extracted and entered data that were checked by Quirine Lamberts. JM drafted the review, circulated it to other members of the Cochrane HRT Study Group for comment and edited the draft.
The following individuals commented on the draft of the original review: Breast Cancer Group: Sue Carrick, Sue Lockwood (Editor); Dementia and Cognitive Improvement Group: Professor Leon Flicker (Editor), Professor Lon Schneider (Editor); Heart Group: Lee Hooper (Editor), Theresa Moore (Review Group Coordinator); Gynaecology and Fertility Group: Cindy Farquhar (Co‐ordinating Editor), Anne Lethaby (Editor); Stroke Group: Professor Ale Agra (Editor), Steff Lewis (Statistical Editor).
Sources of support
Internal sources
-
University of Auckland, New Zealand.
External sources
-
None, Other.
Declarations of interest
Cindy Farquhar is a director/shareholder of a gynaecology clinic and undertakes private practice within those premises. She has received travel/accommodation/meeting expenses from ESHRE or ASRM for attendance at scientific meetings.
JL, AL, JM and HR have no interests to declare.
Acknowledgements
Thanks to Marian Showell (CFG Information Specialist) who designed and ran the search strategy for the 2012 and 2017 updates of this review, and Josie Rishworth, who helped format the labelling of the analysis tables for the 2012 update. Thanks also to Quirine Lamberts, Jane Suckling and the following Cochrane Review Groups, all of whom helped with the first version of this review: Breast Group, Colorectal Cancer Group, Dementia and Cognitive Improvement Group, Gynaecological Cancer Group, Heart Group, Gynaecology and Fertility Group, Musculoskeletal Group, Peripheral Vascular Diseases Group and Stroke Group. See Contributions of authors for details. Martha Hickey kindly provided comments and suggestions on drafts of the 2008 update.
Version history
| Published | Title | Stage | Authors | Version |
| 2017 Jan 17 | Long‐term hormone therapy for perimenopausal and postmenopausal women | Review | Jane Marjoribanks, Cindy Farquhar, Helen Roberts, Anne Lethaby, Jasmine Lee | |
| 2012 Jul 11 | Long term hormone therapy for perimenopausal and postmenopausal women | Review | Jane Marjoribanks, Cindy Farquhar, Helen Roberts, Anne Lethaby | |
| 2009 Apr 15 | Long term hormone therapy for perimenopausal and postmenopausal women | Review | Cindy Farquhar, Jane Marjoribanks, Anne Lethaby, Jane A Suckling, Quirine Lamberts | |
| 2005 Jul 20 | Long term hormone therapy for perimenopausal and postmenopausal women | Review | Cindy Farquhar, Jane Marjoribanks, Anne Lethaby, Jane A Suckling, Quirine Lamberts | |
| 2003 Apr 22 | Hormone replacement therapy for perimenopausal and postmenopausal women | Protocol | G roup Cochrane HRT Study, Cindy M Farquhar | |
Differences between protocol and review
For the 2017 update, we decided to omit quality of life as an outcome and to focus on adverse events only, to make the review more concise. This meant that we excluded two previously included studies (Haines 2003; Nielsen 2006).
We also decided for the 2017 update to limit the outcome "Cognitive function" to studies of global measures of cognition, also to keep the review as concise as possible. This did not change any of our data.
For the 2017 update, we did not include studies that did not report any events in either group for a particular outcome in the meta‐analysis for that outcome because they did not add useful data (Higgins 2011).
Keywords
MeSH
Medical Subject Headings (MeSH) Keywords
- *Perimenopause;
- *Postmenopause;
- Cardiovascular Diseases [chemically induced, mortality];
- Cause of Death;
- Estrogen Replacement Therapy [*adverse effects, methods];
- Estrogens [*adverse effects, therapeutic use];
- Hot Flashes [drug therapy];
- Neoplasms [chemically induced, mortality];
- Progesterone [*adverse effects, therapeutic use];
- Randomized Controlled Trials as Topic;
- Venous Thromboembolism [chemically induced];
Medical Subject Headings Check Words
Adult; Aged; Aged, 80 and over; Female; Humans; Middle Aged;
PICO

Risk of bias summary: review authors' judgements about each risk of bias item for each included study.

Study flow diagram.

Risk of bias graph: review authors' judgements about each risk of bias item presented as percentages across all included studies.

Comparison 1 Women without major health problems (selected outcomes: death, CVD, cognition, QOL), Outcome 1 Death from any cause: oestrogen‐only HT.

Comparison 1 Women without major health problems (selected outcomes: death, CVD, cognition, QOL), Outcome 2 Death from any cause: combined HT.
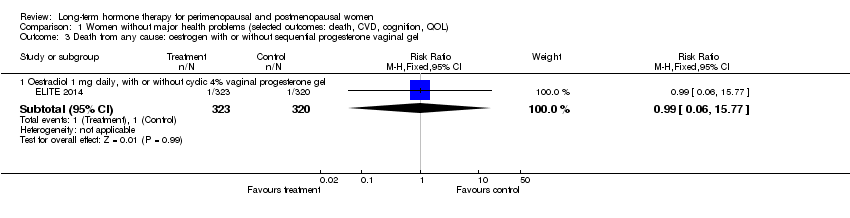
Comparison 1 Women without major health problems (selected outcomes: death, CVD, cognition, QOL), Outcome 3 Death from any cause: oestrogen with or without sequential progesterone vaginal gel.
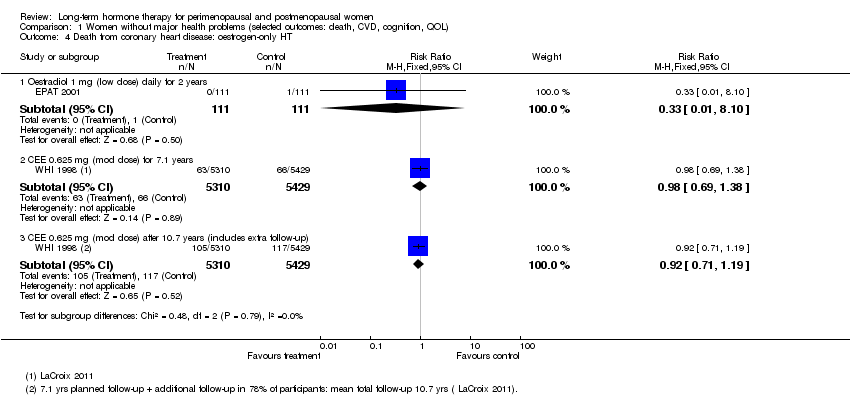
Comparison 1 Women without major health problems (selected outcomes: death, CVD, cognition, QOL), Outcome 4 Death from coronary heart disease: oestrogen‐only HT.

Comparison 1 Women without major health problems (selected outcomes: death, CVD, cognition, QOL), Outcome 5 Death from coronary heart disease: combined continuous HT.

Comparison 1 Women without major health problems (selected outcomes: death, CVD, cognition, QOL), Outcome 6 Death from coronary heart disease: combined sequential HT.
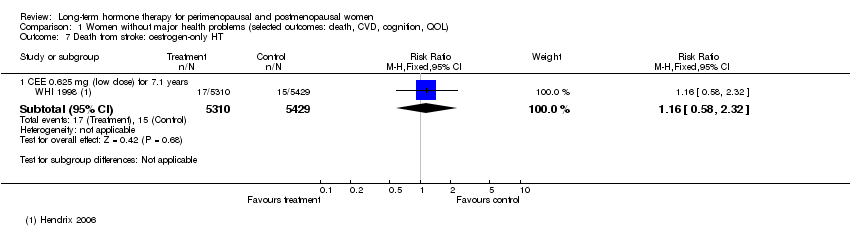
Comparison 1 Women without major health problems (selected outcomes: death, CVD, cognition, QOL), Outcome 7 Death from stroke: oestrogen‐only HT.

Comparison 1 Women without major health problems (selected outcomes: death, CVD, cognition, QOL), Outcome 8 Death from stroke: combined sequential HT.

Comparison 1 Women without major health problems (selected outcomes: death, CVD, cognition, QOL), Outcome 9 Death from stroke: combined continuous HT.
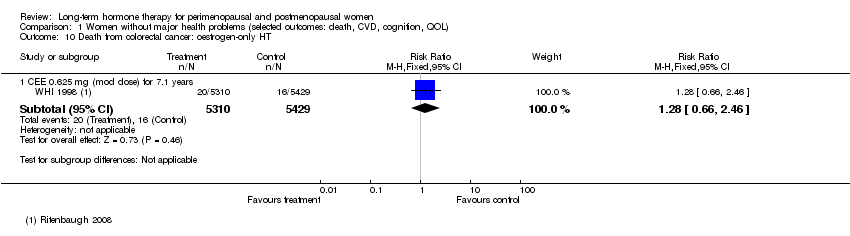
Comparison 1 Women without major health problems (selected outcomes: death, CVD, cognition, QOL), Outcome 10 Death from colorectal cancer: oestrogen‐only HT.

Comparison 1 Women without major health problems (selected outcomes: death, CVD, cognition, QOL), Outcome 11 Death from breast cancer: combined continuous HT.
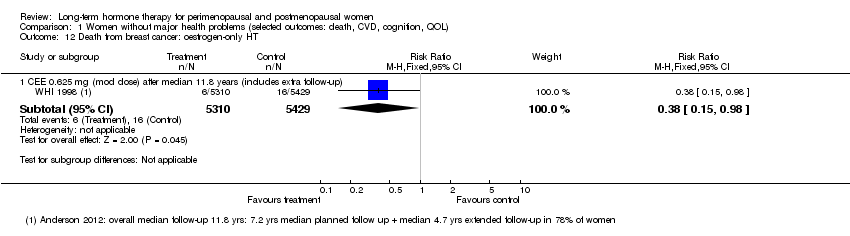
Comparison 1 Women without major health problems (selected outcomes: death, CVD, cognition, QOL), Outcome 12 Death from breast cancer: oestrogen‐only HT.

Comparison 1 Women without major health problems (selected outcomes: death, CVD, cognition, QOL), Outcome 13 Death from colorectal cancer: combined continuous HT.
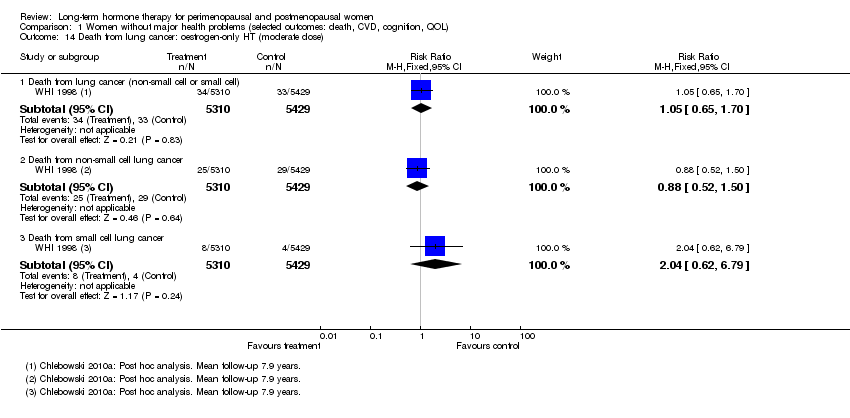
Comparison 1 Women without major health problems (selected outcomes: death, CVD, cognition, QOL), Outcome 14 Death from lung cancer: oestrogen‐only HT (moderate dose).

Comparison 1 Women without major health problems (selected outcomes: death, CVD, cognition, QOL), Outcome 15 Death from lung cancer: combined continuous HT (moderate dose).

Comparison 1 Women without major health problems (selected outcomes: death, CVD, cognition, QOL), Outcome 16 Death from lung cancer: combined sequential HT (low dose oestrogen).
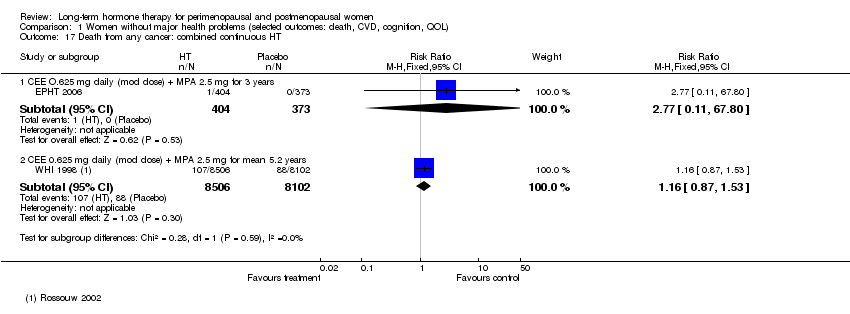
Comparison 1 Women without major health problems (selected outcomes: death, CVD, cognition, QOL), Outcome 17 Death from any cancer: combined continuous HT.
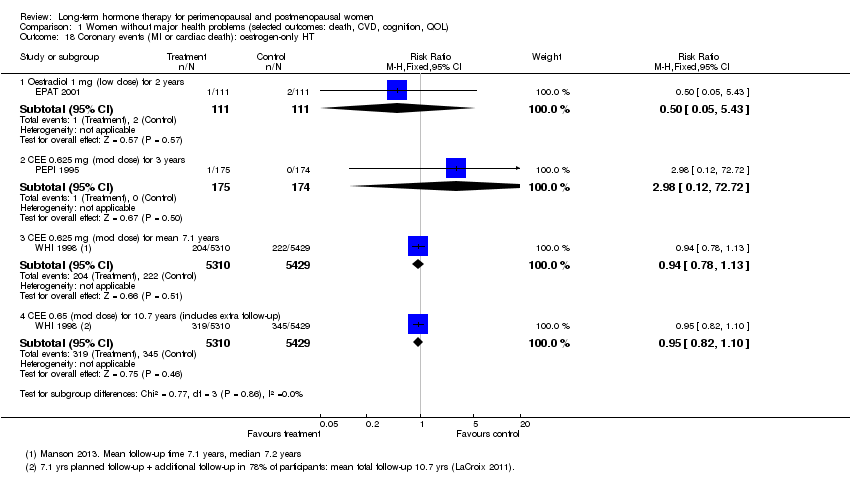
Comparison 1 Women without major health problems (selected outcomes: death, CVD, cognition, QOL), Outcome 18 Coronary events (MI or cardiac death): oestrogen‐only HT.
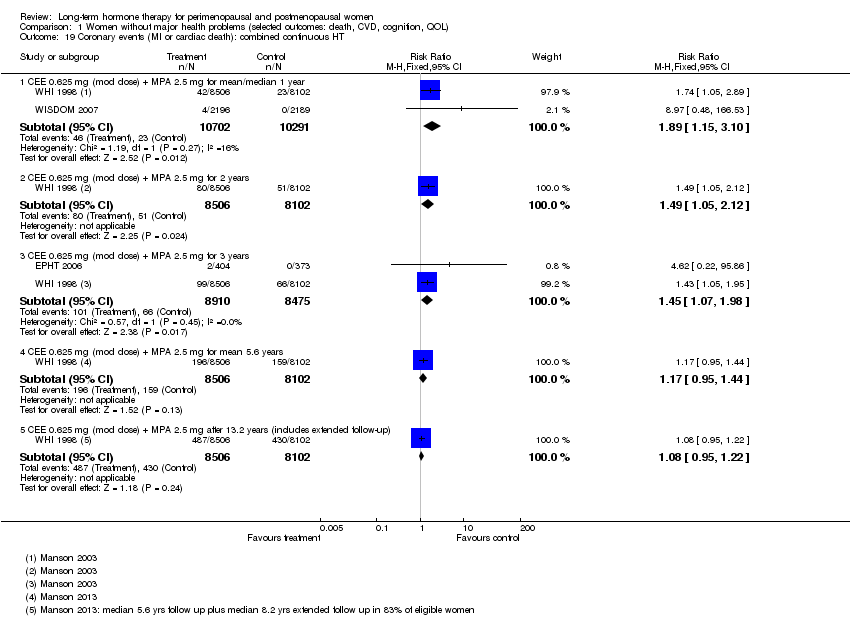
Comparison 1 Women without major health problems (selected outcomes: death, CVD, cognition, QOL), Outcome 19 Coronary events (MI or cardiac death): combined continuous HT.

Comparison 1 Women without major health problems (selected outcomes: death, CVD, cognition, QOL), Outcome 20 Coronary events (MI or cardiac death): combined sequential HT.
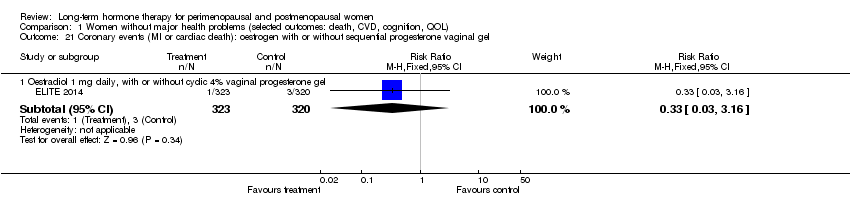
Comparison 1 Women without major health problems (selected outcomes: death, CVD, cognition, QOL), Outcome 21 Coronary events (MI or cardiac death): oestrogen with or without sequential progesterone vaginal gel.

Comparison 1 Women without major health problems (selected outcomes: death, CVD, cognition, QOL), Outcome 22 Stroke: unopposed oestrogen.

Comparison 1 Women without major health problems (selected outcomes: death, CVD, cognition, QOL), Outcome 23 Stroke: combined continuous HT.

Comparison 1 Women without major health problems (selected outcomes: death, CVD, cognition, QOL), Outcome 24 Stroke: combined sequential HT.
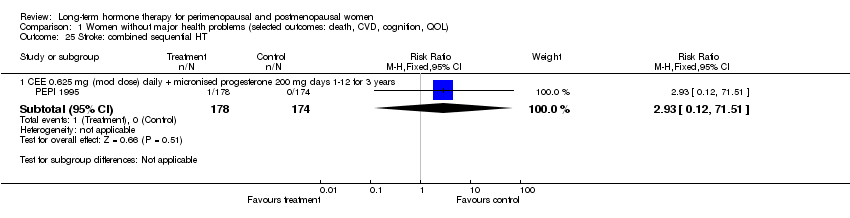
Comparison 1 Women without major health problems (selected outcomes: death, CVD, cognition, QOL), Outcome 25 Stroke: combined sequential HT.
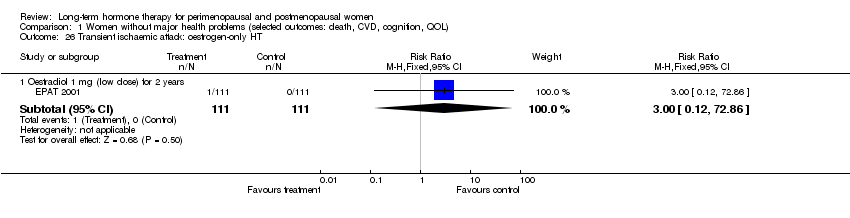
Comparison 1 Women without major health problems (selected outcomes: death, CVD, cognition, QOL), Outcome 26 Transient ischaemic attack: oestrogen‐only HT.
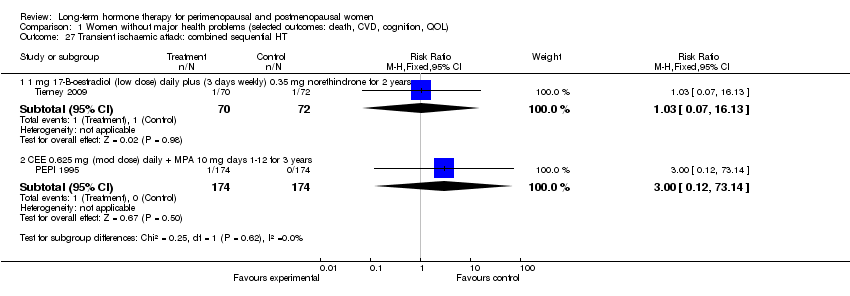
Comparison 1 Women without major health problems (selected outcomes: death, CVD, cognition, QOL), Outcome 27 Transient ischaemic attack: combined sequential HT.
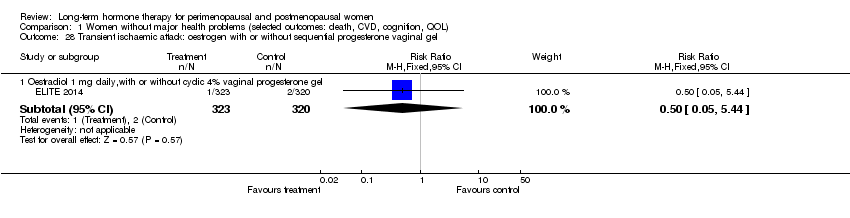
Comparison 1 Women without major health problems (selected outcomes: death, CVD, cognition, QOL), Outcome 28 Transient ischaemic attack: oestrogen with or without sequential progesterone vaginal gel.

Comparison 1 Women without major health problems (selected outcomes: death, CVD, cognition, QOL), Outcome 29 Stroke or transient ischaemic attack.

Comparison 1 Women without major health problems (selected outcomes: death, CVD, cognition, QOL), Outcome 30 Venous thromboembolism (DVT or PE): oestrogen‐only HT.

Comparison 1 Women without major health problems (selected outcomes: death, CVD, cognition, QOL), Outcome 31 Venous thromboembolism (DVT or PE): combined sequential HT.

Comparison 1 Women without major health problems (selected outcomes: death, CVD, cognition, QOL), Outcome 32 Venous thromboembolism (DVT or PE): combined continuous HT.

Comparison 1 Women without major health problems (selected outcomes: death, CVD, cognition, QOL), Outcome 33 Venous thromboembolism (DVT or PE): oestrogen with or without sequential progesterone vaginal gel.

Comparison 1 Women without major health problems (selected outcomes: death, CVD, cognition, QOL), Outcome 34 Global cognitive function.

Comparison 1 Women without major health problems (selected outcomes: death, CVD, cognition, QOL), Outcome 35 Probable dementia.

Comparison 2 Women with cardiovascular disease (selected outcomes: death, CVD, cognition, QOL), Outcome 1 Death from any cause: oestrogen‐only HT.

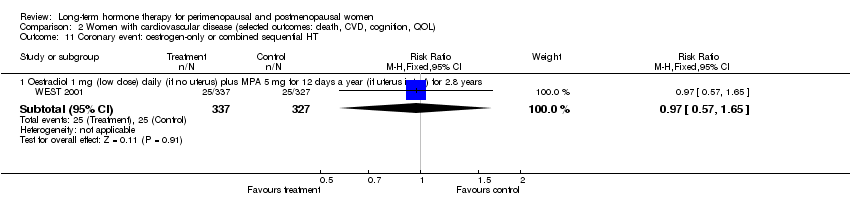
Comparison 2 Women with cardiovascular disease (selected outcomes: death, CVD, cognition, QOL), Outcome 2 Death from any cause: oestrogen‐only or combined sequential HT.

Comparison 2 Women with cardiovascular disease (selected outcomes: death, CVD, cognition, QOL), Outcome 3 Death from any cause: combined continuous HT.

Comparison 2 Women with cardiovascular disease (selected outcomes: death, CVD, cognition, QOL), Outcome 4 Death from coronary heart disease: oestrogen‐only HT.

Comparison 2 Women with cardiovascular disease (selected outcomes: death, CVD, cognition, QOL), Outcome 5 Death from CHD: oestrogen‐only or combined sequential HT.

Comparison 2 Women with cardiovascular disease (selected outcomes: death, CVD, cognition, QOL), Outcome 6 Death from CHD: combined continuous HT.
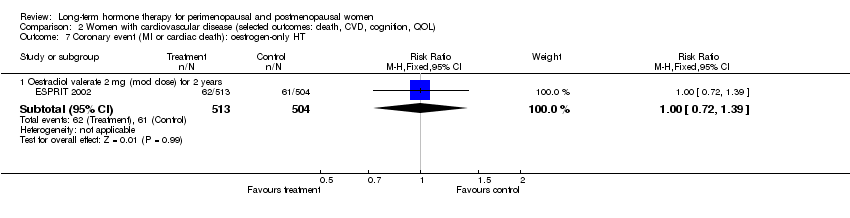
Comparison 2 Women with cardiovascular disease (selected outcomes: death, CVD, cognition, QOL), Outcome 7 Coronary event (MI or cardiac death): oestrogen‐only HT.
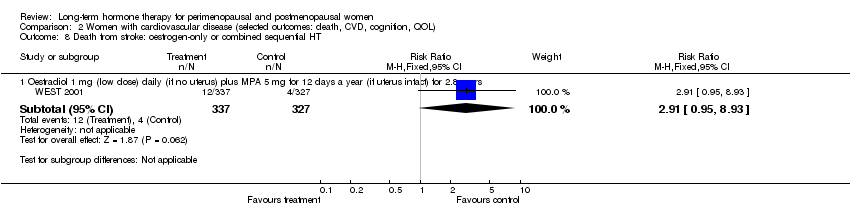
Comparison 2 Women with cardiovascular disease (selected outcomes: death, CVD, cognition, QOL), Outcome 8 Death from stroke: oestrogen‐only or combined sequential HT.

Comparison 2 Women with cardiovascular disease (selected outcomes: death, CVD, cognition, QOL), Outcome 9 Death from cancer: combined continuous HT.

Comparison 2 Women with cardiovascular disease (selected outcomes: death, CVD, cognition, QOL), Outcome 10 Coronary event (MI or cardiac death): oestrogen‐only HT.
Comparison 2 Women with cardiovascular disease (selected outcomes: death, CVD, cognition, QOL), Outcome 11 Coronary event: oestrogen‐only or combined sequential HT.

Comparison 2 Women with cardiovascular disease (selected outcomes: death, CVD, cognition, QOL), Outcome 12 Coronary event (MI or cardiac death): combined continuous HT.

Comparison 2 Women with cardiovascular disease (selected outcomes: death, CVD, cognition, QOL), Outcome 13 Stroke (first or recurrent): oestrogen‐only HT or combined sequential.

Comparison 2 Women with cardiovascular disease (selected outcomes: death, CVD, cognition, QOL), Outcome 14 Stroke (first or recurrent): oestrogen‐only HT (mod dose).

Comparison 2 Women with cardiovascular disease (selected outcomes: death, CVD, cognition, QOL), Outcome 15 Stroke (first or recurrent): combined continuous HT (mod dose oestrogen).

Comparison 2 Women with cardiovascular disease (selected outcomes: death, CVD, cognition, QOL), Outcome 16 Transient ischaemic attack: oestrogen‐only HT (mod dose).

Comparison 2 Women with cardiovascular disease (selected outcomes: death, CVD, cognition, QOL), Outcome 17 Transient ischaemic attack: oestrogen‐only or combined sequential HT.

Comparison 2 Women with cardiovascular disease (selected outcomes: death, CVD, cognition, QOL), Outcome 18 Transient ischaemic attack: combined continuous HT.

Comparison 2 Women with cardiovascular disease (selected outcomes: death, CVD, cognition, QOL), Outcome 19 Stroke or transient ischaemic attack: oestrogen‐only HT.

Comparison 2 Women with cardiovascular disease (selected outcomes: death, CVD, cognition, QOL), Outcome 20 Stroke or transient ischaemic attack: combined continuous HT.

Comparison 2 Women with cardiovascular disease (selected outcomes: death, CVD, cognition, QOL), Outcome 21 VTE (first or recurrent PE or DVT): oestrogen‐only HT.
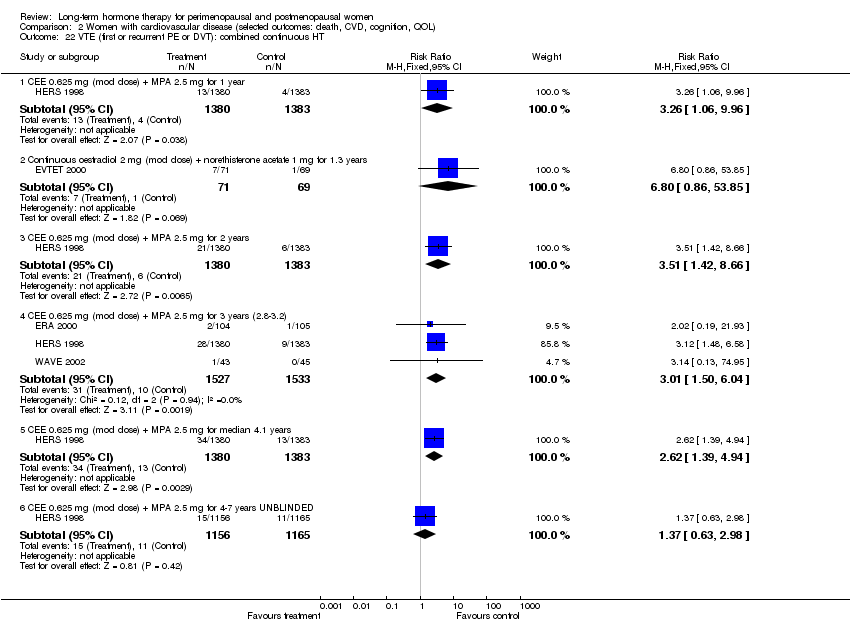
Comparison 2 Women with cardiovascular disease (selected outcomes: death, CVD, cognition, QOL), Outcome 22 VTE (first or recurrent PE or DVT): combined continuous HT.

Comparison 3 Women with dementia, Outcome 1 Worsening of dementia on treatment (by ADCS‐CGIC score): oestrogen‐only HT.
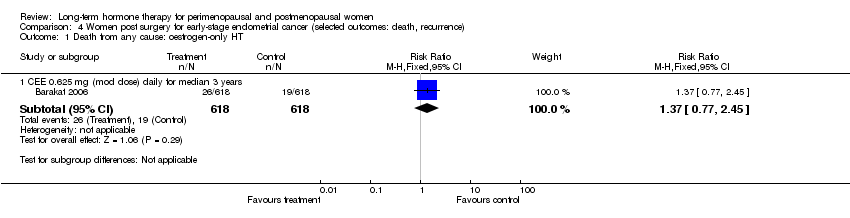
Comparison 4 Women post surgery for early‐stage endometrial cancer (selected outcomes: death, recurrence), Outcome 1 Death from any cause: oestrogen‐only HT.
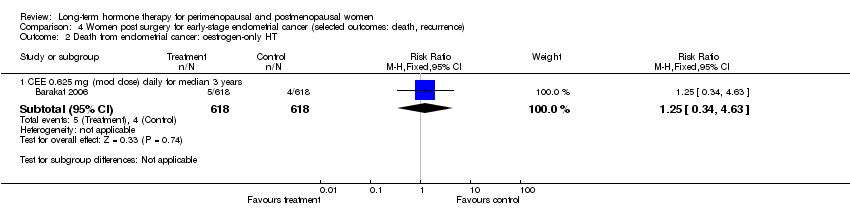
Comparison 4 Women post surgery for early‐stage endometrial cancer (selected outcomes: death, recurrence), Outcome 2 Death from endometrial cancer: oestrogen‐only HT.

Comparison 4 Women post surgery for early‐stage endometrial cancer (selected outcomes: death, recurrence), Outcome 3 Death from CHD: oestrogen‐only HT.

Comparison 5 Women hospitalised with chronic illness (selected outcomes: death, CVD, VTE), Outcome 1 All‐cause death: combined sequential HT.

Comparison 5 Women hospitalised with chronic illness (selected outcomes: death, CVD, VTE), Outcome 2 Myocardial infarction: combined sequential HT.

Comparison 5 Women hospitalised with chronic illness (selected outcomes: death, CVD, VTE), Outcome 3 Venous thromboembolism (DVT or PE): combined sequential HT.

Comparison 6 All women (selected outcomes: cancer, cholecystic disease, fractures), Outcome 1 Breast cancer: oestrogen‐only HT.
Comparison 6 All women (selected outcomes: cancer, cholecystic disease, fractures), Outcome 2 Breast cancer: oestrogen‐only or combined HT.

Comparison 6 All women (selected outcomes: cancer, cholecystic disease, fractures), Outcome 3 Breast cancer: combined continuous HT.

Comparison 6 All women (selected outcomes: cancer, cholecystic disease, fractures), Outcome 4 Breast cancer: combined sequential HT.

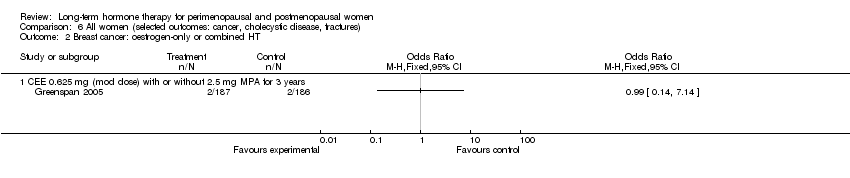
Comparison 6 All women (selected outcomes: cancer, cholecystic disease, fractures), Outcome 5 Breast cancer: oestrogen with or without sequential progesterone vaginal gel.
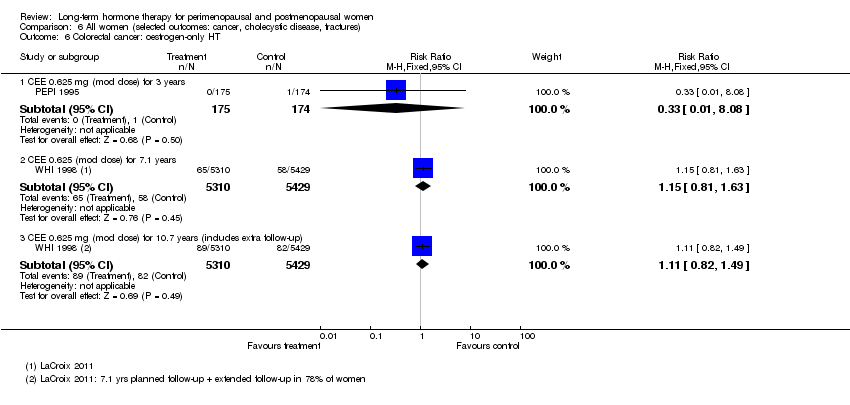
Comparison 6 All women (selected outcomes: cancer, cholecystic disease, fractures), Outcome 6 Colorectal cancer: oestrogen‐only HT.
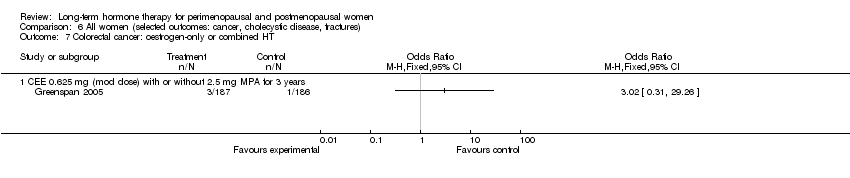
Comparison 6 All women (selected outcomes: cancer, cholecystic disease, fractures), Outcome 7 Colorectal cancer: oestrogen‐only or combined HT.
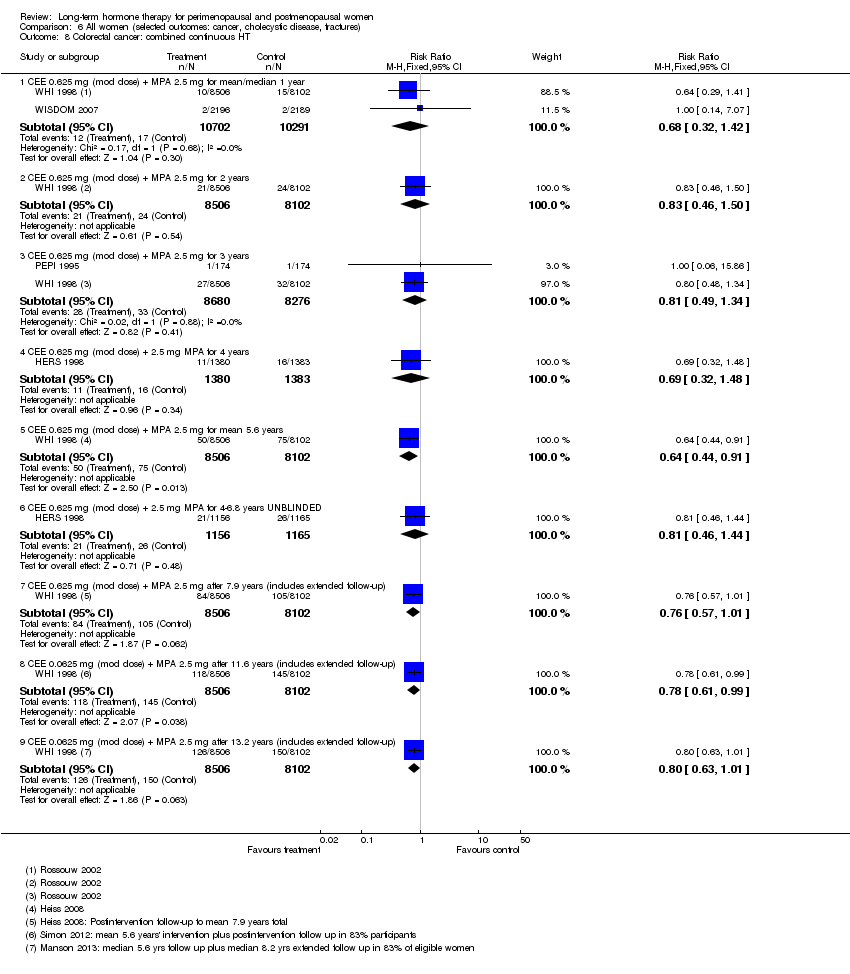
Comparison 6 All women (selected outcomes: cancer, cholecystic disease, fractures), Outcome 8 Colorectal cancer: combined continuous HT.

Comparison 6 All women (selected outcomes: cancer, cholecystic disease, fractures), Outcome 9 Colorectal cancer: combined sequential HT.
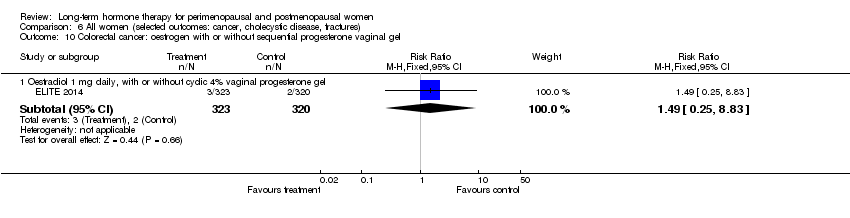
Comparison 6 All women (selected outcomes: cancer, cholecystic disease, fractures), Outcome 10 Colorectal cancer: oestrogen with or without sequential progesterone vaginal gel.

Comparison 6 All women (selected outcomes: cancer, cholecystic disease, fractures), Outcome 11 Lung cancer: oestrogen‐only HT (moderate dose).

Comparison 6 All women (selected outcomes: cancer, cholecystic disease, fractures), Outcome 12 Lung cancer: combined continuous HT (mod dose oestrogen).
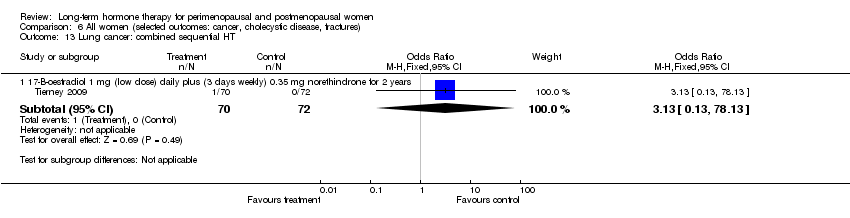
Comparison 6 All women (selected outcomes: cancer, cholecystic disease, fractures), Outcome 13 Lung cancer: combined sequential HT.

Comparison 6 All women (selected outcomes: cancer, cholecystic disease, fractures), Outcome 14 Endometrial cancer: oestrogen‐only HT.
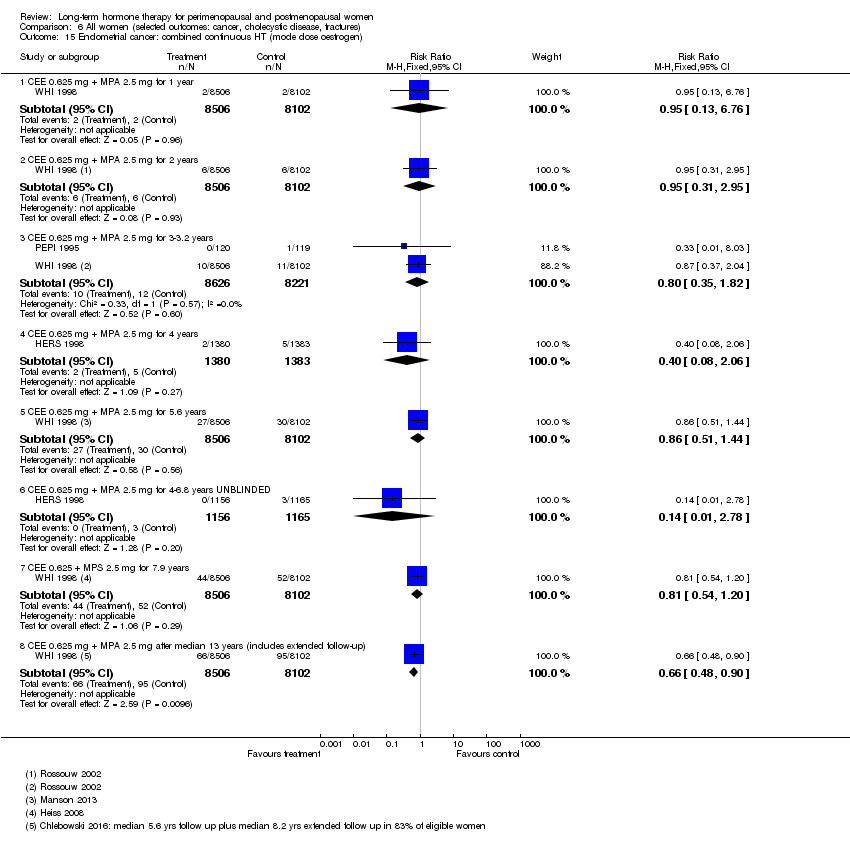
Comparison 6 All women (selected outcomes: cancer, cholecystic disease, fractures), Outcome 15 Endometrial cancer: combined continuous HT (mode dose oestrogen).

Comparison 6 All women (selected outcomes: cancer, cholecystic disease, fractures), Outcome 16 Endometrial cancer: combined sequential HT.

Comparison 6 All women (selected outcomes: cancer, cholecystic disease, fractures), Outcome 17 Recurrent endometrial cancer: oestrogen‐only HT.

Comparison 6 All women (selected outcomes: cancer, cholecystic disease, fractures), Outcome 18 Ovarian cancer: combined continuous HT.
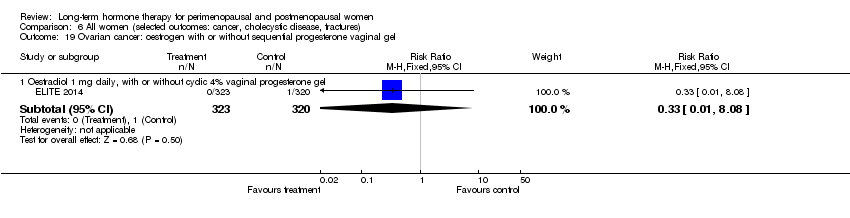
Comparison 6 All women (selected outcomes: cancer, cholecystic disease, fractures), Outcome 19 Ovarian cancer: oestrogen with or without sequential progesterone vaginal gel.

Comparison 6 All women (selected outcomes: cancer, cholecystic disease, fractures), Outcome 20 Gallbladder disease requiring surgery: oestrogen‐only HT.

Comparison 6 All women (selected outcomes: cancer, cholecystic disease, fractures), Outcome 21 Gallbladder disease requiring surgery: combined continuous HT.

Comparison 6 All women (selected outcomes: cancer, cholecystic disease, fractures), Outcome 22 Gallbladder disease requiring surgery: combined sequential HT.

Comparison 6 All women (selected outcomes: cancer, cholecystic disease, fractures), Outcome 23 Hip fractures: oestrogen‐only HT.

Comparison 6 All women (selected outcomes: cancer, cholecystic disease, fractures), Outcome 24 Hip fractures: oestrogen‐only or combined sequential HT.
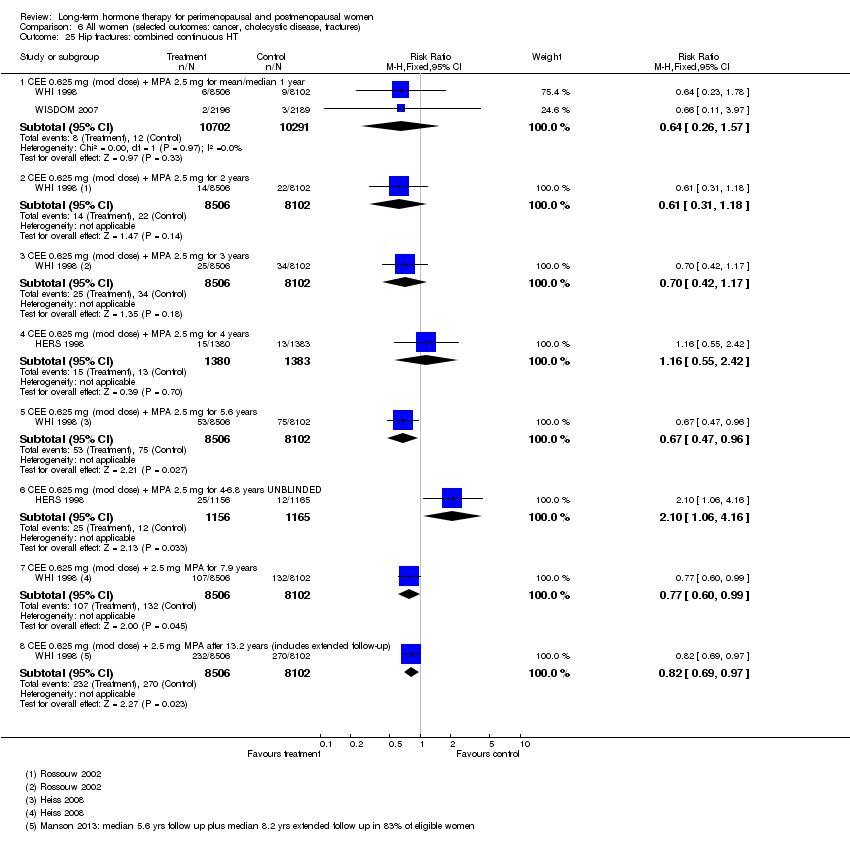
Comparison 6 All women (selected outcomes: cancer, cholecystic disease, fractures), Outcome 25 Hip fractures: combined continuous HT.
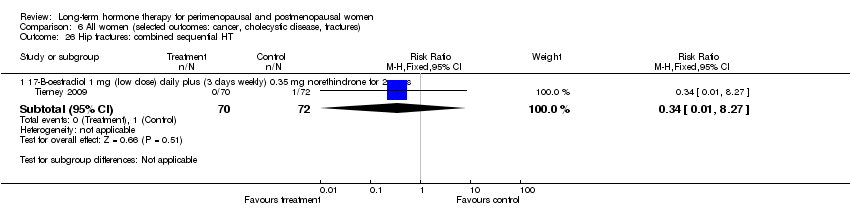
Comparison 6 All women (selected outcomes: cancer, cholecystic disease, fractures), Outcome 26 Hip fractures: combined sequential HT.
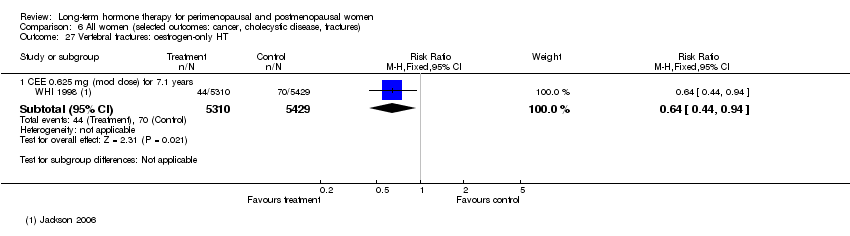
Comparison 6 All women (selected outcomes: cancer, cholecystic disease, fractures), Outcome 27 Vertebral fractures: oestrogen‐only HT.

Comparison 6 All women (selected outcomes: cancer, cholecystic disease, fractures), Outcome 28 Vertebral fractures: combined continuous HT.

Comparison 6 All women (selected outcomes: cancer, cholecystic disease, fractures), Outcome 29 All clinical fractures: oestrogen‐only or combined sequential HT.

Comparison 6 All women (selected outcomes: cancer, cholecystic disease, fractures), Outcome 30 All clinical fractures: oestrogen‐only HT (moderate dose).

Comparison 6 All women (selected outcomes: cancer, cholecystic disease, fractures), Outcome 31 All clinical fractures: oestrogen‐only or combined HT.

Comparison 6 All women (selected outcomes: cancer, cholecystic disease, fractures), Outcome 32 All clinical fractures: combined continuous HT.

Comparison 6 All women (selected outcomes: cancer, cholecystic disease, fractures), Outcome 33 All clinical fractures: combined sequential HT.
| Combined continuous hormone therapy (HT) compared with placebo for perimenopausal and postmenopausal women | ||||||
| Population: relatively healthy postmenopausal women Setting: community | ||||||
| Outcomes | Illustrative comparative risks* (95% CI) | Relative effect | No. of participants | Quality of the evidence | Comments | |
| Assumed risk* | Corresponding risk | |||||
| Placebo | Combined continuous hormone therapy (HT) | |||||
| Coronary events (MI or cardiac death) Follow‐up: mean/median 1 year | 2 per 1000 | 4 per 1000 | RR 1.89 | 20,993 | ⊕⊕⊕⊝ | |
| Stroke | 6 per 1000 | 8 per 1000 | RR 146 | 17,585 | ⊕⊕⊕⊝ | |
| Venous thromboembolism (DVT or PE) Follow‐up: mean/median 1 year | 2 per 1000 | 7 per 1000 | RR 4.28 | 20,993 | ⊕⊕⊕⊝ | |
| Breast cancer | 19 per 1000 | 24 per 1000 | RR 1.27 (1.03 to 1.56) | 16,608 | ⊕⊕⊕⊝ | |
| Death from lung cancer Follow‐up: median 8 yearsb | 5 per 1,000 | 9 per 1000 (6 to 13) | RR 1.74 (1.18 to 2.55) | 16,608 | ⊕⊕⊕⊝ | |
| Gallbladder disease Follow‐up: mean 5.6 years | 16 per 1000 | 27 per 1000 (21 to 34) | RR 1.64 (1.30 to 2.06) | 14,203 (1 study) | ⊕⊕⊕⊝ | |
| All clinical fractures | 111 per 1000 | 87 per 1000 | RR 0.78 | 16,608 | ⊕⊕⊕⊝ | |
| *The basis for the assumed risk is the mean risk in the control group. The corresponding risk (and its 95% confidence interval) is based on the assumed risk in the comparison group and the relative effect of the intervention (and its 95% CI). | ||||||
| GRADE Working Group grades of evidence. | ||||||
| aDowngraded one level for questionable applicability: Only about 33% of the study sample was 50‐59 years of age at baseline (i.e. the age women are most likely to consider HT for vasomotor symptoms); mean participant age was 63 years. b5.6 years' intervention plus postintervention follow‐up: post hoc analysis. | ||||||
| Oestrogen‐only hormone therapy (HT) compared with placebo for perimenopausal and postmenopausal women | ||||||
| Population: relatively healthy postmenopausal women Setting: community | ||||||
| Outcomes | Illustrative comparative risks* (95% CI) | Relative effect | No. of participants | Quality of the evidence | Comments | |
| Assumed risk | Corresponding risk | |||||
| Placebo | Oestrogen‐only hormone therapy (HT) | |||||
| Coronary events (MI or cardiac death) | 41 per 1000 | 38 per 1000 | RR 0.94 | 10,739 | ⊕⊕⊕⊝ | |
| Stroke | 24 per 1000 | 32 per 1000 | RR 1.33 | 10,739 | ⊕⊕⊕⊝ | |
| Venous thromboembolism (DVT or PE) Follow up 1‐2 years | 2 per 1000 | 5 per 1000 (2 to 10) | RR 2.22 (1.12 to 4.39) | 10,739 | ⊕⊕⊕⊝ | |
| Venous thromboembolism (DVT or PE): CEE 0.625 mg (moderate dose) | 16 per 1000 | 21 per 1000 | RR 1.32 | 10,739 | ⊕⊕⊕⊝ | |
| Breast cancer | 25 per 1000 | 20 per 1000 | RR 0.79 | 10,739 | ⊕⊕⊕⊝ | |
| Gallbladder disease Follow‐up: mean 7.1 yearsa | 27 per 1000 | 47 per 1000 (38 to 60) | RR 1.78 (1.42 to 2.24) | 8376 | ⊕⊕⊕⊝ | |
| All clinical fractures | 141 per 1000 | 103 per 1000 | RR 0.73 | 10,739 | ⊕⊕⊕⊝ | |
| *The basis for the assumed risk is the mean risk in the control group. The corresponding risk (and its 95% confidence interval) is based on the assumed risk in the comparison group and the relative effect of the intervention (and its 95% CI). | ||||||
| GRADE Working Group grades of evidence. | ||||||
| aMedian use of CEE 5.9 years (LaCroix 2011). | ||||||
| Study | How defined | Assessment | HT group | Placebo group | Note |
| Discontinuation of therapy for longer than a month (or use of HT in placebo group) | Not stated | 41.1% compliant for whole follow‐up period (median 3 years) | 50.1% compliant for whole follow‐up period (median 3 years) | ||
| > 80% of prescribed treatment taken | Pill counts | Median > 98% over median of 5 years | Median > 98% over median of 5 years | ||
| Percentage of study medication consumed | Pill counts | Level of adherence 95% in the 87% of participants evaluated | Level of adherence 92% in the 92% of participants evaluated | ||
| > 80% of prescribed treatment taken | Number of collected and returned drugs and clinic reports | < 40% compliant at 3 years (estimated from graph) | < 30% compliant at 3 years (estimated from graph) | ||
| Percentage of study medication taken | Pill counts | Level of adherence at 3.2 years: Women on combined HRT, measured in 82% of participants only: 84% | Level of adherence at 3.2 years: | ||
| "Regular tablet use" | Self‐report to family doctor. Self‐report to study nurse at 6 weeks and whenever in contact with trial staff | Number non‐adherent: | Number non‐adherent: | Triallists attribute higher non‐compliance in HRT group to prevalence of vaginal bleeding (reported by 56% in HRT group, 7% in controls) | |
| Adherence not described | |||||
| Adherence not described | |||||
| "Taking at least 80% of medication for at least 80% of entire study period" | Pill counts 6‐monthly | 90% adherent at 3 years | 94% adherent at 3 years | ||
| Taking at least 80% of study medication | Pill counts | 79% adherent at 1 year | 91% adherent at 1 year | Proportion of women who reported taking study medication at 1 year: | |
| Pill or patch counts, percentage used | Pill counts or weights | 94%‐95% in all groups, among women who completed trial at 4 years | |||
| Taking at least 80% of study medication | Plasma oestradiol level evaluation at each visit | No information given in publication | |||
| Adherence not described | |||||
| Adherence not described | |||||
| Adherence not described | |||||
| Taking at least 80% of study medication | Study diary reviewed at clinic visits | Number adherent at 36 months: Women with uterus: | Number adherent at 36 months: Women with uterus: 76% | ||
| Taking at least 80% of study medication | Pill counts weekly | No information given in publication | |||
| Percentage of study medication taken | Pill counts | At 2.8 years: | At 2.8 years: | ||
| Percentage of study medication taken | Self‐report to study nurse 3‐monthly | At 2.8 years: Mean adherence excluding dropouts: 90% | At 2.8 years: Mean adherence excluding dropouts: 90% 24% discontinued medication | ||
| WHI 1998 (unopposed oestrogen arm) | Taking at least 80% of study medication. Temporary discontinuation (e.g. during surgery) permitted | Weighing of returned medication bottles | At 6.8 years, about 53.8% of women were non‐adherent | At 6.8 years, about 53.8% of women were non‐adherent | |
| WHI 1998 (combined arm) | Taking at least 80% of study medication. Temporary discontinuation (e.g. during surgery) permitted | Weighing of returned medication bottles | 42% non‐adherent by 5.2 years | 10.7% crossed to active treatment by 5.2 years | Analyses censoring events 6 months after non‐adherence increased effect sizes |
| Supply of study medication | Time at risk minus temporary interruptions and time after withdrawal from treatment | 73% of time | 86% of time | Women had a 3 month run‐in period on placebo. Only women who took 80% of tablets were randomised | |
| Supply of study medication | Patch counts: 75% use over 2 years counted as compliance | 84% | 84% of time | Women had a 1 week run‐in period. Only compliant women were randomised. |
| Study | Comparison | Instrument | Measure | Outcome | Intervention | Effect |
| Oestrogen (CEE or oestradiol) + cyclic oral micronised progesterone 200 mg/d × 12 days per month vs placebo (n = 275) for 48 months | Modified Mini Mental State Examination (MMSE) | Differences between intervention and placebo groups in mean rate of change over time | Global cognition | 0.45 mg/d oral CEE (n = 230) | P = 0.178 | |
| 0.05 mg/d transdermal oestradiol (n = 222) | P = 0.840 |
| Outcome or subgroup title | No. of studies | No. of participants | Statistical method | Effect size |
| 1 Death from any cause: oestrogen‐only HT Show forest plot | 2 | Risk Ratio (M‐H, Fixed, 95% CI) | Subtotals only | |
| 1.1 Oestradiol 1 mg (low dose) for 2 years | 1 | 222 | Risk Ratio (M‐H, Fixed, 95% CI) | 0.33 [0.01, 8.10] |
| 1.2 CEE 0.625 mg (mod dose) for 7.1 years | 1 | 10739 | Risk Ratio (M‐H, Fixed, 95% CI) | 1.03 [0.88, 1.20] |
| 1.3 CEE 0.625 mg (mod dose) for 10.7 years (includes extra follow‐up) | 1 | 10739 | Risk Ratio (M‐H, Fixed, 95% CI) | 1.02 [0.91, 1.13] |
| 2 Death from any cause: combined HT Show forest plot | 5 | Risk Ratio (M‐H, Fixed, 95% CI) | Subtotals only | |
| 2.1 CEE 0.625 mg (mod dose) + MPA 2.5 mg for mean/median 1 year | 2 | 20993 | Risk Ratio (M‐H, Fixed, 95% CI) | 1.31 [0.76, 2.27] |
| 2.2 CEE 0.625 mg (mod dose) + MPA 2.5 mg for 2 years | 1 | 16608 | Risk Ratio (M‐H, Fixed, 95% CI) | 1.05 [0.71, 1.56] |
| 2.3 CEE 0.625 mg (mod dose) + P (as per footnotes) for 3 years | 3 | 18075 | Risk Ratio (M‐H, Fixed, 95% CI) | 1.09 [0.81, 1.46] |
| 2.4 CEE 0.045 mg (lowish dose) + 200 mg sequential progesterone for 4 years | 1 | 505 | Risk Ratio (M‐H, Fixed, 95% CI) | 3.58 [0.15, 87.57] |
| 2.5 CEE 0.625 mg (mod dose) + MPA 2.5 mg for 5.6 years | 1 | 16608 | Risk Ratio (M‐H, Fixed, 95% CI) | 1.00 [0.84, 1.19] |
| 2.6 CEE 0.625 mg (mod dose) + MPA 2.5 mg for 7.9 years | 1 | 16608 | Risk Ratio (M‐H, Fixed, 95% CI) | 1.06 [0.93, 1.20] |
| 2.7 CEE 0.625 mg (mod dose) + MPA 2.5 mg after 13.2 years (includes extended follow‐up) | 1 | 16608 | Risk Ratio (M‐H, Fixed, 95% CI) | 1.00 [0.92, 1.08] |
| 3 Death from any cause: oestrogen with or without sequential progesterone vaginal gel Show forest plot | 1 | Risk Ratio (M‐H, Fixed, 95% CI) | Subtotals only | |
| 3.1 Oestradiol 1 mg daily, with or without cyclic 4% vaginal progesterone gel | 1 | 643 | Risk Ratio (M‐H, Fixed, 95% CI) | 0.99 [0.06, 15.77] |
| 4 Death from coronary heart disease: oestrogen‐only HT Show forest plot | 2 | Risk Ratio (M‐H, Fixed, 95% CI) | Subtotals only | |
| 4.1 Oestradiol 1 mg (low dose) daily for 2 years | 1 | 222 | Risk Ratio (M‐H, Fixed, 95% CI) | 0.33 [0.01, 8.10] |
| 4.2 CEE 0.625 mg (mod dose) for 7.1 years | 1 | 10739 | Risk Ratio (M‐H, Fixed, 95% CI) | 0.98 [0.69, 1.38] |
| 4.3 CEE 0.625 mg (mod dose) after 10.7 years (includes extra follow‐up) | 1 | 10739 | Risk Ratio (M‐H, Fixed, 95% CI) | 0.92 [0.71, 1.19] |
| 5 Death from coronary heart disease: combined continuous HT Show forest plot | 1 | Risk Ratio (M‐H, Fixed, 95% CI) | Subtotals only | |
| 5.1 CEE 0.625 mg (mod dose) + MPA 2.5 mg for mean 5.6 years | 1 | 16608 | Risk Ratio (M‐H, Fixed, 95% CI) | 1.06 [0.68, 1.66] |
| 5.2 CEE 0.625 mg (mod dose) + MPA 2.5 mg for mean 7.9 years | 1 | 16608 | Risk Ratio (M‐H, Fixed, 95% CI) | 0.99 [0.72, 1.38] |
| 6 Death from coronary heart disease: combined sequential HT Show forest plot | 1 | Risk Ratio (M‐H, Fixed, 95% CI) | Subtotals only | |
| 6.1 1 mg 17‐B‐oestradiol (low dose) daily plus (3 days weekly) 0.35 mg norethindrone for 2 years | 1 | 142 | Risk Ratio (M‐H, Fixed, 95% CI) | 0.34 [0.01, 8.27] |
| 7 Death from stroke: oestrogen‐only HT Show forest plot | 1 | Risk Ratio (M‐H, Fixed, 95% CI) | Subtotals only | |
| 7.1 CEE 0.625 mg (low dose) for 7.1 years | 1 | 10739 | Risk Ratio (M‐H, Fixed, 95% CI) | 1.16 [0.58, 2.32] |
| 8 Death from stroke: combined sequential HT Show forest plot | 1 | Risk Ratio (M‐H, Fixed, 95% CI) | Subtotals only | |
| 8.1 1 mg 17‐B‐oestradiol (low dose) daily plus (3 days weekly) 0.35 mg norethindrone for 2 years | 1 | 142 | Risk Ratio (M‐H, Fixed, 95% CI) | 3.08 [0.13, 74.46] |
| 9 Death from stroke: combined continuous HT Show forest plot | 2 | Risk Ratio (M‐H, Fixed, 95% CI) | Subtotals only | |
| 9.1 CEE 0.625 mg (mod dose) + MPA 2.5 mg for median 1 year | 1 | 4385 | Risk Ratio (M‐H, Fixed, 95% CI) | 2.99 [0.12, 73.37] |
| 9.2 CEE 0.625 mg (mod dose) + MPA 2.5 mg for mean 5.6 years | 1 | 16608 | Risk Ratio (M‐H, Fixed, 95% CI) | 1.04 [0.46, 2.35] |
| 10 Death from colorectal cancer: oestrogen‐only HT Show forest plot | 1 | Risk Ratio (M‐H, Fixed, 95% CI) | Subtotals only | |
| 10.1 CEE 0.625 mg (mod dose) for 7.1 years | 1 | 10739 | Risk Ratio (M‐H, Fixed, 95% CI) | 1.28 [0.66, 2.46] |
| 11 Death from breast cancer: combined continuous HT Show forest plot | 1 | Risk Ratio (M‐H, Fixed, 95% CI) | Subtotals only | |
| 12 Death from breast cancer: oestrogen‐only HT Show forest plot | 1 | Risk Ratio (M‐H, Fixed, 95% CI) | Subtotals only | |
| 12.1 CEE 0.625 mg (mod dose) after median 11.8 years (includes extra follow‐up) | 1 | 10739 | Risk Ratio (M‐H, Fixed, 95% CI) | 0.38 [0.15, 0.98] |
| 13 Death from colorectal cancer: combined continuous HT Show forest plot | 1 | Risk Ratio (M‐H, Fixed, 95% CI) | Subtotals only | |
| 13.1 CEE 0.625 mg (mod dose) + MPA 2.5 mg for mean 5.6 years | 1 | 16608 | Risk Ratio (M‐H, Fixed, 95% CI) | 0.95 [0.40, 2.29] |
| 13.2 CEE 0.625 mg (mod dose) + MPA 2.5 mg for 7.1 years | 1 | 16608 | Risk Ratio (M‐H, Fixed, 95% CI) | 1.01 [0.52, 1.96] |
| 13.3 CEE 0.0625 mg (mod dose) + MPA 2.5 mg after 11.6 years | 1 | 16608 | Risk Ratio (M‐H, Fixed, 95% CI) | 1.31 [0.80, 2.14] |
| 14 Death from lung cancer: oestrogen‐only HT (moderate dose) Show forest plot | 1 | Risk Ratio (M‐H, Fixed, 95% CI) | Subtotals only | |
| 14.1 Death from lung cancer (non‐small cell or small cell) | 1 | 10739 | Risk Ratio (M‐H, Fixed, 95% CI) | 1.05 [0.65, 1.70] |
| 14.2 Death from non‐small cell lung cancer | 1 | 10739 | Risk Ratio (M‐H, Fixed, 95% CI) | 0.88 [0.52, 1.50] |
| 14.3 Death from small cell lung cancer | 1 | 10739 | Risk Ratio (M‐H, Fixed, 95% CI) | 2.04 [0.62, 6.79] |
| 15 Death from lung cancer: combined continuous HT (moderate dose) Show forest plot | 1 | Risk Ratio (M‐H, Fixed, 95% CI) | Subtotals only | |
| 15.1 Death from lung cancer (non‐small cell or small cell) at mean 7.9 years | 1 | 16608 | Risk Ratio (M‐H, Fixed, 95% CI) | 1.74 [1.18, 2.55] |
| 15.2 Death from non‐small cell lung cancer at mean 7.9 years | 1 | 16608 | Risk Ratio (M‐H, Fixed, 95% CI) | 1.91 [1.24, 2.93] |
| 15.3 Death from small cell lung cancer at mean 7.9 years | 1 | 16608 | Risk Ratio (M‐H, Fixed, 95% CI) | 1.16 [0.48, 2.81] |
| 15.4 Death from lung cancer (any type) at median 14 years | 1 | 16608 | Risk Ratio (M‐H, Fixed, 95% CI) | 1.10 [0.88, 1.39] |
| 16 Death from lung cancer: combined sequential HT (low dose oestrogen) Show forest plot | 1 | Risk Ratio (M‐H, Fixed, 95% CI) | Subtotals only | |
| 16.1 1 mg 17‐B‐oestradiol (low dose) daily plus (3 days weekly) 0.35 mg norethindrone for 2 years | 1 | 142 | Risk Ratio (M‐H, Fixed, 95% CI) | 3.08 [0.13, 74.46] |
| 17 Death from any cancer: combined continuous HT Show forest plot | 2 | Risk Ratio (M‐H, Fixed, 95% CI) | Subtotals only | |
| 17.1 CEE O.625 mg daily (mod dose) + MPA 2.5 mg for 3 years | 1 | 777 | Risk Ratio (M‐H, Fixed, 95% CI) | 2.77 [0.11, 67.80] |
| 17.2 CEE 0.625 mg daily (mod dose) + MPA 2.5 mg for mean 5.2 years | 1 | 16608 | Risk Ratio (M‐H, Fixed, 95% CI) | 1.16 [0.87, 1.53] |
| 18 Coronary events (MI or cardiac death): oestrogen‐only HT Show forest plot | 3 | Risk Ratio (M‐H, Fixed, 95% CI) | Subtotals only | |
| 18.1 Oestradiol 1 mg (low dose) for 2 years | 1 | 222 | Risk Ratio (M‐H, Fixed, 95% CI) | 0.5 [0.05, 5.43] |
| 18.2 CEE 0.625 mg (mod dose) for 3 years | 1 | 349 | Risk Ratio (M‐H, Fixed, 95% CI) | 2.98 [0.12, 72.72] |
| 18.3 CEE 0.625 mg (mod dose) for mean 7.1 years | 1 | 10739 | Risk Ratio (M‐H, Fixed, 95% CI) | 0.94 [0.78, 1.13] |
| 18.4 CEE 0.65 (mod dose) for 10.7 years (includes extra follow‐up) | 1 | 10739 | Risk Ratio (M‐H, Fixed, 95% CI) | 0.95 [0.82, 1.10] |
| 19 Coronary events (MI or cardiac death): combined continuous HT Show forest plot | 3 | Risk Ratio (M‐H, Fixed, 95% CI) | Subtotals only | |
| 19.1 CEE 0.625 mg (mod dose) + MPA 2.5 mg for mean/median 1 year | 2 | 20993 | Risk Ratio (M‐H, Fixed, 95% CI) | 1.89 [1.15, 3.10] |
| 19.2 CEE 0.625 mg (mod dose) + MPA 2.5 mg for 2 years | 1 | 16608 | Risk Ratio (M‐H, Fixed, 95% CI) | 1.49 [1.05, 2.12] |
| 19.3 CEE 0.625 mg (mod dose) + MPA 2.5 mg for 3 years | 2 | 17385 | Risk Ratio (M‐H, Fixed, 95% CI) | 1.45 [1.07, 1.98] |
| 19.4 CEE 0.625 mg (mod dose) + MPA 2.5 mg for mean 5.6 years | 1 | 16608 | Risk Ratio (M‐H, Fixed, 95% CI) | 1.17 [0.95, 1.44] |
| 19.5 CEE 0.625 mg (mod dose) + MPA 2.5 mg after 13.2 years (includes extended follow‐up) | 1 | 16608 | Risk Ratio (M‐H, Fixed, 95% CI) | 1.08 [0.95, 1.22] |
| 20 Coronary events (MI or cardiac death): combined sequential HT Show forest plot | 3 | Risk Ratio (M‐H, Fixed, 95% CI) | Subtotals only | |
| 20.1 CEE 0.625 mg (mod dose) daily + micronised progesterone 200 mg days 1‐12 for 3 years | 1 | 352 | Risk Ratio (M‐H, Fixed, 95% CI) | 4.89 [0.24, 101.09] |
| 20.2 1 mg (low dose) 17‐B‐oestradiol daily plus (3 days weekly) 0.35 mg norethindrone for 2 years | 1 | 142 | Risk Ratio (M‐H, Fixed, 95% CI) | 0.34 [0.01, 8.27] |
| 20.3 Oestradiol patch 0.05 mg (mod dose) + 200 mg sequential progesterone for 4 years | 1 | 497 | Risk Ratio (M‐H, Fixed, 95% CI) | 3.71 [0.15, 90.70] |
| 21 Coronary events (MI or cardiac death): oestrogen with or without sequential progesterone vaginal gel Show forest plot | 1 | Risk Ratio (M‐H, Fixed, 95% CI) | Subtotals only | |
| 21.1 Oestradiol 1 mg daily, with or without cyclic 4% vaginal progesterone gel | 1 | 643 | Risk Ratio (M‐H, Fixed, 95% CI) | 0.33 [0.03, 3.16] |
| 22 Stroke: unopposed oestrogen Show forest plot | 2 | Risk Ratio (M‐H, Fixed, 95% CI) | Subtotals only | |
| 22.1 Oestradiol 1 mg (low dose) for 2 years | 1 | 222 | Risk Ratio (M‐H, Fixed, 95% CI) | 3.0 [0.12, 72.86] |
| 22.2 CEE 0.625 mg (mod dose) for mean 7.1 years | 1 | 10739 | Risk Ratio (M‐H, Fixed, 95% CI) | 1.33 [1.06, 1.67] |
| 22.3 CEE 0.625 mg (mod dose) for 10.7 years (includes extra follow‐up) | 1 | 10739 | Risk Ratio (M‐H, Fixed, 95% CI) | 1.17 [0.97, 1.40] |
| 23 Stroke: combined continuous HT Show forest plot | 2 | Risk Ratio (M‐H, Fixed, 95% CI) | Subtotals only | |
| 23.1 CEE 0.625 mg (mod dose) + MPA 2.5 mg for 1 year | 1 | 16608 | Risk Ratio (M‐H, Fixed, 95% CI) | 0.95 [0.49, 1.86] |
| 23.2 CEE 0.625 mg (mod dose) + MPA 2.5 mg for 2 years | 1 | 16608 | Risk Ratio (M‐H, Fixed, 95% CI) | 1.31 [0.83, 2.06] |
| 23.3 CEE 0.625 mg (mod dose) + MPA 2.5 mg for 3 years | 2 | 17385 | Risk Ratio (M‐H, Fixed, 95% CI) | 1.46 [1.02, 2.09] |
| 23.4 CEE 0.625 mg (mod dose) + MPA 2.5 mg for mean 5.6 years | 1 | 16608 | Risk Ratio (M‐H, Fixed, 95% CI) | 1.39 [1.09, 1.77] |
| 23.5 CEE 0.625 mg (mod dose) + MPA 2.5 mg for mean 7.9 years | 1 | 16608 | Risk Ratio (M‐H, Fixed, 95% CI) | 1.29 [1.06, 1.56] |
| 23.6 CEE 0.625 mg (mod dose) + MPA 2.5 mg after 13.2 years (includes extended follow‐up) | 1 | 16608 | Risk Ratio (M‐H, Fixed, 95% CI) | 1.15 [0.99, 1.33] |
| 24 Stroke: combined sequential HT Show forest plot | 2 | Risk Ratio (M‐H, Fixed, 95% CI) | Subtotals only | |
| 24.1 1 mg (low dose) 17‐B‐oestradiol daily plus (3 days weekly) 0.35 mg norethindrone for 2 years | 1 | 142 | Risk Ratio (M‐H, Fixed, 95% CI) | 3.08 [0.13, 74.46] |
| 24.2 CEE 0.625 mg (mod dose) daily + MPA 10 mg days 1‐12 for 3 years | 1 | 348 | Risk Ratio (M‐H, Fixed, 95% CI) | 3.0 [0.12, 73.14] |
| 25 Stroke: combined sequential HT Show forest plot | 1 | Risk Ratio (M‐H, Fixed, 95% CI) | Subtotals only | |
| 25.1 CEE 0.625 mg (mod dose) daily + micronised progesterone 200 mg days 1‐12 for 3 years | 1 | 352 | Risk Ratio (M‐H, Fixed, 95% CI) | 2.93 [0.12, 71.51] |
| 26 Transient ischaemic attack: oestrogen‐only HT Show forest plot | 1 | Risk Ratio (M‐H, Fixed, 95% CI) | Subtotals only | |
| 26.1 Oestradiol 1 mg (low dose) for 2 years | 1 | 222 | Risk Ratio (M‐H, Fixed, 95% CI) | 3.0 [0.12, 72.86] |
| 27 Transient ischaemic attack: combined sequential HT Show forest plot | 2 | Risk Ratio (M‐H, Fixed, 95% CI) | Subtotals only | |
| 27.1 1 mg 17‐B‐oestradiol (low dose) daily plus (3 days weekly) 0.35 mg norethindrone for 2 years | 1 | 142 | Risk Ratio (M‐H, Fixed, 95% CI) | 1.03 [0.07, 16.13] |
| 27.2 CEE 0.625 mg (mod dose) daily + MPA 10 mg days 1‐12 for 3 years | 1 | 348 | Risk Ratio (M‐H, Fixed, 95% CI) | 3.0 [0.12, 73.14] |
| 28 Transient ischaemic attack: oestrogen with or without sequential progesterone vaginal gel Show forest plot | 1 | Risk Ratio (M‐H, Fixed, 95% CI) | Subtotals only | |
| 28.1 Oestradiol 1 mg daily,with or without cyclic 4% vaginal progesterone gel | 1 | 643 | Risk Ratio (M‐H, Fixed, 95% CI) | 0.50 [0.05, 5.44] |
| 29 Stroke or transient ischaemic attack Show forest plot | 1 | Risk Ratio (M‐H, Fixed, 95% CI) | Subtotals only | |
| 29.1 CEE 0.625 mg (mod dose) + MPA 2.5 mg for mean/median 1 year | 1 | 4385 | Risk Ratio (M‐H, Fixed, 95% CI) | 0.73 [0.37, 1.46] |
| 30 Venous thromboembolism (DVT or PE): oestrogen‐only HT Show forest plot | 2 | Risk Ratio (M‐H, Fixed, 95% CI) | Subtotals only | |
| 30.1 CEE 0.625 mg (mod dose) for up to 2 years | 1 | 10739 | Risk Ratio (M‐H, Fixed, 95% CI) | 2.22 [1.12, 4.39] |
| 30.2 CEE 0.625 mg (mod dose) for 3 years | 1 | 349 | Risk Ratio (M‐H, Fixed, 95% CI) | 6.96 [0.36, 133.75] |
| 30.3 CEE 0.625 mg (mod dose) for 7.1 years | 1 | 10739 | Risk Ratio (M‐H, Fixed, 95% CI) | 1.32 [1.00, 1.74] |
| 30.4 CEE 0.625 mg (mod dose) for 10.7 years (includes extra follow‐up) | 1 | 10739 | Risk Ratio (M‐H, Fixed, 95% CI) | 1.04 [0.84, 1.29] |
| 31 Venous thromboembolism (DVT or PE): combined sequential HT Show forest plot | 3 | Risk Ratio (M‐H, Fixed, 95% CI) | Subtotals only | |
| 31.1 1 mg 17‐B‐oestradiol (low dose) daily plus (3 days weekly) 0.35 mg norethindrone for 2 years | 1 | 142 | Risk Ratio (M‐H, Fixed, 95% CI) | 3.08 [0.13, 74.46] |
| 31.2 CEE 0.625 mg (mod dose) daily + MPA 10 mg days 1‐12 for 3 years | 1 | 348 | Risk Ratio (M‐H, Fixed, 95% CI) | 3.0 [0.12, 73.14] |
| 31.3 CEE 0.045 mg (lowish dose) + 200 mg sequential progesterone for 4 years | 1 | 505 | Risk Ratio (M‐H, Fixed, 95% CI) | 0.40 [0.02, 9.73] |
| 31.4 Oestradiol patch 0.05 mg (mod dose) + 200 mg sequential progesterone for 4 years | 1 | 497 | Risk Ratio (M‐H, Fixed, 95% CI) | 1.24 [0.08, 19.69] |
| 32 Venous thromboembolism (DVT or PE): combined continuous HT Show forest plot | 2 | Risk Ratio (M‐H, Fixed, 95% CI) | Subtotals only | |
| 32.1 CEE 0.625 mg (mod dose) + MPA 2.5 mg for mean/median 1 year | 2 | 20993 | Risk Ratio (M‐H, Fixed, 95% CI) | 4.28 [2.49, 7.34] |
| 32.2 CEE 0.625 mg (mod dose) + MPA 2.5 mg for 2 years | 1 | 16608 | Risk Ratio (M‐H, Fixed, 95% CI) | 2.98 [1.88, 4.71] |
| 32.3 CEE 0.625 mg (mod dose) + MPA 2.5 mg for 3 years | 1 | 16608 | Risk Ratio (M‐H, Fixed, 95% CI) | 2.54 [1.73, 3.72] |
| 32.4 CEE 0.625 mg (mod dose) + MPA 2.5 mg for mean 5.6 years | 1 | 16608 | Risk Ratio (M‐H, Fixed, 95% CI) | 2.03 [1.55, 2.64] |
| 32.5 CEE 0.625 mg (mod dose) + 2.5 mg MPA for mean 7.9 years | 1 | 16707 | Risk Ratio (M‐H, Fixed, 95% CI) | 1.65 [1.32, 2.05] |
| 33 Venous thromboembolism (DVT or PE): oestrogen with or without sequential progesterone vaginal gel Show forest plot | 1 | Risk Ratio (M‐H, Random, 95% CI) | Subtotals only | |
| 33.1 Oestradiol 1 mg daily, with or without cyclic 4% vaginal progesterone gel | 1 | 643 | Risk Ratio (M‐H, Random, 95% CI) | 1.49 [0.25, 8.83] |
| 34 Global cognitive function Show forest plot | 4 | Mean Difference (Fixed, 95% CI) | Subtotals only | |
| 34.1 Transdermal estradiol 0.014 mg (low dose): MMSE scores (baseline MMSE ≤ 90) | 1 | Mean Difference (Fixed, 95% CI) | ‐1.21 [‐5.05, 2.63] | |
| 34.2 Transdermal estradiol 0.014 mg (low dose): MMSE scores (baseline MMSE > 90) | 1 | Mean Difference (Fixed, 95% CI) | ‐0.3 [‐0.73, 0.13] | |
| 34.3 CEE 0.625 mg (mod dose) with or without 2.5 mg MPA for 3 years: MMSE scores | 1 | Mean Difference (Fixed, 95% CI) | ‐0.1 [‐0.35, 0.15] | |
| 34.4 CEE 0.625 mg (mod dose) for mean 5.2 years: MMSE scores | 1 | Mean Difference (Fixed, 95% CI) | ‐0.26 [‐0.52, 0.00] | |
| 34.5 Combined continuous CEE 0.625 mg (mod dose) + MPA 2.5 mg for mean 4.2 years: MMSE scores | 1 | Mean Difference (Fixed, 95% CI) | ‐0.18 [‐0.36, 0.00] | |
| 34.6 Oestrogen with or without sequential progesterone vaginal gel | 1 | Mean Difference (Fixed, 95% CI) | ‐0.03 [‐0.21, 0.15] | |
| 35 Probable dementia Show forest plot | 1 | Risk Ratio (M‐H, Fixed, 95% CI) | Subtotals only | |
| 35.1 CEE 0.625 mg (mod dose) for 5.2 years | 1 | 2947 | Risk Ratio (M‐H, Fixed, 95% CI) | 1.52 [0.89, 2.59] |
| 35.2 Combined continuous CEE 0.625 mg (mod dose) + MPA 2.5 mg for mean 4.05 years | 1 | 4532 | Risk Ratio (M‐H, Fixed, 95% CI) | 1.97 [1.16, 3.33] |
| Outcome or subgroup title | No. of studies | No. of participants | Statistical method | Effect size |
| 1 Death from any cause: oestrogen‐only HT Show forest plot | 3 | Risk Ratio (M‐H, Fixed, 95% CI) | Subtotals only | |
| 1.1 CEE 0.625 mg (mod dose) daily for 3 years (2.8‐3.2) | 2 | 327 | Risk Ratio (M‐H, Fixed, 95% CI) | 1.31 [0.53, 3.22] |
| 1.2 Oestradiol valerate 2 mg (mod dose) for 2 years | 1 | 1017 | Risk Ratio (M‐H, Fixed, 95% CI) | 0.81 [0.51, 1.27] |
| 2 Death from any cause: oestrogen‐only or combined sequential HT Show forest plot | 1 | Risk Ratio (M‐H, Fixed, 95% CI) | Subtotals only | |
| 2.1 Oestradiol 1 mg (low dose) daily (if no uterus) plus MPA 5 mg for 12 days a year (if uterus intact) for 2.8 years | 1 | 664 | Risk Ratio (M‐H, Fixed, 95% CI) | 1.14 [0.77, 1.67] |
| 3 Death from any cause: combined continuous HT Show forest plot | 3 | Risk Ratio (M‐H, Fixed, 95% CI) | Subtotals only | |
| 3.1 CEE 0.625 mg (mod dose) + MPA 2.5 mg for 2.8‐3.2 years | 2 | 297 | Risk Ratio (M‐H, Fixed, 95% CI) | 0.86 [0.28, 2.62] |
| 3.2 CEE 0.625 mg (mod dose) + MPA 2.5 mg for 4 years | 1 | 2763 | Risk Ratio (M‐H, Fixed, 95% CI) | 1.06 [0.84, 1.34] |
| 3.3 CEE 0.625 mg (mod dose) + MPA 2.5 mg for 4‐7 years UNBLINDED | 1 | 2321 | Risk Ratio (M‐H, Fixed, 95% CI) | 1.14 [0.90, 1.44] |
| 4 Death from coronary heart disease: oestrogen‐only HT Show forest plot | 3 | Risk Ratio (M‐H, Fixed, 95% CI) | Subtotals only | |
| 4.1 CEE 0.625 mg (mod dose) daily for 2.8‐3.2 years | 2 | 327 | Risk Ratio (M‐H, Fixed, 95% CI) | 1.31 [0.36, 4.77] |
| 4.2 Oestradiol valerate 2 mg (mod dose) for 2 years | 1 | 1017 | Risk Ratio (M‐H, Fixed, 95% CI) | 0.69 [0.40, 1.18] |
| 5 Death from CHD: oestrogen‐only or combined sequential HT Show forest plot | 1 | Risk Ratio (M‐H, Fixed, 95% CI) | Subtotals only | |
| 5.1 Oestradiol 1 mg (low dose) daily (if no uterus) plus MPA 5 mg for 12 days a year (if uterus intact) for 2.8 years | 1 | 664 | Risk Ratio (M‐H, Fixed, 95% CI) | 0.82 [0.37, 1.81] |
| 6 Death from CHD: combined continuous HT Show forest plot | 3 | Risk Ratio (M‐H, Fixed, 95% CI) | Subtotals only | |
| 6.1 CEE 0.625 mg (mod dose) daily + MPA 2.5 mg for 1 year | 1 | 2763 | Risk Ratio (M‐H, Fixed, 95% CI) | 1.55 [0.73, 3.29] |
| 6.2 CEE 0.625 mg (mod dose) daily + MPA 2.5 mg for 2 years | 1 | 2763 | Risk Ratio (M‐H, Fixed, 95% CI) | 1.50 [0.90, 2.51] |
| 6.3 CEE 0.625 mg (mod dose) daily + MPA 2.5 mg for 3 years (2.8‐3.2) | 3 | 3060 | Risk Ratio (M‐H, Fixed, 95% CI) | 1.30 [0.88, 1.90] |
| 6.4 CEE 0.625 mg (mod dose) daily + MPA 2.5 mg for 4+ years (median 4.1) | 1 | 2763 | Risk Ratio (M‐H, Fixed, 95% CI) | 1.19 [0.85, 1.67] |
| 6.5 CEE 0.625 mg (mod dose) daily + MPA 2.5 mg for 4‐6.8 years | 1 | 2321 | Risk Ratio (M‐H, Fixed, 95% CI) | 0.99 [0.71, 1.39] |
| 7 Coronary event (MI or cardiac death): oestrogen‐only HT Show forest plot | 1 | Risk Ratio (M‐H, Fixed, 95% CI) | Subtotals only | |
| 7.1 Oestradiol valerate 2 mg (mod dose) for 2 years | 1 | 1017 | Risk Ratio (M‐H, Fixed, 95% CI) | 1.00 [0.72, 1.39] |
| 8 Death from stroke: oestrogen‐only or combined sequential HT Show forest plot | 1 | Risk Ratio (M‐H, Fixed, 95% CI) | Subtotals only | |
| 8.1 Oestradiol 1 mg (low dose) daily (if no uterus) plus MPA 5 mg for 12 days a year (if uterus intact) for 2.8 years | 1 | 664 | Risk Ratio (M‐H, Fixed, 95% CI) | 2.91 [0.95, 8.93] |
| 9 Death from cancer: combined continuous HT Show forest plot | 1 | Risk Ratio (M‐H, Fixed, 95% CI) | Subtotals only | |
| 9.1 CEE 0.625 mg daily (mod dose) + MPA 2.5 mg for 4+ years (median 4.1) | 1 | 2763 | Risk Ratio (M‐H, Fixed, 95% CI) | 0.88 [0.49, 1.57] |
| 9.2 CEE 0.625 mg daily (mod dose) + MPA 2.5 mg for 4‐6.8 years UNBLINDED | 1 | 2321 | Risk Ratio (M‐H, Fixed, 95% CI) | 1.51 [0.86, 2.65] |
| 10 Coronary event (MI or cardiac death): oestrogen‐only HT Show forest plot | 2 | Risk Ratio (M‐H, Fixed, 95% CI) | Subtotals only | |
| 10.1 CEE 0.625 (mod dose) daily for 2.8‐3.2 years | 2 | 327 | Risk Ratio (M‐H, Fixed, 95% CI) | 1.13 [0.54, 2.40] |
| 11 Coronary event: oestrogen‐only or combined sequential HT Show forest plot | 1 | Risk Ratio (M‐H, Fixed, 95% CI) | Subtotals only | |
| 11.1 Oestradiol 1 mg (low dose) daily (if no uterus) plus MPA 5 mg for 12 days a year (if uterus intact) for 2.8 years | 1 | 664 | Risk Ratio (M‐H, Fixed, 95% CI) | 0.97 [0.57, 1.65] |
| 12 Coronary event (MI or cardiac death): combined continuous HT Show forest plot | 3 | Risk Ratio (M‐H, Fixed, 95% CI) | Subtotals only | |
| 12.1 CEE 0.625 mg (mod dose) + MPA 2.5 mg for 1 year | 1 | 2763 | Risk Ratio (M‐H, Fixed, 95% CI) | 1.50 [1.00, 2.25] |
| 12.2 CEE 0.625 mg (mod dose) + MPA 2.5 mg for 2 years | 1 | 2763 | Risk Ratio (M‐H, Fixed, 95% CI) | 1.20 [0.91, 1.58] |
| 12.3 CEE 0.625 mg (mod dose) + MPA 2.5 mg for 3 years (2.8‐3.2) | 3 | 3060 | Risk Ratio (M‐H, Fixed, 95% CI) | 1.07 [0.86, 1.33] |
| 12.4 CEE 0.625 mg (mod dose) + MPA 2.5 mg for median 4.1 years | 1 | 2763 | Risk Ratio (M‐H, Fixed, 95% CI) | 0.99 [0.81, 1.19] |
| 12.5 CEE 0.625 mg (mod dose) + MPA 2.5 mg for 4‐6.8 years UNBLINDED | 1 | 2321 | Risk Ratio (M‐H, Fixed, 95% CI) | 1.01 [0.78, 1.29] |
| 13 Stroke (first or recurrent): oestrogen‐only HT or combined sequential Show forest plot | 1 | Risk Ratio (M‐H, Fixed, 95% CI) | Subtotals only | |
| 13.1 Oestradiol 1 mg daily (low dose) (if no uterus) plus MPA 5 mg for 12 days a year (if uterus intact) for 2.8 years | 1 | 664 | Risk Ratio (M‐H, Fixed, 95% CI) | 1.09 [0.79, 1.51] |
| 14 Stroke (first or recurrent): oestrogen‐only HT (mod dose) Show forest plot | 2 | Risk Ratio (M‐H, Fixed, 95% CI) | Subtotals only | |
| 14.1 CEE 0.625 mg (mod dose) daily for 2.8 years | 1 | 122 | Risk Ratio (M‐H, Fixed, 95% CI) | 0.69 [0.12, 3.98] |
| 14.2 Oestradiol valerate 2 mg (mod dose) for 2 years | 1 | 1017 | Risk Ratio (M‐H, Fixed, 95% CI) | 1.64 [0.60, 4.47] |
| 15 Stroke (first or recurrent): combined continuous HT (mod dose oestrogen) Show forest plot | 3 | Risk Ratio (M‐H, Fixed, 95% CI) | Subtotals only | |
| 15.1 Continuous oestradiol 2 mg (mod dose) + norethisterone acetate 1 mg for 1.3 years | 1 | 140 | Risk Ratio (M‐H, Fixed, 95% CI) | 0.32 [0.01, 7.82] |
| 15.2 CEE 0.625 mg (mod dose) + MPA for 2.8 years | 1 | 88 | Risk Ratio (M‐H, Fixed, 95% CI) | 5.23 [0.26, 105.85] |
| 15.3 CEE 0.625 mg (mod dose) + MPA 2.5 mg for median 4.1 years | 1 | 2763 | Risk Ratio (M‐H, Fixed, 95% CI) | 1.23 [0.90, 1.68] |
| 15.4 CEE 0.625 mg (mod dose) + MPA for 4‐6.8 years UNBLINDED | 1 | 2321 | Risk Ratio (M‐H, Fixed, 95% CI) | 1.05 [0.71, 1.57] |
| 16 Transient ischaemic attack: oestrogen‐only HT (mod dose) Show forest plot | 1 | Risk Ratio (M‐H, Fixed, 95% CI) | Subtotals only | |
| 16.1 Oestradiol valerate 2 mg (mod dose) for 2 years | 1 | 1017 | Risk Ratio (M‐H, Fixed, 95% CI) | 1.13 [0.54, 2.36] |
| 17 Transient ischaemic attack: oestrogen‐only or combined sequential HT Show forest plot | 1 | Risk Ratio (M‐H, Fixed, 95% CI) | Subtotals only | |
| 17.1 Oestradiol 1 mg (low dose) daily (if no uterus) plus MPA 5 mg for 12 days a year (if uterus intact) for 2.8 years | 1 | 664 | Risk Ratio (M‐H, Fixed, 95% CI) | 1.16 [0.70, 1.94] |
| 18 Transient ischaemic attack: combined continuous HT Show forest plot | 1 | Risk Ratio (M‐H, Fixed, 95% CI) | Subtotals only | |
| 18.1 CEE 0.625 mg (mod dose) + MPA 2.5 mg for 4 years | 1 | 2763 | Risk Ratio (M‐H, Fixed, 95% CI) | 0.80 [0.51, 1.23] |
| 18.2 CEE 0.625 mg (mod dose) + MPA 2.5 mg for 4‐6.8 years UNBLINDED | 1 | 2321 | Risk Ratio (M‐H, Fixed, 95% CI) | 0.95 [0.49, 1.84] |
| 19 Stroke or transient ischaemic attack: oestrogen‐only HT Show forest plot | 1 | Risk Ratio (M‐H, Fixed, 95% CI) | Subtotals only | |
| 19.1 CEE 0.625 mg (mod dose) daily for 3.2 years | 1 | 205 | Risk Ratio (M‐H, Fixed, 95% CI) | 0.88 [0.28, 2.78] |
| 20 Stroke or transient ischaemic attack: combined continuous HT Show forest plot | 1 | Risk Ratio (M‐H, Fixed, 95% CI) | Subtotals only | |
| 20.1 CEE 0.625 mg (mod dose) + MPA 2.5 mg for 3.2 years | 1 | 209 | Risk Ratio (M‐H, Fixed, 95% CI) | 1.01 [0.34, 3.03] |
| 21 VTE (first or recurrent PE or DVT): oestrogen‐only HT Show forest plot | 3 | Risk Ratio (M‐H, Fixed, 95% CI) | Subtotals only | |
| 21.1 Oestradiol valerate 2 mg (mod dose) for 2 years | 1 | 1017 | Risk Ratio (M‐H, Fixed, 95% CI) | 1.23 [0.33, 4.55] |
| 21.2 CEE 0.625 mg (mod dose) daily for 2.8‐3.2 years | 2 | 327 | Risk Ratio (M‐H, Fixed, 95% CI) | 1.64 [0.44, 6.17] |
| 22 VTE (first or recurrent PE or DVT): combined continuous HT Show forest plot | 4 | Risk Ratio (M‐H, Fixed, 95% CI) | Subtotals only | |
| 22.1 CEE 0.625 mg (mod dose) + MPA 2.5 mg for 1 year | 1 | 2763 | Risk Ratio (M‐H, Fixed, 95% CI) | 3.26 [1.06, 9.96] |
| 22.2 Continuous oestradiol 2 mg (mod dose) + norethisterone acetate 1 mg for 1.3 years | 1 | 140 | Risk Ratio (M‐H, Fixed, 95% CI) | 6.80 [0.86, 53.85] |
| 22.3 CEE 0.625 mg (mod dose) + MPA 2.5 mg for 2 years | 1 | 2763 | Risk Ratio (M‐H, Fixed, 95% CI) | 3.51 [1.42, 8.66] |
| 22.4 CEE 0.625 mg (mod dose) + MPA 2.5 mg for 3 years (2.8‐3.2) | 3 | 3060 | Risk Ratio (M‐H, Fixed, 95% CI) | 3.01 [1.50, 6.04] |
| 22.5 CEE 0.625 mg (mod dose) + MPA 2.5 mg for median 4.1 years | 1 | 2763 | Risk Ratio (M‐H, Fixed, 95% CI) | 2.62 [1.39, 4.94] |
| 22.6 CEE 0.625 mg (mod dose) + MPA 2.5 mg for 4‐7 years UNBLINDED | 1 | 2321 | Risk Ratio (M‐H, Fixed, 95% CI) | 1.37 [0.63, 2.98] |
| Outcome or subgroup title | No. of studies | No. of participants | Statistical method | Effect size |
| 1 Worsening of dementia on treatment (by ADCS‐CGIC score): oestrogen‐only HT Show forest plot | 1 | Risk Ratio (M‐H, Fixed, 95% CI) | Totals not selected | |
| 1.1 Unopposed CEE 0.625 mg (mod dose) or 1.25 mg (high dose) daily for 1 year | 1 | Risk Ratio (M‐H, Fixed, 95% CI) | 0.0 [0.0, 0.0] | |
| Outcome or subgroup title | No. of studies | No. of participants | Statistical method | Effect size |
| 1 Death from any cause: oestrogen‐only HT Show forest plot | 1 | Risk Ratio (M‐H, Fixed, 95% CI) | Subtotals only | |
| 1.1 CEE 0.625 mg (mod dose) daily for median 3 years | 1 | 1236 | Risk Ratio (M‐H, Fixed, 95% CI) | 1.37 [0.77, 2.45] |
| 2 Death from endometrial cancer: oestrogen‐only HT Show forest plot | 1 | Risk Ratio (M‐H, Fixed, 95% CI) | Subtotals only | |
| 2.1 CEE 0.625 mg (mod dose) daily for median 3 years | 1 | 1236 | Risk Ratio (M‐H, Fixed, 95% CI) | 1.25 [0.34, 4.63] |
| 3 Death from CHD: oestrogen‐only HT Show forest plot | 1 | Risk Ratio (M‐H, Fixed, 95% CI) | Subtotals only | |
| 3.1 CEE 0.625 mg (mod dose) daily for median 3 years | 1 | 1236 | Risk Ratio (M‐H, Fixed, 95% CI) | 1.25 [0.34, 4.63] |
| Outcome or subgroup title | No. of studies | No. of participants | Statistical method | Effect size |
| 1 All‐cause death: combined sequential HT Show forest plot | 1 | Risk Ratio (M‐H, Fixed, 95% CI) | Subtotals only | |
| 1.1 CEE 2.5 mg (high dose) daily + MPA 10 mg for 7 days each cycle | 1 | 168 | Risk Ratio (M‐H, Fixed, 95% CI) | 0.43 [0.11, 1.60] |
| 2 Myocardial infarction: combined sequential HT Show forest plot | 1 | Risk Ratio (M‐H, Fixed, 95% CI) | Subtotals only | |
| 2.1 CEE 2.5 mg (high dose) daily + MPA 10 mg for 7 days each cycle | 1 | 168 | Risk Ratio (M‐H, Fixed, 95% CI) | 0.33 [0.04, 3.14] |
| 3 Venous thromboembolism (DVT or PE): combined sequential HT Show forest plot | 1 | Risk Ratio (M‐H, Fixed, 95% CI) | Subtotals only | |
| 3.1 CEE 2.5 mg (high dose) daily + MPA 10 mg for 7 days each cycle | 1 | 168 | Risk Ratio (M‐H, Fixed, 95% CI) | 0.33 [0.01, 8.07] |
| Outcome or subgroup title | No. of studies | No. of participants | Statistical method | Effect size |
| 1 Breast cancer: oestrogen‐only HT Show forest plot | 7 | Risk Ratio (M‐H, Fixed, 95% CI) | Subtotals only | |
| 1.1 Oestrogen only HRT patch 0.025 (low dose) mg daily for 2 years | 1 | 176 | Risk Ratio (M‐H, Fixed, 95% CI) | 2.93 [0.12, 71.04] |
| 1.2 Oestradiol 1 mg (low dose) for 2 years | 1 | 222 | Risk Ratio (M‐H, Fixed, 95% CI) | 0.33 [0.01, 8.10] |
| 1.3 Oestradiol valerate 2 mg (mod dose) for 2 years | 1 | 1017 | Risk Ratio (M‐H, Fixed, 95% CI) | 0.98 [0.25, 3.91] |
| 1.4 Oestradiol patch 0.075 mg (high dose) for 2 years | 1 | 176 | Risk Ratio (M‐H, Fixed, 95% CI) | 2.93 [0.12, 71.04] |
| 1.5 CEE 0.625 mg (mod dose) for 2.8‐3.2 years | 3 | 676 | Risk Ratio (M‐H, Fixed, 95% CI) | 2.05 [0.38, 11.04] |
| 1.6 CEE 0.625 mg (mod dose) for 7.1 years | 1 | 10739 | Risk Ratio (M‐H, Fixed, 95% CI) | 0.79 [0.61, 1.01] |
| 1.7 CEE 0.625 mg (mod dose) after 10.7 years (includes extra follow‐up) | 1 | 10739 | Risk Ratio (M‐H, Fixed, 95% CI) | 0.78 [0.63, 0.96] |
| 1.8 CEE 0.625 mg (mod dose) after 13 years (includes extra follow‐up) | 1 | 10739 | Risk Ratio (M‐H, Fixed, 95% CI) | 0.80 [0.65, 0.97] |
| 2 Breast cancer: oestrogen‐only or combined HT Show forest plot | 1 | Odds Ratio (M‐H, Fixed, 95% CI) | Totals not selected | |
| 2.1 CEE 0.625 mg (mod dose) with or without 2.5 mg MPA for 3 years | 1 | Odds Ratio (M‐H, Fixed, 95% CI) | 0.0 [0.0, 0.0] | |
| 3 Breast cancer: combined continuous HT Show forest plot | 5 | Risk Ratio (M‐H, Fixed, 95% CI) | Subtotals only | |
| 3.1 CEE 0.625 mg (mod dose) + MPA 2.5 mg for mean/median 1 year | 2 | 23182 | Risk Ratio (M‐H, Fixed, 95% CI) | 0.52 [0.28, 0.96] |
| 3.2 CEE 0.625 mg (mod dose) + MPA 2.5 mg for 2 years | 1 | 16608 | Risk Ratio (M‐H, Fixed, 95% CI) | 0.71 [0.47, 1.08] |
| 3.3 CEE 0.625 mg (mod dose) + MPA 2.5 mg for 2.8‐3.4 years | 3 | 17733 | Risk Ratio (M‐H, Fixed, 95% CI) | 0.85 [0.62, 1.18] |
| 3.4 CEE 0.625 mg (mod dose) + MPA 2.5 mg for 4 years | 1 | 2763 | Risk Ratio (M‐H, Fixed, 95% CI) | 1.36 [0.82, 2.27] |
| 3.5 CEE 0.625 mg (mod dose) + MPA 2.5 mg for 5.6 years | 1 | 16608 | Risk Ratio (M‐H, Fixed, 95% CI) | 1.27 [1.03, 1.56] |
| 3.6 CEE 0.625 mg (mod dose) + MPA 2.5 mg for 4‐7 years unblinded | 1 | 2321 | Risk Ratio (M‐H, Fixed, 95% CI) | 1.08 [0.52, 2.23] |
| 3.7 CEE 0.625 mg (mod dose) + MPA 2.5 mg for 7.9 years | 1 | 16607 | Risk Ratio (M‐H, Fixed, 95% CI) | 1.27 [1.07, 1.52] |
| 3.8 CEE 0.625 mg (mod dose) + MPA 2.5 mg after 11 years (includes extra follow‐up) | 1 | 16608 | Risk Ratio (M‐H, Fixed, 95% CI) | 1.25 [1.08, 1.45] |
| 3.9 CEE 0.625 mg (mod dose) + MPA 2.5 mg after 13.2 years (includes extended follow up) | 1 | 16608 | Risk Ratio (M‐H, Fixed, 95% CI) | 1.28 [1.11, 1.47] |
| 4 Breast cancer: combined sequential HT Show forest plot | 3 | Risk Ratio (M‐H, Fixed, 95% CI) | Subtotals only | |
| 4.1 CEE 0.625 mg (mod dose) daily + MPA 10 mg days 1‐12 for 3 years | 1 | 348 | Risk Ratio (M‐H, Fixed, 95% CI) | 2.0 [0.18, 21.85] |
| 4.2 CEE 0.625 mg (mod dose) daily + micronised progesterone 200 mg days 1‐12 for 3 years | 1 | 352 | Risk Ratio (M‐H, Fixed, 95% CI) | 3.91 [0.44, 34.64] |
| 4.3 CEE 0.045 mg (lowish dose) + 200 mg sequential progesterone for 4 years | 1 | 505 | Risk Ratio (M‐H, Fixed, 95% CI) | 1.79 [0.30, 10.64] |
| 4.4 Oestradiol patch 0.05 mg (mod dose) + 200 mg sequential progesterone for 4 years | 1 | 497 | Risk Ratio (M‐H, Fixed, 95% CI) | 1.86 [0.31, 11.02] |
| 4.5 CEE 2.5 mg daily (high dose) + MPA 10 mg for 7 days each cycle for 10 years | 1 | 168 | Risk Ratio (M‐H, Fixed, 95% CI) | 0.11 [0.01, 2.03] |
| 5 Breast cancer: oestrogen with or without sequential progesterone vaginal gel Show forest plot | 1 | Risk Ratio (M‐H, Fixed, 95% CI) | Subtotals only | |
| 5.1 Oestradiol 1 mg daily, with or without cyclic 4% vaginal progesterone gel | 1 | 643 | Risk Ratio (M‐H, Fixed, 95% CI) | 1.24 [0.50, 3.10] |
| 6 Colorectal cancer: oestrogen‐only HT Show forest plot | 2 | Risk Ratio (M‐H, Fixed, 95% CI) | Subtotals only | |
| 6.1 CEE 0.625 mg (mod dose) for 3 years | 1 | 349 | Risk Ratio (M‐H, Fixed, 95% CI) | 0.33 [0.01, 8.08] |
| 6.2 CEE 0.625 (mod dose) for 7.1 years | 1 | 10739 | Risk Ratio (M‐H, Fixed, 95% CI) | 1.15 [0.81, 1.63] |
| 6.3 CEE 0.625 mg (mod dose) for 10.7 years (includes extra follow‐up) | 1 | 10739 | Risk Ratio (M‐H, Fixed, 95% CI) | 1.11 [0.82, 1.49] |
| 7 Colorectal cancer: oestrogen‐only or combined HT Show forest plot | 1 | Odds Ratio (M‐H, Fixed, 95% CI) | Totals not selected | |
| 7.1 CEE 0.625 mg (mod dose) with or without 2.5 mg MPA for 3 years | 1 | Odds Ratio (M‐H, Fixed, 95% CI) | 0.0 [0.0, 0.0] | |
| 8 Colorectal cancer: combined continuous HT Show forest plot | 4 | Risk Ratio (M‐H, Fixed, 95% CI) | Subtotals only | |
| 8.1 CEE 0.625 mg (mod dose) + MPA 2.5 mg for mean/median 1 year | 2 | 20993 | Risk Ratio (M‐H, Fixed, 95% CI) | 0.68 [0.32, 1.42] |
| 8.2 CEE 0.625 mg (mod dose) + MPA 2.5 mg for 2 years | 1 | 16608 | Risk Ratio (M‐H, Fixed, 95% CI) | 0.83 [0.46, 1.50] |
| 8.3 CEE 0.625 mg (mod dose) + MPA 2.5 mg for 3 years | 2 | 16956 | Risk Ratio (M‐H, Fixed, 95% CI) | 0.81 [0.49, 1.34] |
| 8.4 CEE 0.625 mg (mod dose) + 2.5 mg MPA for 4 years | 1 | 2763 | Risk Ratio (M‐H, Fixed, 95% CI) | 0.69 [0.32, 1.48] |
| 8.5 CEE 0.625 mg (mod dose) + MPA 2.5 mg for mean 5.6 years | 1 | 16608 | Risk Ratio (M‐H, Fixed, 95% CI) | 0.64 [0.44, 0.91] |
| 8.6 CEE 0.625 mg (mod dose) + 2.5 mg MPA for 4‐6.8 years UNBLINDED | 1 | 2321 | Risk Ratio (M‐H, Fixed, 95% CI) | 0.81 [0.46, 1.44] |
| 8.7 CEE 0.625 mg (mod dose) + MPA 2.5 mg after 7.9 years (includes extended follow‐up) | 1 | 16608 | Risk Ratio (M‐H, Fixed, 95% CI) | 0.76 [0.57, 1.01] |
| 8.8 CEE 0.0625 mg (mod dose) + MPA 2.5 mg after 11.6 years (includes extended follow‐up) | 1 | 16608 | Risk Ratio (M‐H, Fixed, 95% CI) | 0.78 [0.61, 0.99] |
| 8.9 CEE 0.0625 mg (mod dose) + MPA 2.5 mg after 13.2 years (includes extended follow‐up) | 1 | 16608 | Risk Ratio (M‐H, Fixed, 95% CI) | 0.80 [0.63, 1.01] |
| 9 Colorectal cancer: combined sequential HT Show forest plot | 2 | Risk Ratio (M‐H, Fixed, 95% CI) | Subtotals only | |
| 9.1 CEE 0.625 mg (mod dose) daily + MPA 10 mg days 1‐12 for 3 years | 1 | 348 | Risk Ratio (M‐H, Fixed, 95% CI) | 0.33 [0.01, 8.13] |
| 9.2 CEE 0.625 mg (mod dose) daily + micronised progesterone 200 mg days 1‐12 for 3 years | 1 | 352 | Risk Ratio (M‐H, Fixed, 95% CI) | 0.33 [0.01, 7.95] |
| 9.3 CEE 2.5 mg (high dose) daily + MPA 10 mg for 7 days each cycle for 10 years | 1 | 168 | Risk Ratio (M‐H, Fixed, 95% CI) | 1.0 [0.06, 15.73] |
| 10 Colorectal cancer: oestrogen with or without sequential progesterone vaginal gel Show forest plot | 1 | Risk Ratio (M‐H, Fixed, 95% CI) | Subtotals only | |
| 10.1 Oestradiol 1 mg daily, with or without cyclic 4% vaginal progesterone gel | 1 | 643 | Risk Ratio (M‐H, Fixed, 95% CI) | 1.49 [0.25, 8.83] |
| 11 Lung cancer: oestrogen‐only HT (moderate dose) Show forest plot | 1 | Risk Ratio (M‐H, Fixed, 95% CI) | Subtotals only | |
| 11.1 Any lung cancer (non‐small cell or small cell) at 7.1 years | 1 | 10739 | Risk Ratio (M‐H, Fixed, 95% CI) | 1.04 [0.73, 1.48] |
| 12 Lung cancer: combined continuous HT (mod dose oestrogen) Show forest plot | 1 | Risk Ratio (M‐H, Fixed, 95% CI) | Subtotals only | |
| 12.1 Any lung cancer at 5.6 years (non‐small cell or small cell) | 1 | 16608 | Risk Ratio (M‐H, Fixed, 95% CI) | 1.06 [0.77, 1.46] |
| 12.2 Any lung cancer at 7.9 years | 1 | 16608 | Risk Ratio (M‐H, Fixed, 95% CI) | 1.22 [0.92, 1.62] |
| 12.3 Any lung cancer after median 14 years (includes extended follow‐up) | 1 | 16608 | Risk Ratio (M‐H, Fixed, 95% CI) | 1.13 [0.93, 1.38] |
| 13 Lung cancer: combined sequential HT Show forest plot | 1 | Odds Ratio (M‐H, Fixed, 95% CI) | Subtotals only | |
| 13.1 17‐B‐oestradiol 1 mg (low dose) daily plus (3 days weekly) 0.35 mg norethindrone for 2 years | 1 | 142 | Odds Ratio (M‐H, Fixed, 95% CI) | 3.13 [0.13, 78.13] |
| 14 Endometrial cancer: oestrogen‐only HT Show forest plot | 1 | Risk Ratio (M‐H, Fixed, 95% CI) | Subtotals only | |
| 14.1 CEE 0.625 mg (mod dose) for 3‐3.2 years | 1 | 238 | Risk Ratio (M‐H, Fixed, 95% CI) | 0.33 [0.01, 8.10] |
| 15 Endometrial cancer: combined continuous HT (mode dose oestrogen) Show forest plot | 3 | Risk Ratio (M‐H, Fixed, 95% CI) | Subtotals only | |
| 15.1 CEE 0.625 mg + MPA 2.5 mg for 1 year | 1 | 16608 | Risk Ratio (M‐H, Fixed, 95% CI) | 0.95 [0.13, 6.76] |
| 15.2 CEE 0.625 mg + MPA 2.5 mg for 2 years | 1 | 16608 | Risk Ratio (M‐H, Fixed, 95% CI) | 0.95 [0.31, 2.95] |
| 15.3 CEE 0.625 mg + MPA 2.5 mg for 3‐3.2 years | 2 | 16847 | Risk Ratio (M‐H, Fixed, 95% CI) | 0.80 [0.35, 1.82] |
| 15.4 CEE 0.625 mg + MPA 2.5 mg for 4 years | 1 | 2763 | Risk Ratio (M‐H, Fixed, 95% CI) | 0.40 [0.08, 2.06] |
| 15.5 CEE 0.625 mg + MPA 2.5 mg for 5.6 years | 1 | 16608 | Risk Ratio (M‐H, Fixed, 95% CI) | 0.86 [0.51, 1.44] |
| 15.6 CEE 0.625 mg + MPA 2.5 mg for 4‐6.8 years UNBLINDED | 1 | 2321 | Risk Ratio (M‐H, Fixed, 95% CI) | 0.14 [0.01, 2.78] |
| 15.7 CEE 0.625 + MPS 2.5 mg for 7.9 years | 1 | 16608 | Risk Ratio (M‐H, Fixed, 95% CI) | 0.81 [0.54, 1.20] |
| 15.8 CEE 0.625 mg + MPA 2.5 mg after median 13 years (includes extended follow‐up) | 1 | 16608 | Risk Ratio (M‐H, Fixed, 95% CI) | 0.66 [0.48, 0.90] |
| 16 Endometrial cancer: combined sequential HT Show forest plot | 4 | Risk Ratio (M‐H, Fixed, 95% CI) | Subtotals only | |
| 16.1 17‐B‐oestradiol 1 mg (low dose) + dydrogesterone 5 mg days 14‐28 for 2 years | 1 | 163 | Risk Ratio (M‐H, Fixed, 95% CI) | 1.90 [0.08, 45.95] |
| 16.2 CEE 0.625 mg (mod dose) daily + micronised progesterone 200 mg days 1‐12 for 3 years | 1 | 239 | Risk Ratio (M‐H, Fixed, 95% CI) | 0.33 [0.01, 8.03] |
| 16.3 Oestradiol 2 mg (mod dose) + dihydrogesterone 20 mg for 2 years | 1 | 159 | Risk Ratio (M‐H, Fixed, 95% CI) | 3.30 [0.16, 67.59] |
| 16.4 CEE 0.045 mg (lowish dose) + 200 mg sequential progesterone for 4 years | 1 | 505 | Risk Ratio (M‐H, Fixed, 95% CI) | 5.97 [0.29, 123.81] |
| 16.5 Oestradiol patch 0.05 mg (mod dose) + 200 mg sequential progesterone for 4 years | 1 | 497 | Risk Ratio (M‐H, Fixed, 95% CI) | 3.71 [0.15, 90.70] |
| 16.6 CEE 2.5 mg (high dose) daily + MPA 10 mg for 7 days each cycle for 10 years | 1 | 168 | Risk Ratio (M‐H, Fixed, 95% CI) | 0.33 [0.01, 8.07] |
| 17 Recurrent endometrial cancer: oestrogen‐only HT Show forest plot | 1 | Risk Ratio (M‐H, Fixed, 95% CI) | Subtotals only | |
| 17.1 Oestrogen (type and dose not stated) for median 3 years | 1 | 1236 | Risk Ratio (M‐H, Fixed, 95% CI) | 1.17 [0.54, 2.50] |
| 18 Ovarian cancer: combined continuous HT Show forest plot | 1 | Risk Ratio (M‐H, Fixed, 95% CI) | Subtotals only | |
| 18.1 CEE 0.625 mg (mod dose) + MPA 2.5 mg for 5.6 years | 1 | 16608 | Risk Ratio (M‐H, Fixed, 95% CI) | 1.43 [0.76, 2.69] |
| 18.2 CEE 0.625 mg (mod dose) + MPA 2.5 mg after 13.2 years (includes extended follow‐up) | 1 | 16608 | Risk Ratio (M‐H, Fixed, 95% CI) | 1.23 [0.82, 1.85] |
| 19 Ovarian cancer: oestrogen with or without sequential progesterone vaginal gel Show forest plot | 1 | Risk Ratio (M‐H, Fixed, 95% CI) | Subtotals only | |
| 19.1 Oestradiol 1 mg daily, with or without cyclic 4% vaginal progesterone gel | 1 | 643 | Risk Ratio (M‐H, Fixed, 95% CI) | 0.33 [0.01, 8.08] |
| 20 Gallbladder disease requiring surgery: oestrogen‐only HT Show forest plot | 3 | 8930 | Risk Ratio (M‐H, Fixed, 95% CI) | 1.75 [1.40, 2.19] |
| 20.1 CEE 0.625 mg (mod dose) for 3‐3.2 years | 2 | 554 | Risk Ratio (M‐H, Fixed, 95% CI) | 0.77 [0.17, 3.39] |
| 20.2 CEE O.625 mg (mod dose) for 7.1 years | 1 | 8376 | Risk Ratio (M‐H, Fixed, 95% CI) | 1.78 [1.42, 2.24] |
| 21 Gallbladder disease requiring surgery: combined continuous HT Show forest plot | 4 | Risk Ratio (M‐H, Fixed, 95% CI) | Subtotals only | |
| 21.1 CEE 0.625 mg (mod dose) + 2.5 mg MPA for 3 years | 2 | 557 | Risk Ratio (M‐H, Fixed, 95% CI) | 2.01 [0.61, 6.59] |
| 21.2 CEE 0.625 mg (mod dose) + 2.5 mg MPA for 4 years | 1 | 2253 | Risk Ratio (M‐H, Fixed, 95% CI) | 1.35 [0.98, 1.85] |
| 21.3 CEE 0.625 mg (mod dose) + 2.5 mg MPA for mean 5.6 years | 1 | 14203 | Risk Ratio (M‐H, Fixed, 95% CI) | 1.64 [1.30, 2.06] |
| 22 Gallbladder disease requiring surgery: combined sequential HT Show forest plot | 1 | Risk Ratio (M‐H, Fixed, 95% CI) | Subtotals only | |
| 22.1 CEE 0.625 mg (mod dose) daily + MPA 10 mg days 1‐12 for 3 years | 1 | 348 | Risk Ratio (M‐H, Fixed, 95% CI) | 2.0 [0.37, 10.78] |
| 22.2 CEE 0.625 mg (mod dose) daily + micronised progesterone 200 mg days 1‐12 for 3 years | 1 | 352 | Risk Ratio (M‐H, Fixed, 95% CI) | 1.47 [0.25, 8.67] |
| 23 Hip fractures: oestrogen‐only HT Show forest plot | 1 | Risk Ratio (M‐H, Fixed, 95% CI) | Subtotals only | |
| 23.1 CEE 0.625 mg (mod dose) for 7.1 years | 1 | 10739 | Risk Ratio (M‐H, Fixed, 95% CI) | 0.66 [0.46, 0.95] |
| 23.2 CEE 0.625 mg (mod dose) for 10.7 years (includes extra follow‐up) | 1 | 10739 | Risk Ratio (M‐H, Fixed, 95% CI) | 0.92 [0.71, 1.18] |
| 23.3 CEE 0.625 mg (mod dose) after 13.2 years (includes extended follow‐up) | 1 | 10739 | Risk Ratio (M‐H, Fixed, 95% CI) | 0.93 [0.74, 1.17] |
| 24 Hip fractures: oestrogen‐only or combined sequential HT Show forest plot | 1 | Risk Ratio (M‐H, Fixed, 95% CI) | Subtotals only | |
| 24.1 Oestradiol 1 mg (low dose) daily (if no uterus) plus MPA 5 mg for 12 days a year (if uterus intact) for 2.8 years | 1 | 664 | Risk Ratio (M‐H, Fixed, 95% CI) | 0.62 [0.27, 1.42] |
| 25 Hip fractures: combined continuous HT Show forest plot | 3 | Risk Ratio (M‐H, Fixed, 95% CI) | Subtotals only | |
| 25.1 CEE 0.625 mg (mod dose) + MPA 2.5 mg for mean/median 1 year | 2 | 20993 | Risk Ratio (M‐H, Fixed, 95% CI) | 0.64 [0.26, 1.57] |
| 25.2 CEE 0.625 mg (mod dose) + MPA 2.5 mg for 2 years | 1 | 16608 | Risk Ratio (M‐H, Fixed, 95% CI) | 0.61 [0.31, 1.18] |
| 25.3 CEE 0.625 mg (mod dose) + MPA 2.5 mg for 3 years | 1 | 16608 | Risk Ratio (M‐H, Fixed, 95% CI) | 0.70 [0.42, 1.17] |
| 25.4 CEE 0.625 mg (mod dose) + MPA 2.5 mg for 4 years | 1 | 2763 | Risk Ratio (M‐H, Fixed, 95% CI) | 1.16 [0.55, 2.42] |
| 25.5 CEE 0.625 mg (mod dose) + MPA 2.5 mg for 5.6 years | 1 | 16608 | Risk Ratio (M‐H, Fixed, 95% CI) | 0.67 [0.47, 0.96] |
| 25.6 CEE 0.625 mg (mod dose) + MPA 2.5 mg for 4‐6.8 years UNBLINDED | 1 | 2321 | Risk Ratio (M‐H, Fixed, 95% CI) | 2.10 [1.06, 4.16] |
| 25.7 CEE 0.625 mg (mod dose) + 2.5 mg MPA for 7.9 years | 1 | 16608 | Risk Ratio (M‐H, Fixed, 95% CI) | 0.77 [0.60, 0.99] |
| 25.8 CEE 0.625 mg (mod dose) + 2.5 mg MPA after 13.2 years (includes extended follow‐up) | 1 | 16608 | Risk Ratio (M‐H, Fixed, 95% CI) | 0.82 [0.69, 0.97] |
| 26 Hip fractures: combined sequential HT Show forest plot | 1 | Risk Ratio (M‐H, Fixed, 95% CI) | Subtotals only | |
| 26.1 17‐B‐oestradiol 1 mg (low dose) daily plus (3 days weekly) 0.35 mg norethindrone for 2 years | 1 | 142 | Risk Ratio (M‐H, Fixed, 95% CI) | 0.34 [0.01, 8.27] |
| 27 Vertebral fractures: oestrogen‐only HT Show forest plot | 1 | Risk Ratio (M‐H, Fixed, 95% CI) | Subtotals only | |
| 27.1 CEE 0.625 mg (mod dose) for 7.1 years | 1 | 10739 | Risk Ratio (M‐H, Fixed, 95% CI) | 0.64 [0.44, 0.94] |
| 28 Vertebral fractures: combined continuous HT Show forest plot | 2 | Risk Ratio (M‐H, Fixed, 95% CI) | Subtotals only | |
| 28.1 CEE 0.625 mg (mod dose) + MPA 2.5 mg for 4 years | 1 | 2763 | Risk Ratio (M‐H, Fixed, 95% CI) | 0.74 [0.37, 1.47] |
| 28.2 CEE 0.625 mg (mod dose) + MPA 2.5 mg for mean 5.6 years | 1 | 16608 | Risk Ratio (M‐H, Fixed, 95% CI) | 0.68 [0.49, 0.96] |
| 28.3 CEE 0.625 mg (mod dose) + MPA 2.5 mg for 4‐6.8 years UNBLINDED | 1 | 2321 | Risk Ratio (M‐H, Fixed, 95% CI) | 1.10 [0.49, 2.48] |
| 28.4 CEE 0.625 mg (mod dose) + MPA 2.5 mg for mean 7.9 years | 1 | 16608 | Risk Ratio (M‐H, Fixed, 95% CI) | 0.78 [0.60, 1.01] |
| 29 All clinical fractures: oestrogen‐only or combined sequential HT Show forest plot | 1 | Risk Ratio (M‐H, Fixed, 95% CI) | Subtotals only | |
| 29.1 Oestradiol 1 mg (low dose) daily (if no uterus) plus MPA 5 mg for 12 days a year (if uterus intact) for 2.8 years | 1 | 664 | Risk Ratio (M‐H, Fixed, 95% CI) | 1.23 [0.68, 2.19] |
| 30 All clinical fractures: oestrogen‐only HT (moderate dose) Show forest plot | 3 | Risk Ratio (M‐H, Fixed, 95% CI) | Subtotals only | |
| 30.1 Oestradiol valerate 2 mg (mod dose) for 2 years | 1 | 1017 | Risk Ratio (M‐H, Fixed, 95% CI) | 0.60 [0.29, 1.26] |
| 30.2 CEE 0.625 mg (mod dose) daily for 3.2 years | 1 | 205 | Risk Ratio (M‐H, Fixed, 95% CI) | 0.42 [0.17, 1.04] |
| 30.3 CEE 0.625 mg (mod dose) for 7.1 years | 1 | 10739 | Risk Ratio (M‐H, Fixed, 95% CI) | 0.73 [0.65, 0.80] |
| 31 All clinical fractures: oestrogen‐only or combined HT Show forest plot | 1 | Risk Ratio (M‐H, Fixed, 95% CI) | Totals not selected | |
| 31.1 CEE 0.625 mg (mod dose) with or without 2.5 mg MPA for 3 years | 1 | Risk Ratio (M‐H, Fixed, 95% CI) | 0.0 [0.0, 0.0] | |
| 32 All clinical fractures: combined continuous HT Show forest plot | 5 | Risk Ratio (M‐H, Fixed, 95% CI) | Subtotals only | |
| 32.1 CEE 0.625 mg (mod dose) + MPA 2.5 mg for median 1 year | 1 | 4385 | Risk Ratio (M‐H, Fixed, 95% CI) | 0.69 [0.46, 1.02] |
| 32.2 CEE 0.625 mg (mod dose) + MPA 2.5 mg for 3.2‐3.4 years | 2 | 986 | Risk Ratio (M‐H, Fixed, 95% CI) | 0.52 [0.32, 0.87] |
| 32.3 CEE 0.625 mg (mod dose) + MPA 2.5 mg for mean 5.6 years | 1 | 16608 | Risk Ratio (M‐H, Fixed, 95% CI) | 0.78 [0.71, 0.86] |
| 32.4 CEE 0.625 mg (mod dose) + MPA 2.5 mg for 4 years | 1 | 2763 | Risk Ratio (M‐H, Fixed, 95% CI) | 0.95 [0.76, 1.18] |
| 32.5 CEE 0.625 mg (mod dose) + MPA 2.5 mg for 4‐6.8 years UNBLINDED | 1 | 2321 | Risk Ratio (M‐H, Fixed, 95% CI) | 1.23 [0.91, 1.65] |
| 32.6 CEE 0.0625 mg (mod dose) + MPA 2.5 mg for mean 7.9 years | 1 | 16608 | Risk Ratio (M‐H, Fixed, 95% CI) | 0.82 [0.76, 0.89] |
| 33 All clinical fractures: combined sequential HT Show forest plot | 1 | Risk Ratio (M‐H, Fixed, 95% CI) | Subtotals only | |
| 33.1 17‐B‐oestradiol 1 mg (low dose) daily plus (3 days weekly) 0.35 mg norethindrone for 2 years | 1 | 142 | Risk Ratio (M‐H, Fixed, 95% CI) | 0.44 [0.12, 1.64] |