荷爾蒙療法對更年期及停經後婦女的效果
Abstract
Background
Hormone therapy (HT) is widely provided for control of menopausal symptoms and has been used for the management and prevention of cardiovascular disease, osteoporosis and dementia in older women. This is an updated version of a Cochrane review first published in 2005.
Objectives
To assess effects of long‐term HT (at least 1 year's duration) on mortality, cardiovascular outcomes, cancer, gallbladder disease, fracture and cognition in perimenopausal and postmenopausal women during and after cessation of treatment.
Search methods
We searched the following databases to September 2016: Cochrane Gynaecology and Fertility Group Trials Register, Cochrane Central Register of Controlled Trials (CENTRAL), MEDLINE, Embase and PsycINFO. We searched the registers of ongoing trials and reference lists provided in previous studies and systematic reviews.
Selection criteria
We included randomised double‐blinded studies of HT versus placebo, taken for at least 1 year by perimenopausal or postmenopausal women. HT included oestrogens, with or without progestogens, via the oral, transdermal, subcutaneous or intranasal route.
Data collection and analysis
Two review authors independently selected studies, assessed risk of bias and extracted data. We calculated risk ratios (RRs) for dichotomous data and mean differences (MDs) for continuous data, along with 95% confidence intervals (CIs). We assessed the quality of the evidence by using GRADE methods.
Main results
We included 22 studies involving 43,637 women. We derived nearly 70% of the data from two well‐conducted studies (HERS 1998; WHI 1998). Most participants were postmenopausal American women with at least some degree of comorbidity, and mean participant age in most studies was over 60 years. None of the studies focused on perimenopausal women.
In relatively healthy postmenopausal women (i.e. generally fit, without overt disease), combined continuous HT increased the risk of a coronary event (after 1 year's use: from 2 per 1000 to between 3 and 7 per 1000), venous thromboembolism (after 1 year's use: from 2 per 1000 to between 4 and 11 per 1000), stroke (after 3 years' use: from 6 per 1000 to between 6 and 12 per 1000), breast cancer (after 5.6 years' use: from 19 per 1000 to between 20 and 30 per 1000), gallbladder disease (after 5.6 years' use: from 27 per 1000 to between 38 and 60 per 1000) and death from lung cancer (after 5.6 years' use plus 2.4 years' additional follow‐up: from 5 per 1000 to between 6 and 13 per 1000).
Oestrogen‐only HT increased the risk of venous thromboembolism (after 1 to 2 years' use: from 2 per 1000 to 2 to 10 per 1000; after 7 years' use: from 16 per 1000 to 16 to 28 per 1000), stroke (after 7 years' use: from 24 per 1000 to between 25 and 40 per 1000) and gallbladder disease (after 7 years' use: from 27 per 1000 to between 38 and 60 per 1000) but reduced the risk of breast cancer (after 7 years' use: from 25 per 1000 to between 15 and 25 per 1000) and clinical fracture (after 7 years' use: from 141 per 1000 to between 92 and 113 per 1000) and did not increase the risk of coronary events at any follow‐up time.
Women over 65 years of age who were relatively healthy and taking continuous combined HT showed an increase in the incidence of dementia (after 4 years' use: from 9 per 1000 to 11 to 30 per 1000). Among women with cardiovascular disease, use of combined continuous HT significantly increased the risk of venous thromboembolism (at 1 year's use: from 3 per 1000 to between 3 and 29 per 1000). Women taking HT had a significantly decreased incidence of fracture with long‐term use.
Risk of fracture was the only outcome for which strong evidence showed clinical benefit derived from HT (after 5.6 years' use of combined HT: from 111 per 1000 to between 79 and 96 per 1000; after 7.1 years' use of oestrogen‐only HT: from 141 per 1000 to between 92 and 113 per 1000). Researchers found no strong evidence that HT has a clinically meaningful impact on the incidence of colorectal cancer.
One trial analysed subgroups of 2839 relatively healthy women 50 to 59 years of age who were taking combined continuous HT and 1637 who were taking oestrogen‐only HT versus similar‐sized placebo groups. The only significantly increased risk reported was for venous thromboembolism in women taking combined continuous HT: Their absolute risk remained low, at less than 1/500. However, other differences in risk cannot be excluded, as this study was not designed to have the power to detect differences between groups of women within 10 years of menopause.
For most studies, risk of bias was low in most domains. The overall quality of evidence for the main comparisons was moderate. The main limitation in the quality of evidence was that only about 30% of women were 50 to 59 years old at baseline, which is the age at which women are most likely to consider HT for vasomotor symptoms.
Authors' conclusions
Women with intolerable menopausal symptoms may wish to weigh the benefits of symptom relief against the small absolute risk of harm arising from short‐term use of low‐dose HT, provided they do not have specific contraindications. HT may be unsuitable for some women, including those at increased risk of cardiovascular disease, increased risk of thromboembolic disease (such as those with obesity or a history of venous thrombosis) or increased risk of some types of cancer (such as breast cancer, in women with a uterus). The risk of endometrial cancer among women with a uterus taking oestrogen‐only HT is well documented.
HT is not indicated for primary or secondary prevention of cardiovascular disease or dementia, nor for prevention of deterioration of cognitive function in postmenopausal women. Although HT is considered effective for the prevention of postmenopausal osteoporosis, it is generally recommended as an option only for women at significant risk for whom non‐oestrogen therapies are unsuitable. Data are insufficient for assessment of the risk of long‐term HT use in perimenopausal women and in postmenopausal women younger than 50 years of age.
PICO
Plain language summary
荷爾蒙療法對更年期及停經後婦女的效果
文獻回顧問題
在更年期及停經後婦女,使用一年或以上的荷爾蒙療法(HT)的臨床效果為何?
背景
荷爾蒙療法被用於控制更年期的症狀,它也可以使用在心血管疾病、骨質疏鬆症與失智症等慢性疾病的預防與管理。
研究特點
本次文獻回顧納入了22個雙盲的隨機對照試驗(RCTs),共43,637名女性。證據蒐集截至2016年11月。
主要結果
在相對健康的停經後婦女中,使用一年的合併連續型荷爾蒙療法增加了發生心臟疾病的風險,從千分之2上升至千分之3到7;亦增加發生靜脈血栓(血塊)的風險,從千分之2上升至千分之4到11。若使用荷爾蒙療法時間更久,會增加發生中風、乳癌、膽囊疾病與因肺癌死亡的風險。
使用只含有雌激素(Oestrogen)的荷爾蒙療法,在一至兩年後,會增加發生靜脈血栓的風險:從千分之2增加至千分之2到10。當使用的時間越長,也會增加發生中風與膽囊病的風險;但會降低發生乳癌的風險(在使用7年後),從千分之25減少至千分之15到25。
65歲以上的婦女使用合併連續型荷爾蒙療法,會增加失智症的發生率。
骨折的風險是荷爾蒙療法(兩種類型)中唯一顯示有充份的臨床效益證據。
無法忍受更年期症狀的婦女,可能會想去衡量短期使用低劑量荷爾蒙療法在緩解症狀的益處與引發的絕對傷害風險,但前提是她們沒有特定的禁忌症。荷爾蒙療法對某些婦女可能不適合,包含會增加罹患心血管疾病的風險、增加發生靜脈血栓的風險(如有肥胖或有靜脈血栓病史的婦女),或增加罹患某些類型的癌症風險(如乳癌、有子宮的婦女)。有子宮的婦女使用只含有雌激素的荷爾蒙療法,會造成子宮內膜癌的發生風險是被證實的。
荷爾蒙療法不適合用在心血管疾病及失智症的初級及次級預防,也不適合用在預防更年期婦女認知功能退化。雖然荷爾蒙療法被認為對更年期骨質疏鬆症的預防有成效,但它一般是推薦給有明顯風險因子的婦女,即非雌激素療法不適用的病人作選擇。沒有足夠的數據來評估圍絕經期或50歲以下的停經後婦女長期使用荷爾蒙療法的風險。
證據品質
大多數的研究中,多數面向的偏差風險是低的,整體的證據品質為中等。主要的限制為研究中僅約有30%的婦女年齡基線為50至59歲 ‐ 此年齡層婦女可能趨向使用荷爾蒙療法來緩解血管舒縮的症狀。
Authors' conclusions
Summary of findings
| Combined continuous hormone therapy (HT) compared with placebo for perimenopausal and postmenopausal women | ||||||
| Population: relatively healthy postmenopausal women Setting: community | ||||||
| Outcomes | Illustrative comparative risks* (95% CI) | Relative effect | No. of participants | Quality of the evidence | Comments | |
| Assumed risk* | Corresponding risk | |||||
| Placebo | Combined continuous hormone therapy (HT) | |||||
| Coronary events (MI or cardiac death) Follow‐up: mean/median 1 year | 2 per 1000 | 4 per 1000 | RR 1.89 | 20,993 | ⊕⊕⊕⊝ | |
| Stroke | 6 per 1000 | 8 per 1000 | RR 146 | 17,585 | ⊕⊕⊕⊝ | |
| Venous thromboembolism (DVT or PE) Follow‐up: mean/median 1 year | 2 per 1000 | 7 per 1000 | RR 4.28 | 20,993 | ⊕⊕⊕⊝ | |
| Breast cancer | 19 per 1000 | 24 per 1000 | RR 1.27 (1.03 to 1.56) | 16,608 | ⊕⊕⊕⊝ | |
| Death from lung cancer Follow‐up: median 8 yearsb | 5 per 1,000 | 9 per 1000 (6 to 13) | RR 1.74 (1.18 to 2.55) | 16,608 | ⊕⊕⊕⊝ | |
| Gallbladder disease Follow‐up: mean 5.6 years | 16 per 1000 | 27 per 1000 (21 to 34) | RR 1.64 (1.30 to 2.06) | 14,203 (1 study) | ⊕⊕⊕⊝ | |
| All clinical fractures | 111 per 1000 | 87 per 1000 | RR 0.78 | 16,608 | ⊕⊕⊕⊝ | |
| *The basis for the assumed risk is the mean risk in the control group. The corresponding risk (and its 95% confidence interval) is based on the assumed risk in the comparison group and the relative effect of the intervention (and its 95% CI). | ||||||
| GRADE Working Group grades of evidence. | ||||||
| aDowngraded one level for questionable applicability: Only about 33% of the study sample was 50‐59 years of age at baseline (i.e. the age women are most likely to consider HT for vasomotor symptoms); mean participant age was 63 years. b5.6 years' intervention plus postintervention follow‐up: post hoc analysis. | ||||||
| Oestrogen‐only hormone therapy (HT) compared with placebo for perimenopausal and postmenopausal women | ||||||
| Population: relatively healthy postmenopausal women Setting: community | ||||||
| Outcomes | Illustrative comparative risks* (95% CI) | Relative effect | No. of participants | Quality of the evidence | Comments | |
| Assumed risk | Corresponding risk | |||||
| Placebo | Oestrogen‐only hormone therapy (HT) | |||||
| Coronary events (MI or cardiac death) | 41 per 1000 | 38 per 1000 | RR 0.94 | 10,739 | ⊕⊕⊕⊝ | |
| Stroke | 24 per 1000 | 32 per 1000 | RR 1.33 | 10,739 | ⊕⊕⊕⊝ | |
| Venous thromboembolism (DVT or PE) Follow up 1‐2 years | 2 per 1000 | 5 per 1000 (2 to 10) | RR 2.22 (1.12 to 4.39) | 10,739 | ⊕⊕⊕⊝ | |
| Venous thromboembolism (DVT or PE): CEE 0.625 mg (moderate dose) | 16 per 1000 | 21 per 1000 | RR 1.32 | 10,739 | ⊕⊕⊕⊝ | |
| Breast cancer | 25 per 1000 | 20 per 1000 | RR 0.79 | 10,739 | ⊕⊕⊕⊝ | |
| Gallbladder disease Follow‐up: mean 7.1 yearsa | 27 per 1000 | 47 per 1000 (38 to 60) | RR 1.78 (1.42 to 2.24) | 8376 | ⊕⊕⊕⊝ | |
| All clinical fractures | 141 per 1000 | 103 per 1000 | RR 0.73 | 10,739 | ⊕⊕⊕⊝ | |
| *The basis for the assumed risk is the mean risk in the control group. The corresponding risk (and its 95% confidence interval) is based on the assumed risk in the comparison group and the relative effect of the intervention (and its 95% CI). | ||||||
| GRADE Working Group grades of evidence. | ||||||
| aMedian use of CEE 5.9 years (LaCroix 2011). | ||||||
Background
Description of the condition
The median age at onset of menopause varies across geographical regions. In Europe, it ranges from about 50 to 53 years, in North America from 50 to 51 years, in Latin America from 44 to 53 years and in Asia from 42 to 49 years (Palacios 2010). Most women experience menopause (the last menstrual period) after a phase of changing ovarian function (the perimenopause) that may last several years and is characterised by irregular menstrual cycles (Greendale 1999). Women are said to be postmenopausal when menstruation has ceased for 12 months. Many (although not all) perimenopausal and postmenopausal women report a variety of symptoms, including hot flushes and vaginal dryness, which probably relate to the natural decline in oestrogen levels. Symptoms tend to fluctuate and their severity varies greatly between individuals, with some reporting intense discomfort and a substantial reduction in quality of life. Most research has focused on white women, but the experience of menopause differs between women of different races and ethnicities, as well as by menopausal stage (Avis 2001; Palacios 2010). The duration of regular hot flushes is highly variable. Most women report that hot flushes last from 6 months to 2 years (Kronenberg 1994), but longitudinal research suggests that the time from onset to resolution of symptoms is often considerably longer (Guthrie 2005).
Description of the intervention
Hormone therapy (HT) consists of oestrogen alone (oestrogen‐only HT) or oestrogen combined with a progestogen (combined HT). It is available in a variety of formulations and doses that can be taken orally, vaginally or intranasally, or as an implant, skin patch, cream or gel. Clinical effects vary according to the type of HT and its duration of use.
The addition of a progestogen reduces the risk of endometrial hyperplasia associated with the use of oestrogen alone in women with a uterus (Furness 2012), but the issue is problematic because progestogens have adverse effects on blood lipids and may have the potential to cause symptoms such as headache, bloating and breast tenderness (McKinney 1998). Progestogens used for HT include synthetic derivatives of progesterone, synthetic derivatives of testosterone and natural progesterones derived from plants. These differ in their metabolic action and potential for adverse effects, and it is currently unclear which type of progestogen has the best risk‐benefit profile for use in HT. In combined HT, progestogen can be taken continuously (every day), sequentially (for part of each month) or less frequently.
Hormone therapy (HT) has been utilised for over 50 years for the treatment of women with hot flushes and other menopausal symptoms, and its efficacy is well established, as evidenced by a Cochrane systematic review of 24 randomised controlled studies of HT for hot flushes that was published between 1971 and 2000 (MacLennan 2004).
During the past 25 years, HT has also been used for the management or prevention of chronic disease. Oestrogens and progestogens affect most body systems and have been proposed as causing or preventing a wide range of conditions. Recommendations for use have varied over time, but through the 1990s, commonly held expert opinion was that most postmenopausal women could benefit from HT (Hemminki 2000a). This view was based on strong and consistent observational evidence that HT reduced the risk of coronary heart disease (CHD) by at least 30%. A meta‐analysis of 25 cohort, case‐control and angiographic studies published up to 1997 revealed a risk ratio of 0.70 (95% confidence interval (CI) 0.65 to 0.75) for CHD among oestrogen users compared with never‐users.
Other benefits reported in observational studies of HT include strong evidence of a reduction in osteoporotic fractures, a possible preventive or delaying effect on cognitive decline or dementia and even a reduction in overall mortality for current users (Barrett‐Connor 1998).
How the intervention might work
Oestrogen has a favourable effect on some biomarkers, including indicators of cardiovascular disease and disorders of bone metabolism. It has been shown to improve endothelial vasodilator function, promote angiogenesis and modulate autonomic function. Thus cardioprotective benefits of oestrogen have some biological plausibility (Miller 2008). However, biomarkers interact via multiple complex pathways, and the overall effect of oestrogen on clinical outcomes cannot be predicted with any certainty. Therefore, trials with clinical endpoints such as myocardial infarction (MI) are necessary (Banks 2009a).
Why it is important to do this review
Observational studies have revealed a range of adverse effects of HT, including doubling or tripling of the risk of thromboembolic events, a large increase in endometrial cancer risk among women taking oestrogen without progestogen, an increased incidence of gallbladder disease and a possible link between HT and breast cancer. The suggestion that HT might increase the risk of breast cancer was supported by evidence of an increase in breast density in a high proportion of women taking oestrogen, but findings have been inconsistent and controversial (Barrett‐Connor 1998). The results of a very large observational study conducted in the UK (Beral 2003) raised concerns that current users of both combined and oestrogen‐only HT were at increased risk of both incident and fatal breast cancer after relatively short periods of use. The increase in risk was greatest among users of combined HT, with no large variations reported between the effects of specific oestrogens or specific progestogens. Risks were greater if HT use started at around the time of menopause than if it started later. Breast cancer rates were highest among current users of combined HT who began use within 5 years of menopause (Beral 2011).
Coronary heart disease (CHD) is the most common cause of death and morbidity in older women, and it was held that a significant reduction in CHD risk from HT would outweigh any potential adverse effects. However, these uncontrolled studies showed strong potential for selection or compliance bias, or both, with oestrogen‐takers more likely to be healthy, well‐educated, compliant women with a lower baseline risk of cardiovascular disease. The need for randomised controlled trials has been recognised (Barrett‐Connor 2001; Hemminki 2000a). It has been suggested that wide prescribing of HT in the 1990s, despite the lack of randomised evidence of its efficacy and safety, might reflect a conflict between commercial and professional interest groups and good public policy (Hemminki 2000). Randomised controlled trials (RCTs) have failed to demonstrate the marked CHD benefits of HT seen in observational studies and have raised questions about its overall risk‐benefit profile.
Other Cochrane reviews have found strong evidence that HT is effective in treating women with menopausal symptoms. One review reported a 75% reduction in the frequency of hot flushes among perimenopausal and postmenopausal women taking HT, relative to placebo, and a statistically significant reduction in symptom severity for the HT group (odds ratio (OR) 0.13, 95% CI 0.07 to 0.23) (MacLennan 2004). Another review found that local oestrogens were more effective in relieving the symptoms of vaginal atrophy among postmenopausal women when compared with placebo or non‐hormonal gel (Suckling 2006). However, women contemplating the use of HT for menopausal symptoms must be aware of negative findings in other areas, as discussed below.
Previous and forthcoming Cochrane systematic reviews of HT in perimenopausal and postmenopausal women will explore the following topics.
-
Cardiovascular disease (Boardman 2015).
-
Dementia and cognitive function (Hogervorst 2009; Lethaby 2008).
-
Endometrial hyperplasia (Furness 2012).
-
Hot flushes (MacLennan 2004).
-
Pelvic organ prolapse (Ismail 2010).
-
Sexual function (Nastri 2012).
-
Urinary incontinence (Cody 2009).
-
Vaginal atrophy (Suckling 2006).
-
Weight and body fat distribution (Kongnyuy 1999).
In view of the large number of reviews on individual aspects of HT, review authors recognised the need for a systematic review that would provide an overview of all relevant long‐term clinical outcomes, thereby providing assistance to women and their clinicians who must make informed judgements about the use of HT. An a priori decision was made to exclude studies of duration shorter than 1 year and not to include as outcomes menopausal symptom control, early‐onset side effects of HT and surrogate measures such as endometrial hyperplasia and bone mineral density. This review is not intended to replace other Cochrane reviews on HT, including those listed above. These reviews remain an important source of evidence on individual aspects of HT and will continue to be updated regularly.
This is an updated version of the original Cochrane review first published in 2005.
Objectives
To assess effects of long‐term HT (at least 1 year's duration) on mortality, cardiovascular outcomes, cancer, gallbladder disease, fracture and cognition in perimenopausal and postmenopausal women during and after cessation of treatment.
Methods
Criteria for considering studies for this review
Types of studies
We included randomised, double‐blinded studies, which we defined as provided blinding of participants and all researchers and outcome assessors.
For cross‐over studies, we intended to use only results from the end of the first phase (before the treatment cross‐over) because of the potential carry‐over effect of HT therapy from the first treatment phase. However, we identified no cross‐over studies for inclusion.
Types of participants
Eligible participants were perimenopausal or postmenopausal women recruited from any healthcare setting or a population‐based sample.
Perimenopausal women were defined as women who had not yet had their final menstrual period but were in the transitional period between more‐or‐less regular cycles of ovulation and menstruation and complete cessation of these cycles.
Postmenopausal women were defined as women with surgical menopause (removal of both ovaries) and women with spontaneous menopause and amenorrhoea for longer than 12 months.
Studies included women both with and without a prior history of disease (e.g. cardiovascular disease, fracture, osteoporosis).
Types of interventions
All oestrogens, with and without progestogens, administered by oral, transdermal, subcutaneous or intranasal routes, and given as perimenopausal or postmenopausal therapy for any reason for 12 months or longer, compared with placebo.
Exclusion criteria
We excluded studies with co‐interventions that might potentially affect the outcomes being measured and studies of topical vaginal HT creams, topical tablets and rings. These interventions are covered in another Cochrane review (Suckling 2006).
Our rationale for excluding trials of less than 1 year's duration is that we considered such trials unlikely to be long enough for investigators to report intervention‐related clinical events.
Types of outcome measures
We considered only studies reporting at least one of the following outcomes for inclusion in this review.
-
Death from any cause (total mortality).
-
Cause‐specific mortality.
-
Coronary events (myocardial infarction or coronary death).
-
Stroke (ischaemic or haemorrhagic) or transient ischaemic attack (TIA).
-
Venous thromboembolism (pulmonary embolism or deep vein thrombosis).
-
Breast cancer.
-
Colorectal cancer.
-
Lung cancer.
-
Endometrial cancer.
-
Ovarian cancer.
-
Gallbladder disease.
-
Fractures (hip fracture, clinically diagnosed vertebral fracture, total clinically diagnosed fracture).
-
Cognitive function (using global measures) or dementia (including Alzheimer's disease) as measured in the included studies.
We planned to restrict our focus to long‐term clinical outcomes and to not include menopausal symptom control and early‐onset side effects of HT as outcomes. HT for control of hot flushes is the topic of another systematic review (MacLennan 2004).
We restricted inclusion to studies reporting one of our outcomes of interest because HT may be studied in the same population for different purposes, and we wished to ensure that we included only relevant studies.
Search methods for identification of studies
We searched for all published and unpublished double‐blinded RCTs of HT versus placebo, without language restriction and in consultation with the Gynaecology and Fertility Group (CGF) Information Specialist.
Electronic searches
We performed electronic searches of the Cochrane Gynaecology and Fertility Group (CGF) Trials Register (5 September 2016; Procite platform; Appendix 1), the Cochrane Central Register of Controlled Trials (CENTRAL) Online (5 September 2016; CRSO platform; Appendix 2), MEDLINE (1966 to 5 September 2016; Ovid platform; Appendix 3), Embase (1980 to 5 September 2016; Ovid platform; Appendix 4), PsycINFO (2010 to 5 September 2016; Ovid platform; Appendix 5) and the Cumulative Index to Nursing and Allied Health Literature (CINAHL; 1982 to September 2016; EBSCO platform; Appendix 6). We did not restrict the search by language. The GGF Information Specialist designed the search strategy.
We also searched the following trial registers for ongoing and registered trials (Appendix 7).
-
http://www.clinicaltrials.gov (a service of the US National Institutes of Health).
-
http://www.who.int/trialsearch/Default.aspx (search portal of the World Health Organization International Trials Registry Platform).
Searching other resources
We checked the reference lists of relevant publications returned by the above searches.
We contacted the following pharmaceutical companies in December 2003, via their websites or by letter, to request data from any published or unpublished randomised controlled trials of HT included in their files: Schering AG, Novartis, NovoNordisk, Paines and Byrnes/NZMS, 3M Pharmaceuticals, Organon, Wyeth. We received reprints of published studies from one company (NovoNordisk), another company reported that it had no unpublished studies with completed study reports available (Wyeth), and two companies (3M Pharmaceuticals, Organon) acknowledged our request.
We documented the search flow in a PRISMA (Preferred Reporting Items for Systematic Reviews and Meta‐Analyses) chart (Moher 2009).
Data collection and analysis
Selection of studies
One review author screened the titles or abstracts, or both, of all publications obtained by the search strategy to identify potentially eligible studies. If the abstract suggested that the study might be eligible for inclusion, we obtained the full article. Two review authors checked potentially eligible studies against the inclusion criteria of the review. They performed this assessment while unblinded and resolved any uncertainty by discussion. If necessary, we sought additional information from the corresponding author of the study.
Data extraction and management
When studies had multiple publications, the review authors collated multiple reports on the same study, so that each study rather than each report is the unit of interest in the review, and assigned such studies a single study ID with multiple references. Owing to the very large number of publications for some studies (e.g. WHI 1998), we have on occasion referred in the text to specific papers that are listed under additional references or as sub‐publications under the single study ID, to make clear where specific outcomes and time frames are reported.
When no events occurred in either comparison group for a particular outcome, we did not enter data in the Data and analyses tables for that outcome, in keeping with Cochrane recommendations (Higgins 2011).
Extracted data included study characteristics and outcome data (see data extraction table for details; Appendix 8). We corresponded with study investigators to request additional data on methods and/or results, as required.
Assessment of risk of bias in included studies
Two review authors independently assessed the included studies for risk of bias using the Cochrane risk of bias assessment tool (Higgins 2011) to examine selection (random sequence generation and allocation concealment); performance (blinding of participants and personnel); detection (blinding of outcome assessors); attrition (incomplete outcome data); reporting (selective reporting); and other bias. We resolved disagreements by discussion, or we sought assistance from a third review author. We described all judgements fully and presented our conclusions in the 'Risk of bias table' (Figure 1), which we incorporated into our interpretation of review findings by performing sensitivity analyses (see below).

Risk of bias summary: review authors' judgements about each risk of bias item for each included study.
Measures of treatment effect
We performed statistical analysis according to guidelines provided in the Cochrane Handbook for Systematic Reviews of Interventions (Higgins 2011). We analysed treatment effects by comparing outcomes for each group measured at the end of therapy, during ongoing follow‐up or at both time points.
For dichotomous data, we generated 2 × 2 tables for each study and expressed data as risk ratios (RRs) with 95% confidence intervals (CIs). If studies reported the number of events occurring in each comparison group at a mean follow‐up time (i.e. not all women had been followed up for that duration of time, and others had been followed up longer), we made the simplifying assumption that risk was constant across the follow‐up period and reported data as dichotomous data at a fixed time point. If risk varied significantly across the follow‐up period, we noted this variation in the Results section.
We expressed continuous data as mean differences (MDs) with 95% CIs.
For outcomes for which studies reported no events in the HT nor the placebo group, we did not enter results into data tables.
Unit of analysis issues
The unit of analysis was per woman.
Dealing with missing data
We analysed data on an intention‐to‐treat basis as far as possible and attempted to obtain missing data from the original trialists. Where these could not be obtained, we analysed only available data.
Assessment of heterogeneity
We considered whether clinical and methodological characteristics of the included studies were sufficiently similar for meta‐analysis to provide a clinically meaningful summary, and if this was not the case, we planned to refrain from pooling the data. We assessed statistical heterogeneity by measuring the I2statistic. We regarded I2 greater than 50% as indicating substantial heterogeneity.
Assessment of reporting biases
In view of the difficulty of detecting and correcting for publication bias and other reporting biases, the review authors aimed to minimise their potential impact by ensuring a comprehensive search for eligible studies and by staying alert for duplication of data. If we included 10 or more studies in an analysis, we planned to use a funnel plot to explore the possibility of small study effects (tendency for estimates of the intervention effect to be more beneficial in smaller studies).
Data synthesis
We planned to pool the results of individual studies (meta‐analyse) only when they were clinically similar with respect to study population, intervention and outcome of interest. If an individual study pooled the results of study arms that used different types of HT, we did not include the pooled results in this review.
We combined data for meta‐analysis by using RevMan software and the Peto‐modified Mantel‐Haenszel method. We could reach no consensus about whether a fixed‐effect or a random‐effects model should be used for meta‐analysis, so we performed both types of analysis. This could be viewed as a sensitivity analysis performed to assess the impact of the choice of model on results of the analysis; unless results proved robust to both models, we would have to treat them with caution. Published graphs display results obtained with the fixed‐effect model.
We planned to combine continuous data for meta‐analysis, had any such data been available for pooling. Meta‐analytical methods for continuous data assume that the underlying distribution of measurements is normal. The ratio of the mean to its standard deviation serves as a crude method of assessing skew if this ratio was less than 1.65 for any study group; unless original data were available for log transformation, we did not include the results in analysis tables but reported them in 'Other data' tables. We reported data in the 'Other data' section if they were clearly skewed and if investigators reported results in the publication as median values and ranges with non‐parametric tests of significance.
We conducted separate analyses according to the type of HT used (oestrogen only or combined HT). For some outcomes (death, cardiovascular disease, cognition scores), we anticipated that the effect of the intervention might differ according to the clinical status of the participant, and so we conducted separate analyses for studies of women without major health problems and for studies of women with specific health conditions. For other outcomes (cancer, cholecystic disease, fractures), we combined all available study results.
We calculated pooled RRs for all outcomes and translated our main findings into rates per thousand on the basis of rates and confidence intervals per thousand as reported in the 'Summary of findings' tables.
Subgroup analysis and investigation of heterogeneity
If we detected substantial heterogeneity (> 50%), we planned to explore possible explanations by performing subgroup analyses (e.g. different populations) and/or sensitivity analyses (e.g. by risk of bias). We planned to take any statistical heterogeneity into account when interpreting the results, especially if we noted variation in the direction of effect.
Sensitivity analysis
As noted above, we checked whether use of a random‐effects model for each analysis materially influenced our findings.
We planned to conduct sensitivity analyses to examine effects of methodological differences between studies provided we identified sufficient studies (> 5). These analyses might help to explain any substantial statistical heterogeneity that may be detected. We planned to explore the following specific differences.
-
Restricting analysis to studies with adequate methods: defined for this purpose as adequate allocation concealment, analysis by intention to treat and losses to follow‐up < 10%.
-
Differences among studies with respect to participants, interventions or clinical criteria for defining outcomes, although as noted above, we planned to refrain from combining studies that were obviously dissimilar in these respects.
We planned to conduct additional subgroup or sensitivity analyses if other possible sources of heterogeneity became evident during preparation of the review; however, we would have to interpret the results of any such post hoc analyses with great caution.
Overall quality of the body of evidence: 'Summary of findings' tables
We prepared 'Summary of findings' tables using GRADEpro (GRADEpro GDT 2014) and Cochrane methods (Higgins 2011). This table shows the overall quality of the body of evidence for the main comparisons (combined HT and oestrogen‐only HT vs placebo) and for the most clinically relevant outcomes (coronary events, stroke, venous thromboembolism, breast cancer, lung cancer, gallbladder disease, clinical fractures) in accordance with GRADE (Atkins 2004) criteria (study risk of bias, consistency of effect, imprecision, indirectness and publication bias). We justified judgements about evidence quality (high, moderate, low or very low) and documented and incorporated these judgments into reporting of results for each outcome.
Results
Description of studies
Results of the search
Results of search to 2012
We retrieved 57 studies through searches conducted up to 2012 and considered them for inclusion. We included 23 studies and excluded 34 studies.
Search update 2017
We screened 3046 records, discarded 3041 as clearly irrelevant and retained 45 articles, which we checked in full text. From these 44 articles, we identified two new studies: KEEPS 2012 (15 articles) and ELITE 2014 (5 articles). We also identified 20 articles that were additional publications related to studies already included (19 articles for WHI 1998 and one article for EPHT 2006) and five studies that we excluded (AHT 2015; Paoletti 2015; Rasgon 2014; Schierbeck 2012; SMART 2016).
For this update of the review, we also excluded three studies that were included in previous versions of the review but that no longer meet our eligibility criteria because we have decided to report fewer outcomes (Haines 2003; Nielsen 2006; Pefanco 2007). See Differences between protocol and review.
Thus we have included 22 studies and have excluded 42 studies from this review (see Figure 2 for study flow).

Study flow diagram.
Included studies
The 22 eligible studies are based on one very large study (WHI 1998). WHI 1998 incorporated randomised comparisons of two different HT regimens versus placebo and published these results separately. One study (WHI 2002) compared combined oestrogen and progesterone versus placebo and is referred to in this review as WHI 1998 (combined HT arm); the other compared oestrogen‐only HT versus placebo and is referred to in this review as WHI 1998 (oestrogen‐only HT arm). WHI 1998 also included a subgroup study known as the Women's Health Initiative Memory Study (WHIMS), which measured cognitive outcomes in older women (aged 65 to 79 years at study entry) from both arms of WHI 1998 and is referred to in this review as WHI 1998 (WHIMS) (Shumaker 1998). An additional ancillary study ‐ WHI 1998 (WHISCA) ‐ enrolled women from WHI 1998 (WHIMS) who were free of dementia to investigate the effects of HT on domain‐specific cognitive function in older women (Resnick 2004).
The 22 identified studies included 43,637 randomised women: 22,693 randomised to some form of HT and 20,928 to placebo (treatment allocation was unclear for 16 women in one study (Ferenczy 2002)). WISDOM 2007 included 1307 additional women who were randomised to a comparison of two active hormone therapies but are not included in this review. Investigators analysed results for more than 99% of these women by intention to treat. Although some studies used biological measures as their primary outcome (e.g. lumen of carotid artery), we included them because they also reported clinical endpoints relevant to this review as prespecified secondary outcomes.
The studies varied dramatically in size. The largest was WHI 1998, which randomised 27,347 participants, and the other studies varied in sample size from 40 (Tierney 2009) to 5692 (WISDOM 2007) participants. Investigators included 8000 women in each group in WHI 1998 (combined HT arm) and more than 5000 in each group in WHI 1998 (oestrogen‐only HT arm), along with more than 1400 in each group on the oestrogen‐only HT arm of WHI 1998 (WHIMS) and more than 2200 in each group on the combined arm of WHI 1998 (WHIMS). HERS 1998 included about 1380 women in each comparison group, ESPRIT 2002 included more than 500 in each group, EPHT 2006 included around 400 women in each group and KEEPS 2012 included 220 to 275 per group. Otherwise, none of the studies included more than 210 women in each group. Five of the smaller studies were single‐centred (ELITE 2014; EPAT 2001; Nachtigall 1979; Obel 1993; Tierney 2009), and it is unclear whether one study (EVTET 2000) enlisted more than one trial centre. The other 10 studies involved between 7 and 40 trial centres.
Fourteen studies were conducted in the USA, and one in each of the following countries: UK, Estonia, Norway, Canada and Denmark; three studies were international in scope (one in the USA and Canada, one in Canada and the Netherlands and one in the UK, Australia and New Zealand). Two studies (EPHT 2006; WISDOM 2007) were originally planned as part of a larger international project, but planning was beset with delays, and in the meantime, WHI 1998 began in the USA when other countries were no longer prepared to commit funds to a second study with similar objectives. Both of these studies were prematurely closed as a result of publication of early WHI 1998 findings.
We attempted to contact investigators for the following studies to request more information about their methods or outcomes: Barakat 2006; ELITE 2014; EPAT 2001; EVTET 2000; Ferenczy 2002; HERS 1998; KEEPS 2012, Mulnard 2000; Notelovitz 2002; Obel 1993; PEPI 1995; WAVE 2002; WEST 2001; WHI 1998, WISDOM 2007. Investigators from the following studies kindly supplied clarification or additional unpublished data, or both: Barakat 2006; ELITE 2014; ERA 2000; EPHT 2006; HERS 1998; Obel 1993; PEPI 1995; WAVE 2002; WISDOM 2007.
Participants
The women included in these studies were predominantly postmenopausal, spontaneously or surgically. The age of participants ranged from 26 to 91 years, with mean or median age of each study ranging from 48 to 76 years (no age was stated in Obel 1993). In more than half of the studies, mean participant age was over 60 years. Inclusion criteria varied according to the primary objectives of individual studies. Some were designed to investigate the use of HT for treatment of women with menopausal symptoms or for disease prevention and thus enrolled women in reasonably good health. Others were designed to assess whether HT was beneficial for women with a history of cancer or established disease, including heart disease, thromboembolic disease, stroke, Alzheimer's disease or long‐term medical conditions requiring hospitalisation; these studies restricted entry to women who had received a diagnosis of the condition of interest.
Studies of women without established medical conditions
Thirteen studies enrolled relatively healthy women (ELITE 2014; EPAT 2001; EPHT 2006; Ferenczy 2002; Greenspan 2005; KEEPS 2012, Notelovitz 2002; Obel 1993; PEPI 1995; Tierney 2009; WHI 1998; WISDOM 2007; Yaffe 2006). Women in some of these studies had risk factors (such as raised cholesterol), and a small minority within individual studies had a history of cardiovascular disease, but most participants were fit women without overt disease. Most of these studies were interested in the use of HT for disease prevention.
Three studies were large and investigated the use of HT to prevent cardiovascular disease while also reporting a wide range of other endpoints; researchers provided highly detailed lists of inclusion and exclusion criteria (PEPI 1995; WHI 1998, WISDOM 2007). In WHI 1998, enrolment was targeted to establish set fractions for baseline age categories and to achieve representation of racial and ethnic groups in the proportions recorded by the US census for individuals 50 to 79 years of age.
The WHI 1998 (combined HT arm) investigators noted that prevalence of prior cardiovascular disease in participants was low: 4.4% had a history of myocardial infarction, coronary revascularisation, stroke or transient ischaemic attack. They also commented that levels of cardiovascular risk factors were consistent with a generally healthy population of postmenopausal women: 2.9% reported a history of angina, 36% were hypertensive (or were being treated for hypertension), 13% were being treated for high cholesterol, 4.4% were being treated for diabetes and 10.5% were current smokers (Manson 2003). Similarly, in WHI 1998 (oestrogen‐only HT arm), participants in general were considered healthy, although 4.1% had a history of myocardial infarction or coronary revascularisation, 5.8% had a history of angina, 1.4% had a history of stroke,1.6% had a history of venous thrombosis, 48% were hypertensive (or were being treated for hypertension), 15% were receiving treatment for high cholesterol, 7.7% were being treated for diabetes and 10.5% were current smokers (Stefanick 2003).
PEPI 1995 compared the characteristics of their cohort with values returned in large US surveys and concluded that although the PEPI 1995 cohort was generally in better health than the wider US population, these individuals were not so markedly different as to limit the generalisability of study results. Both KEEPS 2012 and ELITE 2014 were designed to test whether menopausal HT initiated soon after menopause could delay progression of atherosclerosis. Two other 'prevention' studies aimed to test the possible beneficial effects of HT on arterial wall density (EPAT 2001) and bone density (Notelovitz 2002). Four much smaller studies also enrolled women without stated health problems who were in early menopause (Obel 1993) or were postmenopausal and aimed to assess the effects of HT on endometrial safety (Ferenczy 2002; Obel 1993) and other clinical outcomes (Greenspan 2005; Tierney 2009).
WISDOM 2007 recruited women with no known major health problems from general practice registers in countries with free or low fee healthcare systems. Investigators designed recruitment to target older women first; as a result, median participant age was 63 years and few women in the younger age group were included when the study closed prematurely.
Studies of women with established medical conditions or a history of cancer
Six studies included women with established cardiovascular disease (ERA 2000; ESPRIT 2002; EVTET 2000; HERS 1998; WAVE 2002; WEST 2001). ERA 2000 and WAVE 2002 included women who had coronary artery stenosis evident on angiogram. HERS 1998 and ESPRIT 2002 randomised women who had had a myocardial infarction or (in the case of HERS 1998) coronary artery surgery. EVTET 2000 and WEST 2001 included women who had had a thromboembolic (pulmonary embolism (PE) or deep vein thrombosis (DVT)) or cerebrovascular event (stroke or TIA). The largest of these six studies (HERS 1998) compared its cohort of women with a similar group of women presumed to have coronary heart disease, who were participants in a survey designed to produce nationally representative data: The HERS 1998 cohort included significantly fewer smokers, women with hypertension and women with diabetes than the comparison group, but individuals were comparable with respect to blood pressure, body mass index, physical activity and cholesterol levels.
One study (Mulnard 2000) included women with Alzheimer's disease, and an older study (Nachtigall 1979) included women with a range of medical conditions such as diabetes, need for custodial care, arteriosclerosis and chronic neurological disorders: All participants in this study were hospitalised for the duration of the 10‐year study.
One study enrolled women after surgery (including bilateral salpingo‐oophorectomy) for early‐stage endometrial cancer (Barakat 2006).
Interventions
The included studies used a wide variety of oestrogen‐alone or oestrogen and progestogen combinations as interventions; some included more than one intervention arm, each with a different dose, formulation or route of HT. Most comparisons used a moderate dose of oestrogen (e.g. oestradiol 1 mg, conjugated equine oestrogen (CEE) 0.625 mg daily, transdermal oestradiol 0.05 mg twice weekly). Nachtigall 1979 used a much higher dose than the other included studies, reflecting the fact that it was conducted many years earlier than the others.
The range of interventions used follows here.
Oestrogen‐only HTs
These included the following.
-
Oestradiol (17‐B oestradiol), an oestrogen derived from Mexican wild yam, 1 mg orally (ELITE 2014; EPAT 2001; WEST 2001).
-
Oestradiol valerate, which is a pro‐drug for oestradiol (meaning that it is converted in the body into the active form); the dose used was 2 mg (ESPRIT 2002).
-
Transdermal oestradiol skin patches; doses used were 0.014 mg (Yaffe 2006) and 0.025 mg, 0.05 mg or 0.075 mg daily (Notelovitz 2002).
-
Intranasal 17‐B oestradiol, delivered by a puff via each nostril once a day, at a dose of 0.15 mg or 0.3 mg daily (Nielsen 2006).
-
Conjugated equine oestrogen (CEE), a blend of equine oestrogens; 0.625 mg (Barakat 2006; ERA 2000; Greenspan 2005; Mulnard 2000; PEPI 1995; WAVE 2002; WHI 1998 (oestrogen‐only HT arm)) and 1.25 mg daily (Mulnard 2000). One study (Barakat 2006) allowed doubling of the dose for women who were symptomatic. WISDOM 2007 also included an oestrogen‐only arm, but the comparison group was taking combined therapy, and this comparison is not relevant to this review.
Most studies using oestrogen‐only HT did not randomise women to this comparison unless they had had a hysterectomy (Greenspan 2005; Mulnard 2000; Nachtigall 1979; Notelovitz 2002; WAVE 2002; WEST 2001; WHI 1998 (oestrogen‐only HT arm)).
Combined HT regimens
Combined regimens included one of the above types of oestrogen in combination with one of the following progestogens.
-
Medroxyprogesterone acetate (MPA), a synthetic progestogen structurally related to progesterone.
-
Dydrogesterone, a synthetic progestogen structurally related to progesterone.
-
Norethisterone (norethindrone), a synthetic progestogen structurally related to testosterone.
-
Micronised progesterone, a natural progestogen synthesised from plant sources and finely ground to improve its absorption.
-
Drosperinone, a synthetic progestogen structurally related to spironolactone.
Continuous combined regimens
These included the following.
-
CEE 0.625 mg with MPA 2.5 mg daily (EPHT 2006; ERA 2000; Greenspan 2005; HERS 1998; PEPI 1995; WAVE 2002; WHI 1998 (combined arm); WISDOM 2007).
-
CEE 2.5 mg with MPA 10 mg daily (Nachtigall 1979).
-
Oestradiol 2 mg with 1 mg norethisterone daily (EVTET 2000).
Combined sequential regimens
These included the following.
-
Oestradiol 1 mg daily with MPA 5 mg for 12 days once a year (WEST 2001).
-
Oestradiol 1 mg daily for 4 days, oestradiol 1 mg plus 0.35 mg norethindrone daily for 3 days each week (Tierney 2009).
-
Oestradiol 2 mg days 1 to 22, 1 mg days 22 to 28, with norethisterone 1 mg days 13 to 22 (Obel 1993).
-
Oestradiol 1 mg daily with dydrogesterone 5 mg or 10 mg days 14 to 28 (Ferenczy 2002).
-
Oestradiol 2 mg daily with 10 to 20 mg dydrogesterone days 14 to 28 (Ferenczy 2002).
-
Oestradiol 0.05 mg patch with cyclic micronised progesterone 200 mg daily for 12 days a month (KEEPS 2012).
-
CEE 0.425 mg daily with cyclic micronised progesterone 200 mg daily for 12 days a month (KEEPS 2012).
-
CEE 0.625 with MPA 10 mg days 1 to 12 (PEPI 1995).
-
CEE 0.625 mg with micronised progesterone 200 mg days 1 to 12 (PEPI 1995).
-
Oral oestradiol 1 mg daily, plus 40 mg cyclic micronised progesterone as 4% vaginal gel for 10 days per 30‐day cycle for women with an intact uterus only (ELITE 2014).
The control arm of each study received placebo tablets, patches or nasal spray, as appropriate.
The duration of HT use varied, with the longest study lasting 10 years (Nachtigall 1979). Three studies reported outcomes after HT use for around 1 year (EVTET 2000; Mulnard 2000; WISDOM 2007); seven measured outcomes after 2 years (EPAT 2001; ESPRIT 2002; Ferenczy 2002; Notelovitz 2002; Obel 1993; Tierney 2009; Yaffe 2006), eight at around 3 years (Barakat 2006; EPHT 2006; ERA 2000; Greenspan 2005; PEPI 1995; WAVE 2002; WEST 2001) and 1 at 4 years (KEEPS 2012). HERS 1998 measured outcomes after 4.1 years and continued the study unblinded for 2.7 additional years. ELITE 2014 measured outcomes after 2.5 years and subsequently at 5 years of HT use.
Investigators planned that interventions in the WHI study would continue for 8.5 years, but both arms of the study were terminated early. WHI 1998 (combined HT arm) was stopped early owing to net harm. Researchers reported outcomes at 5.6 years and over 4 subsequent months of follow‐up for primary and selected outcomes, incorporating events up to the date that participants were instructed to stop their study pills. WHI 1998 (oestrogen‐only HT arm) was also stopped early when it was decided that the prospect of obtaining more precise evidence about effects of the intervention was unlikely to outweigh potential harms, although no predefined safety boundaries had been crossed. Investigators reported results in the oestrogen‐only arm for a mean follow‐up of 7.1 years for primary outcomes: Median time receiving treatment was 5.9 years in the intervention group and 5.8 years in the placebo group. Additional poststudy follow‐up occurred in WHI 1998, as noted below.
Two other studies also closed prematurely in response to WHI 1998 findings (EPHT 2006; WISDOM 2007).
Outcomes
The outcomes measured by individual studies varied according to study objectives. Major clinical events were not primary outcomes for several of these studies but were measured as adverse effects, for example, cardiovascular events or the incidence of cancer and fracture in the study population, or both. Eight studies used biological measures as their primary outcome (ELITE 2014; EPAT 2001; ERA 2000; KEEPS 2012; Notelovitz 2002; PEPI 1995; WAVE 2002; Yaffe 2006).
The largest study in the review (WHI 1998) was concerned mainly with the cardioprotective role of HT in relatively healthy women, and study authors reported cardiovascular clinical endpoints as the primary outcome. They designated invasive breast cancer as a primary adverse outcome and included the incidence of other cancers, fractures, gallbladder disease and death as secondary outcomes. Two other studies (EPHT 2006; WISDOM 2007) measured similar outcomes.
WHI 1998 also conducted a number of analyses not specified in the study protocol. Lung cancer was not a prespecified outcome but was investigated in both arms of the study in post hoc analyses, which included additional follow‐up periods after the planned completion date of the study.
After the intervention phase of WHI 1998 had been completed, investigators followed up major clinical outcomes in surviving participants (i.e. those who consented), comprising 78% of participants in the oestrogen‐only arm and 83% in the combined HT arm. Median cumulative follow‐up (intervention phase plus extended follow‐up) was 13.2 years in the oestrogen‐only arm (including median postintervention follow‐up of 6.6 years) and 13 years in the combined HT group (including median postintervention follow‐up of 6.6 years) (Manson 2013).
WHI 1998 (WHIMS) comprised a large subset of older women from WHI 1998 who were evaluated for probable dementia (the planned primary outcome) and for mild cognitive impairment (as a planned secondary outcome). Researchers also reported global cognitive function, although this was not a formally preplanned endpoint. WHI 1998 (WHIMS) reported separate results for the two study arms and also pooled study results, but we did not include the pooled results in this review (see Methods).
Two smaller studies reported endometrial cancer as a primary outcome (Barakat 2006; Ferenczy 2002), and two (Obel 1993; Tierney 2009) reported as primary outcomes clinical events that were not of interest for this review, but researchers measured outcomes of interest as adverse events.
Five other studies were concerned with the effect of HT on established clinical disease. Four reported cardiovascular outcomes: Primary outcomes were myocardial infarction or death (ESPRIT 2002; HERS 1998), thromboembolism (EVTET 2000) and stroke (WEST 2001). The larger studies also measured a range of other major clinical events such as the incidence of cancer, fracture and gallbladder disease (ESPRIT 2002; HERS 1998). One study reported the effect of HT on global cognitive function (Greenspan 2005) and one on progression of symptoms in women with Alzheimer's disease (Mulnard 2000); another study measured a wide range of clinical outcomes over a treatment period of 10 years with HT in women who were receiving long‐term hospital care for a range of medical conditions (Nachtigall 1979).
Excluded studies
We excluded 42 studies from this review for the following reasons.
-
29 reported no outcomes of interest for this review.
-
5 were not double‐blinded.
-
4 used an intervention of less than 1 year's duration or reported only short‐term (3‐month) outcomes.
-
3 did not include a placebo group.
-
1 used a co‐intervention in the HT group.
See Excluded studies.
Risk of bias in included studies

Risk of bias graph: review authors' judgements about each risk of bias item presented as percentages across all included studies.
Allocation
Seventeen of the 22 studies described a satisfactory method of randomisation, which in all cases was computer generated. Sixteen described a satisfactory method of allocation concealment: In these studies, researchers entered information about an eligible participant, or they accomplished this via remote contact between the recruiting centre and the study coordinating centre or pharmacy. One of these studies (EPHT 2006) randomised women who expressed an interest in participating but did not open the randomisation envelope until their eligibility had been checked and they had consented. Two studies described using computer‐generated randomisation but did not provide details of the procedure for allocation to treatment (EVTET 2000; Mulnard 2000). Three studies supplied no detailed information about randomisation nor allocation concealment (Ferenczy 2002; Nachtigall 1979; Notelovitz 2002).
We rated 17 studies as having low risk of bias related to sequence generation and 16 as having low risk of bias related to allocation concealment. We rated remaining studies as having unclear risk of bias in these domains.
Blinding
All studies described themselves as (at least) double‐blinded. Eighteen studies explicitly stated that all participants, clinical staff and outcome assessors or research staff were blinded to treatment allocation, or they reported 'hard' outcomes unlikely to be influenced by blinding. In the WHI study, 331 women randomised to receive active treatment were unblinded and changed arms from WHI 1998 (oestrogen‐only HT arm) to WHI 1998 (combined HT arm) according to a change in protocol. Three studies apparently blinded participants and clinical staff but did not explicitly state whether outcomes assessors were also blinded (Mulnard 2000; Obel 1993; Tierney 2009)
The larger studies described an unblinded mechanism to be used when required for management of adverse effects. PEPI 1995 unblinded 39 women (4%) during the course of the study, 32 of whom were taking oestrogen‐only HT. WHI 1998 (combined HT arm) reported that during 5.6 years of follow‐up, 3444 women in the combined HT group (40%) and 548 women in the placebo group (6%) were unblinded; whereas in WHI 1998 (oestrogen‐only HT arm), only 100 women in the active group (< 2%) and 83 in the placebo group (< 2%) were unblinded. Nachtigall 1979 reported that 13 women in the HT group and 17 in the control group were unblinded. Two women were unblinded in WISDOM 2007. The other studies did not report such information.
One randomised blinded study (HERS 1998) completed 4.1 years of follow‐up and was then extended for a further duration 2.7 years unblinded.
We rated all studies as having low risk of performance bias and 19 as having low risk of detection bias. We rated three studies as having unclear risk of detection bias.
Incomplete outcome data
For the purposes of this review, we defined losses to follow‐up as participants for whom outcomes of interest were unknown (and who may or may not have had outcomes imputed in statistical analysis). We defined drop‐outs as participants who stopped their allocated treatment (and in some cases changed to a different off‐trial treatment) but had known clinical outcomes and were included in the analysis. Adherence to treatment refers to the number of tablets actually taken, which we often assessed by pill counts (Table 1). We defined intention to treat as analysis of all randomised participants in the groups to which they were randomised.
| Study | How defined | Assessment | HT group | Placebo group | Note |
| Discontinuation of therapy for longer than a month (or use of HT in placebo group) | Not stated | 41.1% compliant for whole follow‐up period (median 3 years) | 50.1% compliant for whole follow‐up period (median 3 years) | ||
| > 80% of prescribed treatment taken | Pill counts | Median > 98% over median of 5 years | Median > 98% over median of 5 years | ||
| Percentage of study medication consumed | Pill counts | Level of adherence 95% in the 87% of participants evaluated | Level of adherence 92% in the 92% of participants evaluated | ||
| > 80% of prescribed treatment taken | Number of collected and returned drugs and clinic reports | < 40% compliant at 3 years (estimated from graph) | < 30% compliant at 3 years (estimated from graph) | ||
| Percentage of study medication taken | Pill counts | Level of adherence at 3.2 years: Women on combined HRT, measured in 82% of participants only: 84% | Level of adherence at 3.2 years: | ||
| "Regular tablet use" | Self‐report to family doctor. Self‐report to study nurse at 6 weeks and whenever in contact with trial staff | Number non‐adherent: | Number non‐adherent: | Triallists attribute higher non‐compliance in HRT group to prevalence of vaginal bleeding (reported by 56% in HRT group, 7% in controls) | |
| Adherence not described | |||||
| Adherence not described | |||||
| "Taking at least 80% of medication for at least 80% of entire study period" | Pill counts 6‐monthly | 90% adherent at 3 years | 94% adherent at 3 years | ||
| Taking at least 80% of study medication | Pill counts | 79% adherent at 1 year | 91% adherent at 1 year | Proportion of women who reported taking study medication at 1 year: | |
| Pill or patch counts, percentage used | Pill counts or weights | 94%‐95% in all groups, among women who completed trial at 4 years | |||
| Taking at least 80% of study medication | Plasma oestradiol level evaluation at each visit | No information given in publication | |||
| Adherence not described | |||||
| Adherence not described | |||||
| Adherence not described | |||||
| Taking at least 80% of study medication | Study diary reviewed at clinic visits | Number adherent at 36 months: Women with uterus: | Number adherent at 36 months: Women with uterus: 76% | ||
| Taking at least 80% of study medication | Pill counts weekly | No information given in publication | |||
| Percentage of study medication taken | Pill counts | At 2.8 years: | At 2.8 years: | ||
| Percentage of study medication taken | Self‐report to study nurse 3‐monthly | At 2.8 years: Mean adherence excluding dropouts: 90% | At 2.8 years: Mean adherence excluding dropouts: 90% 24% discontinued medication | ||
| WHI 1998 (unopposed oestrogen arm) | Taking at least 80% of study medication. Temporary discontinuation (e.g. during surgery) permitted | Weighing of returned medication bottles | At 6.8 years, about 53.8% of women were non‐adherent | At 6.8 years, about 53.8% of women were non‐adherent | |
| WHI 1998 (combined arm) | Taking at least 80% of study medication. Temporary discontinuation (e.g. during surgery) permitted | Weighing of returned medication bottles | 42% non‐adherent by 5.2 years | 10.7% crossed to active treatment by 5.2 years | Analyses censoring events 6 months after non‐adherence increased effect sizes |
| Supply of study medication | Time at risk minus temporary interruptions and time after withdrawal from treatment | 73% of time | 86% of time | Women had a 3 month run‐in period on placebo. Only women who took 80% of tablets were randomised | |
| Supply of study medication | Patch counts: 75% use over 2 years counted as compliance | 84% | 84% of time | Women had a 1 week run‐in period. Only compliant women were randomised. |
Drop‐out rates were generally high, particularly in the active treatment groups, and they increased over time. In WHI 1998 (combined HT arm), 42% of the active treatment group and 38% of the placebo group were no longer taking their allocated treatment at 5 years, and a further 10.7% of the placebo group had crossed to active therapy. In WHI 1998 (oestrogen‐only HT arm), 53% of participants overall were no longer taking their allocated treatment at 6.8 years, and a further 5.7% had initiated hormone use outside the study. See the Characteristics of included studies table and Table 1 for details on drop‐outs and non‐adherence in other studies.
Losses to follow‐up were low in most studies, with no women lost to follow‐up in seven studies (EPAT 2001; ERA 2000; ESPRIT 2002; EVTET 2000; Mulnard 2000; Nachtigall 1979; WEST 2001), and 1% to 5.2% lost in five other studies, all of which were large and of long duration (3 to 6.8 years) (Greenspan 2005; HERS 1998; PEPI 1995; WAVE 2002; WHI 1998). Only five women (0.01%) were lost to follow‐up in WISDOM 2007. The Estonian study monitored outcomes by means of linkages to a national health insurance database and national cancer registry, and study authors stated that the probability of missing data in these databases was small (EPHT 2006). However, different publications for this study (EPHT 2006) reported slightly different numbers of randomised participants. In six smaller studies of 1 to 5 years' duration, a higher proportion of women (8.5% to 21%) were lost to follow‐up (ELITE 2014; KEEPS 2012; Notelovitz 2002; Obel 1993; Tierney 2009; Yaffe 2006), and in Ferenczy 2002, results were unavailable for 34% of participants for the outcome of interest for this review. It was unclear whether any women were lost to follow‐up in Barakat 2006 (see Description of studies).
Fourteen of the included studies supplied sufficient data to permit an intention‐to‐treat (ITT) analysis, at least for all reported outcomes of interest for this review (EPAT 2001; ERA 2000; ESPRIT 2002; EVTET 2000; Greenspan 2005; HERS 1998; KEEPS 2012; Mulnard 2000; Nachtigall 1979; Notelovitz 2002; WEST 2001; WHI 1998; WISDOM 2007; Yaffe 2006), or such data were extractable, and a further two studies analysed more than 97% of participants by intention to treat (PEPI 1995; WAVE 2002). Five studies did not include all participants in an ITT analysis for outcomes of interest (ELITE 2014; EVTET 2000; Ferenczy 2002; Obel 1993; Tierney 2009). It was unclear whether one study used ITT analysis because investigators provided no description of participants other than those that were "eligible and assessable" (Barakat 2006), and one study had slightly differing participation rates across trial publications (EPHT 2006).
WHI 1998 (combined HT arm) and WHI 1998 (WHISCA) continued follow‐up beyond the planned study completion date (March 2005) for women who consented to continue follow‐up. All women had already been instructed to stop taking their assigned study medication in July 2002. Seventeen per cent of surviving women in WHI 1998 (combined HT arm) declined to provide re‐consent, and their data were censored for the additional follow‐up period. Baseline characteristics were similar in the two groups, and imputation analyses suggested that this loss to follow‐up did not significantly influence study findings. Fifteen per cent of women in WHI 1998 (WHISCA) declined to continue follow‐up. The study extension phase ran from April 2005 to September 2010. WHI 1998 (oestrogen‐only HT arm) also conducted extended follow‐up (in 78% of surviving participants) from April 2005 to September 2010; among women who provided additional consent, baseline characteristics were similar to those of the original randomised group.
We rated 16 studies as having low risk of attrition bias, four as having unclear risk and three as having high risk.
Selective reporting
All studies reported all expected outcomes, and we rated them as having low risk of selective reporting.
Other potential sources of bias
Eleven of the included studies had other potential sources of bias (ELITE 2014; EPHT 2006; ERA 2000; Greenspan 2005; Mulnard 2000; Nachtigall 1979; Obel 1993; PEPI 1995; Tierney 2009; WAVE 2002; WHI 1998); we rated them as havng unclear risk of this bias. In most cases, potential bias was related to baseline imbalance between participants in individual prognostic characteristics and did not appear likely to have a marked effect on outcomes. We rated the other studies as having low risk of bias in this domain.
Effects of interventions
See: Summary of findings for the main comparison Combined continuous hormone therapy (HT) compared with placebo for postmenopausal women; Summary of findings 2 Oestrogen‐only hormone therapy (HT) compared with placebo for postmenopausal women
We present the results below. In most cases, details of effect measures are reported in the text only when results were statistically significant. For full results of all comparisons, see Data and analyses. See also summary of findings Table for the main comparison and summary of findings Table 2.
We grouped results as follows.
-
By outcome.
-
We grouped outcomes such as death, cardiovascular events, cognitive measures and quality of life according to the clinical status of participant groups, in the following order: relatively healthy women, women with a history of cardiovascular disease, women hospitalised with chronic illness and women with dementia.
-
For outcomes such as cancer, fracture and gallbladder disease, we grouped all participants together as 'all women'.
-
-
By intervention.
-
Oestrogen‐only HT.
-
Combined continuous HT regimens.
-
Combined sequential regimens.
-
Within these categories, we have grouped interventions according to the oestrogen dose used, with equivalence between doses based on the Australian Menopause Society guide to equivalent HT doses (AMS 2016), which classifies HT as low dose (e.g. oral oestradiol 1 mg), medium dose (e.g. oral oestradiol 2 mg, transdermal oestradiol 50 µg, conjugated equine oestrogen 0.065 mg) or higher dose (e.g. transdermal oestradiol 75 µg).
Meta‐analysis
Although comparisons with similar oestrogen doses are grouped together, we pooled comparisons (meta‐analysed) only if they used the same combination of oestrogen and progestogen for the same (or a similar) length of time. WHI 1998 and PEPI 1995 used the same HT regimen and reported several of the same clinical outcomes at 3 years, but in most cases, PEPI 1995 reported no events in either arm. We combined three studies (ERA 2000; HERS 1998; WAVE 2002) for some 3‐year (2.8 to 3.2) outcomes, but otherwise meta‐analysis was inappropriate for most outcomes because the studies used different types or doses of oestrogen or progestogen, or both, and these do not necessarily have the same metabolic effects; or they used different durations of HT, which might have led to different effects as the result of trends over time.
Very few results were suitable for pooling; therefore, statistical heterogeneity was not a major issue in this review. One meta‐analysis displayed statistically significant heterogeneity (I2 = 66.2%), but it involved only two small studies with few events, and we attributed the heterogeneity to chance (Analysis 2.21).
Time points for reporting results
In some cases, we rounded up or down time points for reporting results, as follows.
-
WHI 1998 (oestrogen‐only HT arm) reported results after a mean follow‐up of 7.1 or 7.9 years. Among women who consented (78% of those surviving), follow‐up was extended (for a median of 6.6 years) after the predefined study termination date to achieve a cumulative median follow‐up of 13.2 years. The median duration of active treatment in this arm of the study was 5.8 to 5.9 years (LaCroix 2011). We have reported results at mean or median follow‐up points as reported by the study publications.
-
WHI 1998 (combined HT arm) reported results after a mean of 5.6 years of active treatment (intervention phase) or at a mean of 7.9 years. The 7.9‐year follow‐up included 2.4 years of postintervention follow‐up and continued up to the predefined study termination date (31 March 2005). Among women who consented (83% of those surviving), follow‐up was extended after the predefined study termination date for a median of 6.6 years to achieve median cumulative follow‐up of 13 years. This arm of the study also reported selected clinical outcomes for each year of follow‐up: All women had been enrolled for at least 3.5 years at the time of the study publication, so we used these data to calculate outcomes on an ITT basis after 1, 2 and 3 years of use of HT, with all randomised participants inserted as the denominator (Chlebowski 2009). We have reported results at mean or median follow‐up points as reported by the study publications.
-
EPHT 2006 reported results for most outcomes at a mean follow‐up of 3.43 years, with a range of 2 to 5 years. Results for quality of life were reported at a mean of 3.6 years. We have reported results in our tables as if all women underwent 3 years of follow‐up.
-
WISDOM 2007 reported results after a median follow‐up of 11.9 months (range 7.1 to 19.6). We have reported results in our tables as if all women had undergone 1 year's follow‐up.
-
Barakat 2006 reported results after a median follow‐up of 35.7 months. We have reported results in our tables as if all women had undergone 3 years of follow‐up.
-
HERS 1998 reported results from the blinded portion of the study after a mean follow‐up of 4.1 years, which we mentioned above (see Methods). These results were presented as dichotomous data, and investigators reported selected clinical outcomes for each year of follow‐up. All women had been enrolled for at least 3 years at the time of the report, so for this review, we have used these data to calculate outcomes on an ITT basis after 1, 2 and 3 years of HT use, with all randomised participants inserted as the denominator.
Results for outcomes of interest
We derived all of the statistically significant findings of this review from the two biggest studies ‐ HERS 1998 and WHI 1998 ‐ both of which reported adequate methods of allocation concealment, analysed all participants by intention to treat and reported small losses to follow‐up (1% to 5.2%).
1. Death from any cause (total mortality)
Relevant comparisons
Seven studies (ELITE 2014; EPHT 2006; EPAT 2001; KEEPS 2012; PEPI 1995; WHI 1998; WISDOM 2007) with a total of eight different interventions, comprising comparisons of oestrogen‐only HT, combined continuous HT and combined sequential HT versus placebo for varying durations from 1 year to nearly 8 years, with extended follow‐up to 10.7 years in WHI 1998 (oestrogen‐only arm), reported this outcome in healthy women.
Five studies of women with cardiovascular disease (ERA 2000; ESPRIT 2002; HERS 1998; WAVE 2002; WEST 2001) with a total of four different interventions, comprising comparisons of oestrogen‐only HT and combined continuous HT versus placebo for varying durations from 2 to 4 years, with unblinded follow‐up to 6.8 years (HERS 1998), measured death from any cause.
Two other studies measured this outcome: one comparing oestrogen‐only HT versus placebo in women who had undergone surgery for stage I or II endometrial cancer (Barakat 2006), and one (Nachtigall 1979) comparing combined sequential HT versus placebo for 10 years in women hospitalised for chronic disease or because they required custodial care.
Results
Results of analysis show no statistically significant difference between HT and placebo for this outcome in any population group (Analysis 1.1; Analysis 1.2; Analysis 2.1; Analysis 2.2; Analysis 2.3; Analysis 4.1; Analysis 5.1).
2. Cause‐specific mortality
2.1 Death from coronary heart disease
Relevant comparisons
Four studies (EPAT 2001; Tierney 2009; WHI 1998; WISDOM 2007) with a total of five different interventions, comprising comparisons of oestrogen‐only HT, combined continuous HT and combined sequential HT versus placebo, for varying durations from 1 year to nearly 8 years, with extended follow‐up to 10.7 years in WHI 1998 (oestrogen‐only arm), reported this outcome in relatively healthy women.
Five studies of women with cardiovascular disease (ERA 2000; ESPRIT 2002; HERS 1998; WAVE 2002; WEST 2001) with a total of four different interventions, comprising comparisons of oestrogen‐only HT, combined continuous HT and combined sequential HT versus placebo, for varying durations from 2 to 4 years, with unblinded follow‐up to 6.8 years (HERS 1998), measured death from coronary heart disease.
In addition, the study comparing oestrogen‐only HT versus placebo in women who had undergone surgery for stage I or II endometrial cancer measured this outcome (Barakat 2006).
Results
Results of analysis show no statistically significant differences between HT and placebo for this outcome in any population group (Analysis 1.4; Analysis 1.5; Analysis 1.6; Analysis 2.4; Analysis 2.5; Analysis 2.6; Analysis 4.3).
2.2 Death from stroke
Relevant comparisons
Four comparisons of relatively healthy women taking combined continuous HT for 1 year (WISDOM 2007) and for 5.6 years (WHI 1998 (combined HT arm)), or taking oestrogen‐only HT for 7.1 years (WHI 1998 (oestrogen‐only HT arm)) or taking combined sequential HT for 2 years (Tierney 2009), reported this outcome. One study of women with a history of stroke who were taking oestrogen‐only HT (with annual progesterone for women who had a uterus) for 2.8 years (WEST 2001) also reported this outcome.
Results
Results of analysis show no statistically significant differences between HT and placebo for this outcome (Analysis 1.7; Analysis 1.9; Analysis 1.8; Analysis 2.8).
2.3 Death from breast cancer
Relevant comparisons
One study of comparatively healthy women taking oestrogen‐only HT for a median of 7.2 years (WHI 1998 (oestrogen‐only HT arm)) with postintervention follow‐up for a median of 4.7 years reported this outcome, as did two studies of relatively healthy women taking combined continuous HT for 1 year (WISDOM 2007) and for 5.6 years (WHI 1998). Follow‐up for breast cancer outcomes was continued for a mean total of 11 years among women in WHI 1998 (combined HT arm) who agreed to continue follow‐up after the planned study completion date (Chlebowski 2010).
Results
Results of analysis show no statistically significant differences between HT and placebo for this outcome at 1 or 5.6 years.
Among women taking oestrogen‐only HT, after a median of 11.8 years (7.2 years' intervention plus postintervention follow‐up), the death rate from breast cancer was lower in the HT arm (risk ratio (RR) 0.38, 95% confidence interval (CI) 0.15 to 0.98) (WHI 1998 (oestrogen‐only HT; Analysis 1.12).
At 11 years' follow‐up, WHI 1998 (combined HT arm) reported more deaths from breast cancer in the HT group than in the placebo group; this finding was of borderline statistical significance (RR 1.98, 95% CI 1.00 to 3.95; Analysis 1.11). Absolute risk of breast cancer increased from 1 per 1000 in the control group to 3 per 1000 (95% CI 1 to 6) in the HT group.
At 11 years' follow‐up, researchers also found that significantly more deaths resulted from all causes after a breast cancer diagnosis in the combined HT group than in the placebo group (published hazard ratio (HR) 1.57, 95% CI 1.01 to 2.48; P = 0.045) (Chlebowski 2010).
2.4 Death from colorectal cancer
Relevant comparisons
Investigators reported this outcome in relatively healthy women in the oestrogen‐alone group of WHI 1998 after mean follow‐up of 7.1 years, as well as in the WHI 1998 (combined HT arm) at mean follow‐up of 5.6 and 7.1 years. Researchers also reported on this after 11.6 years' follow‐up, including a mean of 5.6 years' intervention plus postintervention follow‐up after the study ended, in 83% of participants (Simon 2012).
Results
Results of analysis show no statistically significant differences between HT and placebo for this outcome (Analysis 1.10; Analysis 1.13).
2.5 Death from endometrial cancer
Relevant comparisons
The study comparing oestrogen‐only HT versus placebo in women who had undergone surgery for stage I or II endometrial cancer reported this outcome (Barakat 2006).
Results
Results of analysis show no statistically significant differences between HT and placebo for this outcome (Analysis 4.2).
2.6 Death from lung cancer
Relevant comparisons
WHI 1998 reported this outcome in relatively healthy women in the oestrogen‐only HT group in a post hoc analysis after mean follow‐up of 7.9 years (including 8 months' follow‐up post intervention) (Chlebowski 2010b), and in the combined HT arm of WHI 1998 in a post hoc analysis after mean follow‐up of 8 years (including 2.4 years' follow‐up post intervention) (Chlebowski 2009). Study authors reported lung cancer overall, non‐small cell lung cancer and small cell lung cancer separately. One much smaller study (Tierney 2009) reported this outcome in women taking combined sequential HT or placebo.
Results
Results of analysis show no statistically significant differences between HT and placebo for any of these outcomes among women in the oestrogen‐only HT arm of WHI 1998 (Analysis 1.14). However, in the combined HT arm of WHI 1998, women in the intervention group were significantly more likely to die of lung cancer overall (RR 1.74, 95% CI 1.18 to 2.55), or of non‐small cell lung cancer (RR 1.91, 95% CI 1.24 to 2.93), than women in the placebo arm (Analysis 1.15). Absolute risk of lung cancer increased from 5 per 1000 in the control group to 9 per 1000 (95% CI 6 to 13) in the HT group. This finding was independent of smoking status. The mortality rate for small cell lung cancer did not differ significantly between groups. Review authors noted no statistically significant findings in the combined sequential HT study (Analysis 1.16).
2.7 Death from any cancer
Relevant comparisons
Two studies of relatively healthy women taking continuous HT for 1 year (WISDOM 2007) and for 5.6 years (WHI 1998 (combined HT arm)) and one study of women with cardiovascular disease taking combined continuous HT for 4.1 years, with unblinded follow‐up to 6.8 years (HERS 1998) reported this outcome.
Results
Results of analysis showed no statistically significant differences between HT and placebo for this outcome (Analysis 1.17; Analysis 2.9).
3. Coronary events (myocardial infarction or cardiac death)
Relevant comparisons
Eight studies (ELITE 2014; EPAT 2001; EPHT 2006; KEEPS 2012; PEPI 1995; Tierney 2009; WHI 1998, WISDOM 2007) with a total of nine different interventions, comprising comparisons of oestrogen‐only HT, combined continuous HT and combined sequential HT versus placebo for varying durations from 1 year to over 7 years, with extended follow‐up to 10.7 years in WHI 1998 (oestrogen‐only arm) (LaCroix 2011) and to 13.2 years in the combined HT arm (Manson 2013), reported this outcome in relatively healthy women.
Six studies (ERA 2000; ESPRIT 2002; EVTET 2000; HERS 1998; WAVE 2002; WEST 2001) with a total of five different interventions, comprising comparisons of oestrogen‐only HT, combined continuous HT and combined sequential HT versus placebo for varying durations from 2 to 4 years, with unblinded follow‐up to 6.8 years (HERS 1998), measured coronary events as an outcome in women with cardiovascular disease.
One other small study (Nachtigall 1979) measured this outcome and compared combined sequential HT versus placebo for 10 years in women hospitalised for chronic disease or because they required custodial care.
Results
WHI 1998 (oestrogen‐only HT arm) reported no statistically significant difference between the two groups for this outcome (Analysis 1.18). However, WHI 1998 (combined HT arm) reported that relatively healthy women taking combined continuous HT (CEE 0.625 mg + MPA 2.5 mg) were at significantly higher risk of a coronary event after taking HT for 1, 2 and 3 years (at 1 year: RR 1.74 (95% CI 1.05 to 2.89); at 2 years: RR 1.49 (95% CI 1.05 to 2.12); at 3 years: RR 1.43 (95% CI 1.05 to 1.95)). At mean follow‐up of 5.6 years, researchers noted no statistically significant differences between groups (RR 1.17, 95% CI 0.95 to 1.44), and they observed no differences between groups after extended follow‐up to 13.2 years. WISDOM 2007 and EPHT 2006 reported data for this outcome at 1 year and at 3 years, respectively. Pooling these data with data from WHI 1998 (combined HT arm) resulted in a risk ratio at 1 year of 1.89 (95% CI 1.15 to 3.10) and at 3 years of 1.45 (95% CI 1.07 to 1.98; Analysis 1.19). Absolute risk of a coronary event increased after 1 year from 2 per 1000 in the control group to 4 per 1000 (95% CI 3 to 7) in the HT group; after 2 years from 6 per 1000 in the control group to 9 per 1000 (95% CI 7 to 13) in the HT group; and after 4 years from 8 per 1000 in the control group to 11 per 1000 (95% CI 8 to 13) in the HT group.
No other studies found statistically significant differences between HT and placebo for this outcome (Analysis 1.20; Analysis 2.10; Analysis 2.7; Analysis 2.11; Analysis 2.12; Analysis 5.2). HERS 1998 reported results of borderline statistical significance at 1 year, suggesting increased risk for women with cardiovascular disease taking combined continuous therapy (RR 1.5, 95% CI 1.00 to 2.25; Analysis 2.12), and initial analysis of time trends in HERS 1998 suggested a trend towards increased risk in the HT group that diminished over time. However, subsequent analysis based on the entire 6.8 years of follow‐up (blinded and unblinded) showed no statistically significant variation in risk over time.
4. Stroke and transient ischaemic attack
4.1 Stroke
Relevant comparisons
Six studies (EPAT 2001; EPHT 2006; KEEPS 2012; PEPI 1995; Tierney 2009; WHI 1998) with a total of seven different interventions, comprising comparisons of oestrogen‐only HT, combined continuous HT and combined sequential HT versus placebo, for varying durations from 1 year to nearly 8 years, reported this outcome in relatively healthy women; WHI 1998 (oestrogen‐only arm) extended follow‐up to 10.7 years, and Manson 2013 extended follow‐up to 13.2 years in the combined HT arm.
Five studies (ESPRIT 2002; EVTET 2000; HERS 1998; WAVE 2002; WEST 2001) with a total of five different interventions, comprising comparisons of oestrogen‐only HT, combined continuous HT and combined sequential HT versus placebo, for varying durations from 1 year to 4 years, with unblinded follow‐up to 6.8 years (HERS 1998), measured this outcome in women with cardiovascular disease.
Results
WHI 1998 (oestrogen‐only HT arm) reported a statistically significant increase in the incidence of stroke at 7.1 years' follow‐up (RR 1.33, 95% CI 1.06 to 1.67; Analysis 1.22). Absolute risk of a stroke increased from 23 per 1000 in the control group to 32 per 1000 (95% CI 25 to 40) in the HT group. Study authors noted that the excess in the intervention arm was due to increased risk of ischaemic rather than haemorrhagic stroke, and that the excess risk became apparent after 4 years' follow‐up (Hendrix 2006). However, increased risk was not maintained during extended follow‐up (overall 10.7 years; RR 1.17, 95% CI 0.97 to 1.40) (LaCroix 2011). Although WHI 1998 (combined HT arm) reported no statistically significant differences between groups in the incidence of stroke during the first 2 years of the study, women taking combined continuous HT were at significantly higher risk of stroke after taking HT for 3 or more years (at 3 years: RR 1.47, 95% CI 1.02 to 2.11; at a mean of 5.6 years: RR 1.39, 95% CI 1.09 to 1.77; at a mean of 7.9 years: RR 1.29, 95% CI 1.06 to 1.56). A statistically significant difference between groups was no longer evident at 13.2 years (RR 1.15, 99% CI 0.99 to 1.33). EPHT 2006 also reported data for this outcome at 3 years; pooling these data with data from WHI 1998 (combined HT arm) resulted in a risk ratio at 3 years of 1.46 (95% CI 1.02 to 2.09; Analysis 1.23). Absolute risk of a stroke increased at 3 years from 6 per 1000 in the control group to 8 per 1000 (95% CI 6 to 12) in the HT group; at 5.6 years from 14 per 1000 in the control group to 19 per 1000 (95% CI 15 to 24) in the HT group; and at 7.9 years from 21 per 1000 in the control group to 28 per 1000 (95% CI 23 to 34) in the HT group.
None of the other studies found any statistically significant differences between HT and placebo for this outcome (Analysis 1.22; Analysis 1.24; Analysis 1.25; Analysis 2.14; Analysis 2.13; Analysis 2.15). As noted above, most of the relevant studies were small.
4.2 Transient ischaemic attack (TIA)
Relevant comparisons
Four studies (ELITE 2014; EPAT 2001; PEPI 1995; Tierney 2009) with a total of five different interventions, comprising comparisons of oestrogen‐only HT, combined continuous HT and combined sequential HT versus placebo, for 2 or 3 years, reported this outcome in relatively healthy women.
Three studies (ESPRIT 2002; HERS 1998; WEST 2001) of women with cardiovascular disease with a total of three different interventions, comprising comparisons of oestrogen‐only HT, combined continuous HT and combined sequential HT versus placebo, for varying durations from 2 to 4 years, with unblinded follow‐up to 6.8 years (HERS 1998), also measured this outcome.
Results
Results of analysis show no statistically significant differences between HT and placebo for this outcome (Analysis 1.26; Analysis 1.27; Analysis 2.16; Analysis 2.17; Analysis 2.18).
4.3 Stroke or transient ischaemic attack
Relevant comparisons
One study of relatively healthy women (WISDOM 2007) taking combined continuous HT or placebo for a median of 1 year reported stroke or TIA as a combined outcome. Another study (ERA 2000) of women with known coronary disease taking oestrogen‐only HT, combined continuous therapy or placebo also reported this combined outcome at 3.2 years' mean follow‐up.
Results
Neither study found a statistically significant difference for this outcome between women taking HT and women taking placebo (Analysis 1.29; Analysis 2.20; Analysis 2.19).
5. Venous thromboembolism (pulmonary embolus or deep vein thrombosis)
Relevant comparisons
Six studies (ELITE 2014; EPAT 2001; PEPI 1995; Tierney 2009; WHI 1998; WISDOM 2007) with a total of five different interventions, comprising comparisons of oestrogen‐only HT, combined continuous HT and combined sequential HT versus placebo, for varying durations from 1 year to nearly 8 years, with extended follow‐up to 10.7 years in WHI 1998 (oestrogen‐only arm), reported this outcome in relatively healthy women.
Five studies of women with cardiovascular disease (ERA 2000; ESPRIT 2002; EVTET 2000; HERS 1998; WAVE 2002) with a total of five different interventions, comprising comparisons of oestrogen‐only HT, combined continuous HT and combined sequential HT versus placebo, for varying durations from 1 to 4 years, with unblinded follow‐up to 6.8 years (HERS 1998), also measured venous thromboembolism.
One other small study (Nachtigall 1979) measured this outcome and compared combined sequential HT versus placebo for 10 years in women hospitalised for chronic disease or because they needed custodial care.
Results
WHI 1998 (oestrogen‐only HT arm) reported that relatively healthy women taking oestrogen‐only HT (CEE 0.625 mg) were at higher risk of a thromboembolic event than women taking placebo. Risk was highest within the first 2 years and was statistically significant during this time period (RR 2.22, 95% CI 1.12 to 4.39). Absolute risk of an event increased from 2 per 1000 in the control group to 5 per 1000 (95% CI 2 to 10) in the HT group. At a mean follow‐up of 7 years, risk was lower, but the intervention group was still at higher risk bordering on statistical significance (RR 1.32, 95% CI 1.00 to 1.74). The increased risk disappeared during extended follow‐up (overall 10.7 years' follow‐up: RR 1.05, 95% CI 0.84 to 1.31). When deep vein thrombosis was considered as a single outcome (without pulmonary embolism), the rate was significantly lower in the HT group during extended follow‐up (RR 0.63, 95% CI 0.41 to 0.98), although the rate over the entire 10.7 years' intervention and extended follow‐up did not differ significantly between the two groups (RR 1.04, 95% CI 0.84 to 1.29; Analysis 1.30).
WHI 1998 (combined HT arm) reported that relatively healthy women taking combined continuous HT (CEE 0.625 mg + MPA 2.5 mg) were at significantly higher risk of a thromboembolic event than women taking placebo; this applied at 1 to nearly 8 years' follow up (at 1 year: RR 3.59, 95% CI 1.95 to 6.61; at 2 years: RR 2.98, 95% CI 1.88 to 4.71; at 3 years: RR 2.54, 95% CI 1.73 to 3.72; at a mean of 5.6 years: RR 2.03, 95% CI 1.55 to 2.64; at a mean of 7.9 years: RR 1.65, 95% CI 1.32 to 2.05). Analysis of this comparison revealed a statistically significant time trend for diminishing risk of venous thromboembolism over time. WISDOM 2007 also reported data for this outcome at 1 year; pooling these data with data from WHI 1998 (oestrogen‐only HT arm) resulted in a risk ratio at 1 year of 4.28 (95% CI 2.49 to 7.34) (Analysis 1.32). Absolute risk of an event increased at 1 year from 2 per 1000 in the control group to 7 per 1000 (95% CI 4 to 11) in the HT group; at 2 years from 3 per 1000 in the control group to 9 per 1000 (95% CI 6 to 14) in the HT group; and at 5.6 years from 10 per 1000 in the control group to 20 per 1000 (95% CI 15 to 26) in the HT group.
Similarly, in HERS 1998, women with cardiovascular disease who were taking combined continuous HT (CEE 0.625 mg + MPA 2.5 mg) for 1 to 4 years were significantly more likely to experience a venous thromboembolism than women on placebo (at 1 year: RR 3.26, 95% CI 1.06 to 9.96; at 2 years: RR 3.51, 95% CI 1.42 to 8.66; at 3 years: RR 3.01, 95% CI 1.50 to 6.04; at a mean of 4.1 years: RR 2.62, 95% CI 1.39 to 4.94; Analysis 2.22). Absolute risk of an event increased at 1 year from 3 per 1000 in the control group to 9 per 1000 (95% CI 3 to 29) in the HT group; at 2 years from 4 per 1000 in the control group to 15 per 1000 (95% CI 6 to 38) in the HT group; and at 4.1 years from 9 per 1000 in the control group to 13 per 1000 (95% CI 6 to 28) in the HT group.
None of the other studies found any statistically significant differences between HT and placebo for this outcome (Analysis 1.31; Analysis 2.21; Analysis 5.3).
6. Breast cancer
Relevant comparisons
Nine studies (ELITE 2014; EPAT 2001; EPHT 2006; Greenspan 2005; KEEPS 2012; Notelovitz 2002; PEPI 1995; WHI 1998; WISDOM 2007) with a total of 11 different interventions, comprising comparisons of oestrogen‐only HT, combined continuous HT and combined sequential HT versus placebo, for varying durations from 1 year to nearly 8 years, reported this outcome in relatively healthy women. WHI 1998 (combined HT arm) extended follow‐up beyond the planned completion date to achieve a mean 11‐year follow‐up for this outcome in the 85% of women who consented to stay in the study; WHI 1998 (oestrogen‐only arm) extended follow‐up to a total of 10.7 years in the 78% of women who agreed to continue.
Four studies (ERA 2000; ESPRIT 2002; HERS 1998; WAVE 2002) with a total of four different interventions, comprising comparisons of oestrogen‐only HT, combined continuous HT and combined sequential HT versus placebo, for varying durations from 2 to 4 years, with unblinded follow‐up to 7.1 years (HERS 1998), measured this outcome in women with cardiovascular disease .
One other small study (Nachtigall 1979) measured this outcome and compared combined sequential HT versus placebo for 10 years in women hospitalised for chronic disease or because they required custodial care.
Results
WHI 1998 (oestrogen‐only HT arm) reported a non‐statistically significant decrease in risk of breast cancer at 7.1 years' follow‐up among relatively healthy women taking oestrogen‐only HT (CEE 0.625 mg) compared with women taking placebo (RR 0.79, 95% CI 0.61 to 1.01). Follow‐up continued for a median of 5.8 years after the intervention phase. The overall cumulative breast cancer incidence over the 10.7 years' mean follow‐up (median 11.8 years) showed a significantly lower rate in the HT group (RR 0.78, 95% CI 0.63 to 0.96). Absolute risk of breast cancer decreased over 10.7 years' follow‐up from 37 per 1000 in the control group to 29 per 1000 (95% CI 23 to 35) in the HT group. The overall cumulative rate remained lower after a median of 13 years' follow‐up (RR 0.80, 95% CI 0.65 to 0.97). Study authors noted that when event rates in the early and late postintervention periods were compared, hazard ratios (HRs) for breast cancer differed significantly (P = 0.04). The significant difference between groups in HR for breast cancer diminished over time and disappeared at approximately 4.5 years post intervention (Chlebowski 2015a)
WHI 1998 (combined HT arm) reported this outcome at yearly intervals. Results showed no statistically significant differences between groups in the incidence of breast cancer during the first 4 years of follow‐up, but the HT group was at significantly higher risk of breast cancer after taking HT for 5 or more years (at a mean of 5.6 years' follow‐up: RR 1.27, 95% CI 1.03 to 1.56; at a mean of 7.9 years' follow‐up: RR 1.27, 95% CI 1.07 to 1.52). Absolute risk of breast cancer increased at 5.6 years' follow‐up from 19 per 1000 in the control group to 23 per 1000 (95% CI 19 to 29) in the HT group; and at 7.9 years' follow‐up from 26 per 1000 in the control group to 33 per 1000 (95% CI 28 to 40) in the HT group. Analysis in this arm of WHI 1998 revealed a statistically significant trend for increasing breast cancer risk over time in the group taking HT. WISDOM 2007 also reported data for this outcome at a median follow‐up of 1 year. Pooling these data with data from WHI 1998 (combined HT arm) resulted in significantly reduced risk of breast cancer at 1 year in the HT arm (RR 0.53, 95% CI 0.28 to 0.96). However, at a mean of 11 years' follow‐up in WHI 1998 (combined HT arm), the rate of invasive breast cancer was significantly higher in the HT arm (RR 1.25, 95% CI 1.08 to 1.45). Rates remained higher in the intervention arm at a median of 13.2 years' follow‐up (RR 1.28, 95% CI 1.11 to 1.47) (Analysis 6.3). Breast cancers diagnosed in the HT group were of similar histology and stage to those diagnosed among controls but were more likely to be node positive (P = 0.03).
Results of analysis show no statistically significant differences between any other type of HT and placebo for this outcome, although (as noted above) relevant studies were small (Analysis 6.1; Analysis 6.2; Analysis 6.3; Analysis 6.4).
7. Colorectal cancer
Relevant comparisons
Seven studies (ELITE 2014; EPAT 2001; HERS 1998; Greenspan 2005; PEPI 1995; Tierney 2009; WHI 1998, WISDOM 2007) with a total of seven different interventions, comprising comparisons of oestrogen‐only HT, combined continuous HT and combined sequential HT versus placebo, for varying durations from 1 year to nearly 8 years, with extended follow‐up to 10.7 years in WHI 1998 (oestrogen‐only arm), reported this outcome. Investigators also reported this outcome after extended follow‐up in WHI 1998 (combined HT arm) at 11.6 years (Simon 2012) and at 13.2 years (Manson 2013).
One other small study (Nachtigall 1979) measured this outcome and compared combined sequential HT versus placebo for 10 years in women hospitalised for chronic disease or because they required custodial care.
Results
WHI 1998 (combined HT arm) reported no statistically significant differences in the incidence of colorectal cancer among relatively healthy women taking combined continuous HT (CEE 0.625 mg + MPA 2.5 mg) compared with women taking placebo, at 1 to 4 years' follow‐up. However, women taking combined continuous HT had a significantly lower incidence of colon cancer at a mean follow up of 5.6 years (RR 0.64, 95% CI 0.44 to 0.91). Absolute risk of colorectal cancer decreased from 9 per 1000 in the control group to 6 per 1000 (95% CI 4 to 8) in the HT group. Rates tended to favour the HT group over extended follow‐up: The difference was not statistically significant at 7.9 years (RR 0.76, 95% CI 0.57 to 1.01) nor at 13.2 years (RR 0.80, 95% CI 0.63 to 1.01) but did reach statistical significance at 11.6 years (RR 0.78, 95% CI 0.61 to 0.99).
Results of analysis show no statistically significant differences between any other type of HT and placebo for this outcome (Analysis 6.6; Analysis 6.7; Analysis 6.8; Analysis 6.9).
8. Lung cancer
Relevant comparisons
WHI 1998 (oestrogen‐only arm) reported this outcome in relatively healthy women after a mean follow‐up of 7.1 years; WHI 1998 (combined HT arm) reported this outcome at 5.6 years and after extended follow‐up at 7.9 years and 14 years.
Results
Results of analysis show no statistically significant differences between HT and placebo groups for this outcome (Analysis 6.12; Analysis 6.11; Analysis 6.13).
9. Endometrial cancer
Relevant comparisons
Nine studies (EPAT 2001; ESPRIT 2002; Ferenczy 2002; HERS 1998; KEEPS 2012; Nachtigall 1979; Obel 1993; PEPI 1995; WHI 1998 (combined HT arm)) with a total of 13 different interventions, comprising comparisons of oestrogen‐only HT, combined continuous HT and combined sequential HT versus placebo, for varying durations from 1 year to nearly 10 years, reported this outcome. WHI 1998 (combined HT arm) also reported this outcome after extended follow‐up, at 13.2 years. The study of oestrogen‐only HT versus placebo in women who had undergone surgery for stage I or II endometrial cancer (Barakat 2006) measured recurrent endometrial cancer. In comparisons of oestrogen‐only HT versus placebo (EPAT 2001; ESPRIT 2002; PEPI 1995), all women with a uterus were monitored closely for endometrial hyperplasia, and two studies specified that study medications were withdrawn if atypical hyperplasia was detected (ESPRIT 2002; PEPI 1995).
Results
At 13 years' median follow‐up, rates of endometrial cancer were lower in the combined HT group (RR 0.66, 95% CI 0.48 to 0.90) in WHI 1998.
Results of analysis showed no other statistically significant differences between HT and placebo for this outcome (Analysis 6.14; Analysis 6.15; Analysis 6.14; Analysis 6.16), and no statistically significant differences between groups in rates of recurrent endometrial cancer (Analysis 6.17). One study (Obel 1993) reported no events.
10. Ovarian cancer
Relevant comparisons
WHI 1998 (combined HT arm), which used combined continuous CEE 0.625 mg + MPA 2.5 mg at 5.6 years' mean follow‐up and again after extended follow‐up, at 13.2 years (Manson 2013), reported ovarian cancer incidence, and ELITE 2014, which utilised oestrogen with or without sequential progesterone vaginal gel, reported a single event.
Results
Results of analysis showed no statistically significant differences between groups for this outcome (Analysis 6.18).
11. Gallbladder disease
Relevant comparisons
Four studies (ERA 2000; HERS 1998; PEPI 1995; WHI 1998), which compared oestrogen‐only HT, combined continuous HT and sequential combined HT versus placebo for 3 to over 7 years, reported gallbladder disease requiring surgery. For this outcome, the two largest studies stated that they excluded from analysis women who had had their gallbladder removed (HERS 1998), who reported a history of gallbladder disease, or both (WHI 1998).
Results
Meta‐analysis of the three studies comparing oestrogen‐only HT versus placebo for the outcome of gallbladder disease requiring surgery (ERA 2000; PEPI 1995; WHI 1998) showed a statistically significant increase in risk in the HT group (RR 1.75, 95% CI 1.40 to 2.19); these studies had a mean follow‐up ranging from 3 to 7.1 years. Absolute risk of an event increased from 26 per 1000 in the control group to 45 per 1000 (95% CI 36 to 57) in the HT group. Meta‐analysis of the four studies comparing combined continuous HT versus placebo (ERA 2000; HERS 1998; PEPI 1995; WHI 1998) showed significantly increased risk in the HT group (RR 1.55, 95% CI 1.29 to 1.86); these studies had a mean follow‐up ranging from 3 to 5.6 years. Absolute risk of an event increased from 27 per 1000 in the control group to 47 per 1000 (95% CI 38 to 60) in the HT group. Although these studies had differing lengths of follow‐up, review authors noted no statistical heterogeneity in either meta‐analysis. Similarly, during unblinded follow‐up, HERS 1998 reported an increase in events in the HT group that reached borderline statistical significance (RR 1.63, 95% CI 1.00 to 2.70; Analysis 6.20; Analysis 6.21; Analysis 6.22). WHI 1998 investigators reported that hazard estimates for risk in active and placebo groups started to diverge during the first year of follow‐up, with the oestrogen group separating earlier than the combined continuous HT group.
12. Fractures
12.1 Hip fracture
Relevant comparisons
Five studies, which compared combined continuous HT (HERS 1998; WHI 1998; WISDOM 2007), combined sequential HT (Tierney 2009; WEST 2001) and oestrogen‐only HT (WEST 2001; WHI 1998) versus placebo for between 1 and 7.9 years, with extended follow‐up to 10.7 years in WHI 1998 (oestrogen‐only arm), and with extended follow‐up to 13.2 years in both arms of WHI 1998, reported the incidence of hip fracture.
Results
Both arms of WHI 1998 found a statistically significant reduction in the risk of hip fracture for women taking HT. WHI 1998 (oestrogen‐only HT arm) reported a statistically significant reduction in the risk of hip fracture for women taking HT (CEE 0.625 mg) at 7.1 years' mean follow‐up (RR 0.64, 95% CI 0.45 to 0.93; Analysis 6.23). Absolute risk of a hip fracture decreased from 14 per 1000 in the control group to 9 per 1000 (95% CI 6 to 13) in the HT group. Benefit derived from HT was not maintained during extended follow‐up (to 13.2 years). WHI 1998 (combined HT arm) reported this outcome at yearly intervals and found no statistically significant differences in the incidence of hip fracture during the first 4 years' follow‐up, but at 5.6 years' mean follow‐up, reduction in the risk of hip fracture among women taking combined continuous HT (CEE 0.625 mg + MPA 2.5 mg) was statistically significant (RR 0.68, 95% CI 0.48 to 0.97; Analysis 6.25). Absolute risk of hip fracture decreased from 9 per 1000 in the control group to 6 per 1000 (95% CI 4 to 9) in the HT group. This risk remained significantly lower in the HT group at mean follow‐up of 7.9 years (RR 0.77, 95% CI 0.60 to 0.99) and 13.2 years (RR 0.82, 95% CI 0.69 to 0.97).
However, HERS 1998 found no statistically significant differences between combined continuous HT (CEE 0.625 mg + MPA 2.5 mg) and placebo for this outcome, and the unblinded extension of this study reported a statistically significantly increased risk in the group taking HT from years 4.1 to 6.8 (post randomisation) (RR 2.10, 95% CI 1.06 to 4.16; Analysis 6.25).
Other studies found no statistically significant differences between groups (Analysis 6.24; Analysis 6.26).
12.2 Clinical vertebral fractures
Relevant comparisons
WHI 1998 (oestrogen‐only HT arm) reported the incidence of vertebral fracture at follow‐up of 7.1 years. Two studies of combined continuous HT (CEE 0.625 mg + MPA 2.5 mg) versus placebo (HERS 1998; WHI 1998 (combined HT arm)) also reported the incidence of vertebral fracture at follow‐up from 4 to nearly 8 years.
Results
At a mean of 7.1 years' follow‐up, WHI 1998 (oestrogen‐only HT arm) reported significantly fewer fractures in the oestrogen‐only HT group (CEE 0.625 mg) than in the placebo group (RR 0.64, 95% CI 0.44 to 0.94; Analysis 6.27). Absolute risk of a clinical vertebral fracture decreased from 13 per 1000 in the control group to 8 per 1000 (95% CI 6 to 12) in the HT group. Similarly, at a mean of 5.6 years' follow‐up, WHI 1998 (combined HT arm) reported significantly fewer fractures in the HT group than in the placebo group (RR 0.68, 95% CI 0.48 to 0.97; Analysis 6.28). Absolute risk of a clinical vertebral fracture decreased from 10 per 1000 in the control group to 7 per 1000 (95% CI 5 to 10) in the HT group. At a mean of 7.9 years' follow‐up, WHI 1998 (combined HT arm) no longer observed significant differences between groups. HERS 1998 found no significant differences between groups during follow‐up.
12.3 Any fractures
Relevant comparisons
Nine studies (EPHT 2006; ERA 2000; ESPRIT 2002; Greenspan 2005; HERS 1998; Tierney 2009; WEST 2001; WHI 1998; WISDOM 2007) comprising comparisons of oestrogen‐only HT, combined continuous HT and combined sequential HT versus placebo for 1 to nearly 8 years reported the incidence of any fracture.
Results
Both arms of WHI 1998 showed a statistically significant reduction in the risk of any fracture for women taking HT. Investigators reported this at 5.6 and 7.9 years' mean follow‐up in women taking combined continuous HT (CEE 0.625 mg + MPA 2.5 mg) (at 5.6 years: RR 0.78, 95% CI 0.71 to 0.86; at 7.9 years: RR 0.82, 95% CI 0.76 to 0.89) and at 7.1 years' mean follow‐up in women taking oestrogen‐only HT (CEE 0.625 mg) (RR 0.73, 95% CI 0.65 to 0.80) (Analysis 6.30; Analysis 6.32). At 5.6 years, in WHI 1998 (combined HT arm), absolute risk of any fracture decreased from 111 per 1000 in the control group to 86 per 1000 (95% CI 79 to 94) in the HT group, and in WHI 1998 (oestrogen‐only HT arm) at 7.1 years, absolute risk of any fracture decreased from 140 per 1000 in the control group to 102 per 1000 (95% CI 91 to 112) in the HT group. None of the other studies found any statistically significant differences between HT and placebo for this outcome (Analysis 6.29; Analysis 6.31; Analysis 6.33).
13. Cognitive function
13.1 Global cognitive function
Relevant comparisons
Five studies, which compared low‐dose oestrogen patches versus placebo for 2 years (Yaffe 2006) and combined continuous CEE 0.625 mg with or without MPA 2.5 mg versus placebo for 3 years (Greenspan 2005), oestradiol 1 mg daily with or without intermittent vaginal progesterone gel with follow‐up at 2.5 and 5 years (ELITE 2014), 0.45 mg oral or 0.05 mg transdermal oestrogen with intermittent progesterone 200 mg versus placebo for 4 years (KEEPS 2012), oestrogen‐only HT versus placebo for a mean of 5.6 years (WHI 1998 (WHIMS)) and continuous CEE 0.625 mg + MPA 2.5 mg versus placebo for a mean of 4.2 years (WHI 1998 (WHIMS)), reported this outcome. Researchers measured global cognitive function using a cognitive screening test known as the Modified Mini‐Mental State Examination (3MSE), on which a higher score reflects better cognitive functioning. KEEPS 2012 included women 42 to 58 years of age at randomisation, WHI 1998 (WHIMS) included only women over 65 years of age and Yaffe 2006 included only women over 60 years of age.
Results
Over 2 years' follow‐up in Yaffe 2006, 3 years' in Greenspan 2005, 4 years' in and 2.5 years' or 5 years' in ELITE 2014, investigators noted no significant difference in cognitive function between intervention and placebo groups. Nor did they observe any difference in the effect of treatment when women in Yaffe 2006 were stratified according to cognitive status at baseline (3MSE ≤ 90 or > 90) (Analysis 1.34; Table 2). Inbestigators in ELITE 2014 subgrouped comparisons according to when oestradiol was initiated (within 6 years of menopause vs 10 or more years after menopause). Study results showed no evidence of differences between the two subgroups in the effect of HT on cognition at 2.5 years.
| Study | Comparison | Instrument | Measure | Outcome | Intervention | Effect |
| Oestrogen (CEE or oestradiol) + cyclic oral micronised progesterone 200 mg/d × 12 days per month vs placebo (n = 275) for 48 months | Modified Mini Mental State Examination (MMSE) | Differences between intervention and placebo groups in mean rate of change over time | Global cognition | 0.45 mg/d oral CEE (n = 230) | P = 0.178 | |
| 0.05 mg/d transdermal oestradiol (n = 222) | P = 0.840 |
In both treatment groups and in both placebo groups of WHI 1998 (WHIMS), mean 3MSE scores increased from baseline and continued to increase for 3 to 5 years before they started to decline. Results showed a pattern of higher increases from baseline in 3MSE scores in the placebo groups, which emerged after 1 to 2 years and were maintained throughout the study. The mean difference between groups in 3MSE score changes was of borderline statistical significance in both arms of the study, with results favouring the placebo group; however, in both cases, the lower boundary of the confidence interval was zero (oestrogen‐only HT arm: weighted mean difference (WMD) ‐0.25, 95% CI ‐0.52 to 0.00; combined HT arm: WMD ‐0.18, 95% CI ‐0.35 to 0.00) (Analysis 1.34).
In the WHI 1998 (WHIMS) combined HT arm, a decline of 10 points or more in 3MSE scores (which represents > 2 standard deviations from baseline mean scores) was significantly more likely to occur among women in the active treatment group (RR 1.57, 95% CI 1.10 to 2.24; Analysis 1.31). Study results showed the same trend in the oestrogen‐only HT group, but this finding was not of statistical significance.
13.2 Probable dementia
Relevant comparisons
WHI 1998 (WHIMS), which included only women over 65 years of age and compared oestrogen‐only HT (CEE 0.625 mg) versus placebo for a mean of 5.6 years, and combined continuous HT (CEE 0.625 mg + MPA 2.5 mg) versus placebo for a mean of 4.2 years, reported this outcome.
Results
In the oestrogen‐only HT arm, researchers noted no statistically significant differences between groups. In the combined HT arm, the incidence of probable dementia was significantly higher in the group taking combined continuous HT than in the placebo group (RR 1.97, 95% CI 1.16 to 3.33). At 4.2 years, absolute risk of probable dementia increased from 9 per 1000 in the control group to 18 per 1000 (95% CI 11 to 30) in the HT group (Analysis 1.35).
13.3 Change in dementia status
Relevant comparisons
One small study (Mulnard 2000) included women with mild to moderate Alzheimer's disease. Researchers compared unopposed oestrogen for 1 year versus placebo and examined the primary outcome of change in overall status with relation to Alzheimer's disease, as measured by the Clinical Global Impression of Change Scale.
Results
Results of analysis show no statistically significant differences between groups (Analysis 3.1).
Other analyses
Studies included in any one analysis were insufficient to allow construction of a funnel plot.
Use of a random‐effects model had no material effect on any analyses. Studies in any one analysis were insufficient to permit sensitivity analysis by study risk of bias. Nor did any analyses include studies with marked clinical differences.
Discussion
Summary of main results
Cardiovascular disease
No evidence indicates that hormone therapy (HT) has a role in the treatment or prevention of cardiovascular disease. On the contrary, HT significantly increases the incidence of stroke and venous thromboembolism. and combined continuous HT also significantly increases the risk of coronary events (myocardial infarction or cardiac death). Oestrogen‐only HT does not appear to have any statistically significant effect (positive or negative) on coronary disease.
An increase in the risk of coronary events and in venous thromboembolism was evident during the first year of treatment among women taking combined continuous HT in both HERS 1998 and WHI 1998. Although a significant trend in both arms of WHI 1998 and in the blinded phase of HERS 1998 showed diminution of cardiovascular risk in the HT group over time, subsequent analysis of HERS 1998 data, which included both blinded and unblinded follow‐up, revealed no statistically significant variation in risk over time. WHI 1998 investigators suggest that the apparent decline in cardiovascular risk in later years may be due to an acceleration of events during earlier years among susceptible women in the HT group, and they point out that with longer duration of treatment, the risk of breast cancer is increased.
WHI 1998 (combined HT arm) conducted prespecified subgroup analyses to evaluate whether any clinical characteristics of the study population might plausibly modulate the coronary effects of HT: Variables included age, time since menopause, presence or absence of vasomotor symptoms, prior hormone use, coronary heart disease (CHD) risk factor status and presence or absence of preexisting cardiovascular disease. However, none of these variables significantly affected results.
Among women taking combined HT in WHI 1998, those who had factor V Leiden mutation (a blood coagulation disorder) were at higher risk of venous thromboembolism (Cushman 2004). Statistical power was insufficient to allow investigators to determine whether significant excess risk was associated with a history of venous thromboembolism (among women taking combined HT). The incidence of thromboembolism was higher among older and obese women, although this was related to their higher baseline risk of an event, and their risk ratio did not differ from that of other women taking combined HT.
It has been suggested that vascular effects of HT may differ according to a woman's age or time since onset of menopause. Thus oestrogen may counteract the early stages of atherosclerosis in recently menopausal women by inhibiting lipid deposits within the endothelium. However, HT may have adverse effects on more advanced disease, by facilitating an increase in enzymes that tend to disrupt atherosclerotic lesions, and by encouraging clot formation (Manson 2013;Reslan 2012). Research findings on the effect of HT in early menopause on intermediate outcomes of CVD are variable (ELITE 2014; KEEPS 2012), and research findings on this topic are continuing (Manson 2015).
Breast cancer
In WHI 1998 (combined HT arm), breast cancer rates in the HT group were initially lower than in the placebo group, and when WHI 1998 and WISDOM 2007 data were combined, at 1 year's follow‐up, the difference reached statistical significance, favouring the intervention group. However, by the fourth year of use, more events occurred in the HT group, and a statistically significant trend showed increasing risk over time. At a mean of 11 years' follow‐up in WHI 1998, women in the combined HT group had a significantly higher rate of invasive breast cancer than controls, and longer follow‐up (to a median of 13.2 years) showed no evidence of attenuation of risk (Chlebowski 2015a). At 11 years, the trend toward a higher rate of death from breast cancer approached statistical significance (Chlebowski 2010). This long‐term increase in risk was apparent despite evidence that the risk of breast cancer associated with combined HT declined markedly over the first 2 years after discontinuation of hormones (Chlebowski 2009a).
WHI 1998 investigators commented that breast cancers in the combined HT group were diagnosed at a similar grade but at a more advanced stage and suggested that combined HT may stimulate breast cancer growth while delaying diagnosis. Evidence shows that combined HT increases the frequency of abnormal mammograms and indications for breast biopsy but compromises the diagnostic performance of both of these tests (Chlebowski 2008). These factors would account for the lower incidence of breast cancer among women taking combined therapy during the first 2 years in WHI 1998. Subgroup analyses of prior hormone use in WHI 1998 revealed that the cumulative incidence of breast cancer over time in women taking combined HT increased at a greater rate than in women taking placebo after about 3 years for prior hormone users and after about 5 years for women with no prior use. Interference with mammography precluded the possibility of defining with any reliability a time frame for the safe use of combined HT (Anderson 2006).
WHI 1998 reported a decrease in the risk of breast cancer in the unopposed oestrogen arm of the trial, which reached statistical significance when investigators took into account the entire 10.7 years of intervention and extended follow‐up. Cumulative event rates still differed significantly between groups over 13 years' follow‐up, and risk of death from breast cancer was lower in the HT group at nearly 12 years. Comparison of hazard ratios during early and late postintervention periods showed that lower risk of breast cancer in the oestrogen arm persisted for about 4.5 years after the intervention was provided, at which point a significant difference between the interventions was no longer evident (Chlebowski 2015a;Chlebowski 2015b). Subgroup analyses showed significantly fewer early cancers and significantly fewer ductal carcinomas in the intervention group, although the incidence of lobular tumours did not differ significantly. Results showed that the reduction in breast cancer risk was concentrated in women without benign breast disease (P = 0.01) or a first‐degree family history of breast cancer (P = 0.02) (Anderson 2012). Oestrogen‐only HT appears to increase the number of women needing repeat mammography or breast biopsy but (in contrast to combined HT) does not appear to substantially compromise breast cancer detection (Chlebowski 2010a).
WHI 1998 researchers stated that differences between participants across the two arms of the study did not explain differences in breast cancer incidence and suggested that increased risk in the combined group might be due to progestogen. Similar trends in other studies (Beral 2003; HERS 1998) support this theory. A nested case‐control study comparing pair‐matched controls of women who developed breast cancer in either arm of WHI 1998 (Zhao 2014) suggested that post‐treatment changes in serum oestrogens and concentrations of sex hormone‐binding globulin, or changes in the association of such concentrations with disease risk, might explain both the increased breast cancer risk noted with combined HT and the reduction in risk seen with unopposed oestrogen. It has been observed that exposure to oestrogen after a sustained period of oestrogen deprivation reduces the risk of breast cancer (Jordan 2015; Obiorah 2013).
Colorectal cancer
The significantly reduced incidence of colorectal cancer in women taking combined continuous HT in WHI 1998 was offset by the finding that colorectal cancers diagnosed in such women tended to be more advanced, with greater likelihood of lymphatic or metastatic involvement. Moreover, the reduced incidence in the HT group did not lead to a reduced death rate from colorectal cancer over extended follow‐up (7.1 years), although investigators noted that an even longer period of follow‐up might be required to observe a mortality benefit from a reduction in the incidence of small, localised cancers. Women taking oestrogen‐only HT in WHI 1998 did not have a reduced incidence of or death rate from colorectal cancer over 7 years' follow‐up nor during extended follow‐up to 10.7 years. Overall, no strong evidence suggests a clinically meaningful reduction in colorectal cancer rates with oestrogen‐alone or oestrogen plus progestin. Findings in the WHI observational study supported this conclusion (Prentice 2009).
Lung cancer
Post hoc analysis of WHI 1998 data revealed that combined HT did not significantly increase the incidence of lung cancer over 8 years' follow‐up but did increase mortality from lung cancer, independent of smoking status. Study authors (Chlebowski 2009) suggested that this might be so because combined HT stimulates the growth of preexisting small cell lung cancers.
Gynaecological cancers
None of the included studies showed an increase in the incidence of endometrial cancer in the group taking HT. Three studies randomised women with a uterus to oestrogen‐only HT (EPAT 2001; ESPRIT 2002; PEPI 1995). As endometrial cancer is well documented as an adverse effect of unopposed oestrogen (Kurman 1985), these women were closely monitored for atypical endometrial hyperplasia and received treatment (and discontinuation of study medications) if it was detected. PEPI 1995 reported that women in the oestrogen‐only HT group were significantly more likely to develop atypical endometrial hyperplasia than women in the placebo group, whereas women in the combined HT groups in the same study showed no increased risk of hyperplasia. After more than 13 years' extended follow‐up, rates of endometrial cancer were lower in the combined HT group in WHI 1998.
The study of oestrogen‐only therapy in women who had undergone surgery for stage I or II endometrial cancer was underpowered owing to early discontinuation and could not conclusively refute or support the safety of this therapy with regard to risk of recurrence. Study authors note that recurrence rates were low, at 1.9% in the placebo group and 2.3% in the intervention group (Barakat 2006).
Results showed a trend towards increased risk of ovarian cancer in WHI 1998 (combined HT arm), which did not reach statistical significance (Anderson 2003). As noted above, a systematic review of (mainly) observational studies (Greiser 2006) suggests that both oestrogen‐only and combined therapy may be associated with increased risk of ovarian cancer.
A randomised study with 4‐year follow‐up of 130 women with a history of ovarian cancer (Guidozzi 1999) found that oestrogen‐only hormone therapy did not negatively affect disease‐free or overall survival time compared with no hormone therapy. A similar randomised study (AHT 2015) showed that women with severe menopausal symptoms after ovarian cancer who took HT (of varying types, according to consultant preference) had improved overall and relapse‐free survival compared with controls not taking HT. The present systematic review did not include these studies because they lacked a placebo control group.
The apparent reduction in risk of endometrial cancer associated with combined HT is offset by the suggestion of increased risk of ovarian cancer (Manson 2013).
Fractures
Evidence on HT and fractures is not consistent. WHI 1998 found a significantly reduced risk of fractures in women taking combined continuous HT or oestrogen‐only HT over nearly 8 years' follow‐up, but HERS 1998 reported no benefit for women on continuous combined HT. Moreover, unblinded continuation of HERS 1998 revealed a significantly increased risk of hip fracture among such women. Study authors attributed this finding to chance, noting that the effect was considerably smaller in the as‐treated analysis, and that such a finding lacks biological plausibility (Hulley 2004). WHI 1998 (combined HT arm) investigators tested the hypothesis that the beneficial effect of HT on fracture incidence differed according to fracture risk factors. They found that the reduction in risk provided by HT was no greater in women at high risk of fracture (Cauley 2003). However, WHI 1998 excluded women with severe osteoporosis and did not routinely collect bone mineral density; thus the benefits of HT may outweigh the risks for some women with severe osteoporosis. Reduced risk of hip fracture associated with HT did not persist in the extended follow‐up phase of WHI 1998 (oestrogen‐only HT).
Our analyses of hip fracture may have had insufficient power to reach conclusive findings. The risk of hip fracture rises steeply from the age of about 60 years but is still under 0.5% among women in the UK 65 to 69 years of age (Banks 2009).
Most women who need treatment for low bone mineral density require lifelong therapy, but the highest risk of cardiovascular events with combined HT occurs during the first year of use. Overall, although HT is considered effective for prevention of postmenopausal osteoporosis, it is generally recommended as an option only for women at significant risk, for whom non‐oestrogen therapies are unsuitable (Cranney 2002; NIH 2004).
Cognitive outcomes
WHI 1998 (WHIMS) found that neither combined HT nor oestrogen‐only HT improved global cognitive function in women over 65 years of age. Improvement in global cognitive function (Modified Mini‐Mental State Examination (3MSE) scores) that occurred in all participant groups over the first few years of WHIMS was attributed to a learning effect resulting from repeated administration of cognitive tests (Espeland 2004). The difference in mean scores between active therapy and placebo groups was of borderline statistical significance and consistently favoured placebo groups, although the difference was too small to be clinically meaningful. However, a marked decrease in 3MSE scores (defined as > 2 standard deviations from the baseline mean) was more frequent in the active treatment groups, and this trend reached statistical significance in the combined HT group. Moreover, in both arms, HT had greater detrimental effects in women whose baseline 3MSE scores were lowest (Espeland 2004).
Similarly, for the outcome of probable dementia, a negative trend in both active treatment groups reached statistical significance in the combined HT group. Evidence of increased risk in this group began to appear as early as 1 year after randomisation and persisted over 5 years' follow‐up. The overall risk of dementia in women taking combined HT was twice that in women in the corresponding placebo group. Investigators noted that the absolute risk of dementia remained relatively small, at 45 per 10,000 postmenopausal women over 65 years of age who took combined HT for 1 year (Shumaker 2004).
These findings were unexpected and contrast sharply with findings reported in earlier research. WHI 1998 (WHIMS) investigators suggested that this might be due to the healthy user bias seen in observational studies (whereby HT users had a better prognosis at baseline than the control groups), to the differential effects of HT on specific domains of cognition not measured individually by 3MSE, or both. Alternatively, they suggested that HT might need to be initiated during a critical period, such as menopause, to protect cognitive function at a later age. The mean age of the WHIMS population was 71 years, and the study could not address this theory, although previous users of HT in WHIMS did not have higher scores (Espeland 2004). Moreover, results of extended follow‐up in WHI 1998 (WHISCA) show no evidence of any benefit in domain‐specific cognitive function from oestrogen‐alone or combined HT.
A post hoc comparison of global cognitive function among younger women in WHI 1998 (Espeland 2013;Vaughan 2013) included women randomised to either active arm of WHI 1998 (CEE or combined HT) versus women in the placebo arm. Scores were similar in the two groups (P = 0.66). The study included 1376 women 50 to 55 years of age when randomised for WHI 1998. Cognitive testing was conducted an average of 7.2 years following trial completion, when women had a mean age of 67.2 years, and was repeated 1 year later. Study investigators concluded that "CEE‐based therapies produced no overall sustained benefit or risk to cognitive function when administered to postmenopausal women aged 50–55 years". However, among 2880 women who had enrolled for WHI 1998 at the age of 65 to 79 years, long‐term decrements in global cognitive function were noted in the HT groups (CEE or combined HT) relative to the placebo group, which consisted of older women (P < 0.05). Effects were small, and decrements were fairly stable. Findings did not vary according to type of HT, prior use or time since last menstrual period (Espeland 2016).
Gallbladder disease
Researchers have noted a statistically significant association between HT and gallbladder disease, with excess risk related to both oestrogen‐only and combined continuous HT. Although most of the statistical power for this outcome was derived from WHI 1998, findings with respect to combined continuous HT were strongly supported by data from both blinded and unblinded follow‐up in HERS 1998. WHI 1998 investigators noted that the risk started to increase in the active group during the first year and appeared to increase over time. They calculated that for one excess case of gallbladder disease, 323 women would need to take oestrogen‐only HT, or 500 women would need to take combined continuous HT for a year.
Overall completeness and applicability of evidence
Type of HT
Nearly all statistically significant findings described in this review derived from the two biggest studies ‐ HERS 1998 and WHI 1998. Both studies evaluated oral conjugated equine oestrogen (CEE) 0.625 mg, with or without continuous methoxyprogesterone (MPA 2.5 mg). Smaller studies using other types of HT reported very few or no major clinical events. We were generally unable to combine results from individual studies because they used different types of HT, which may not be equivalent in effect, or they differed with respect to the study population, or both. Controversy surrounds the degree to which the findings of WHI 1998 apply to any type of HT other than continuous combined oral CEE 0.625 mg with or without MPA 2.5 mg. Effects may vary with different oestrogens and progestogens, different time frames for the use of HRT and different doses and routes of administration (e.g. unopposed oestrogen and intrauterine progestogen). Observational evidence shows that transdermal oestrogen differs from oral oestrogen in that it is not associated with increased risk of venous thromboembolism and suggests that some types of progestogen are thrombogenic but others are safe in this respect (Canonico 2007).
Population characteristics
It is important to consider any increased risk to health in absolute rather than relative terms. This review is inevitably dominated by the findings of WHI 1998, which was designed to evaluate the efficacy of HT in preventing major causes of morbidity and mortality among older women (Matthews 1997). It was not designed to evaluate the risks and benefits of hormone therapy for treatment of menopausal symptoms, and it specifically excluded women who reported menopausal symptoms severe enough to preclude assignment to placebo treatment (Anderson 2003). Moreover, WHI 1998 did not include women younger than 50 years of age, and study findings may not apply to young surgically menopausal women, for example, a woman who has had both ovaries removed while in her forties (Kaunitz 2002).
Evidence is lacking on the long‐term effects of HT on healthy younger women, who are most likely to use it for menopausal symptoms. Such women are likely to be in their early fifties, when the absolute risk of a life‐threatening event is low; it has been estimated that absolute risk for many diseases approximately doubles with each decade of age (Hulley 2004). Subgroup analyses of women 50 to 59 years of age in WHI 1998 (combined HT arm)revealed that for relatively healthy women taking combined continuous HT, the only increase in risk that reached statistical significance was risk of venous thrombosis. Risk in the HT group increased from eight venous thromboses per 10,000 women per year to 19 per 10,000 women per year. This increase in risk was highest during the first year of therapy but continued over 5 years of treatment, and it was particularly high in obese women (i.e. women with a body mass index greater than 30), who had a 5‐year risk of 1.4% compared with 0.5% among women of normal weight. In the oestrogen‐only arm of WHI 1998, over the full 10.7 years of intervention and extended follow‐up, younger women (aged 50 to 59 years) randomised to HT had significantly more favourable outcomes than those randomised to placebo. The HT group had significantly lower hazard ratios for coronary heart disease, myocardial infarction and death when compared with the placebo group. Findings were similar for both coronary outcomes when data were stratified by time since menopause rather than by age. This contrasted with findings in older women, among whom those in the HT group showed a trend for higher rates of coronary heart disease, myocardial infarction and death, and significantly higher rates of colorectal cancer and chronic disease. WHI 1998 authors noted that study participants took unopposed oestrogen for a median duration of less than 6 years, and that study results cannot be extrapolated to longer or shorter treatment durations. Moreover, it is important to note that oestrogen‐only HT is contraindicated for women with an intact uterus, as use from 1 to 5 years has been estimated to increase the risk of endometrial cancer threefold (from a baseline lifetime risk of about 3% for a woman of 50), with effects persisting for several years after oestrogen is stopped (Grady 1995).
It has been suggested that effects of HT may differ according to whether it is initiated soon after menopause or after a lengthy gap (Barret‐Connor 2007). Analysis of randomised (Prentice 2009a) and observational (WHI 1998) data revealed that for most clinical outcomes, effects of HT did not vary by HT timing; this applied to both oestrogen‐only and combined HT. One exception was breast cancer, for which risk was higher among women who initiated HT soon after menopause than in those who had a longer time gap. Their overall risk of cancer was also higher.
HT appears to carry increased risk of recurrence for women with a history of breast cancer. Two unblinded studies conducted in Sweden randomised breast cancer survivors with menopausal symptoms to HT or non‐hormonal treatment. Both studies were terminated early owing to a statistically significant increase in the incidence of recurrent breast cancer in the hormonal group in one of the studies (risk ratio (RR) 3.5, 95% confidence interval (CI) 1.5 to 8.1) (Chlebowski 2004; Holmberg 2004). After a median of 4 years' follow‐up in this study, a clinically and statistically significantly increased risk of a new breast cancer event continued in the HT arm (RR 2.4, 95% CI 1.3 to 4.2) (Holmberg 2008). A similar study initiated in the UK terminated recruitment prematurely in January 2004 (ICR 2001).
For cardiovascular outcomes, results of HERS 1998 largely support the results of WHI 1998 (combined HT arm), suggesting that these findings can be generalised to older women taking combined continuous HT, whether or not they have known cardiovascular risk factors (although their findings differ with respect to fracture risk).
Health benefits and risks after stopping HT
WHI 1998 (combined HT arm) reported health outcomes at a mean of 2.4 years’ extended follow‐up after the planned intervention period (Heiss 2008). Follow‐up data for this period were available for 95% of women, few of whom were using HT during extended follow‐up (4.3% in the intervention arm and 1.2% in the placebo arm at 1 year after the study was stopped). Over the course of follow‐up, risk of coronary events, stroke and venous thromboembolism decreased in the group that had been randomised to combined HT, and reached a level comparable with that of the placebo group. Similarly, results showed no significant differences between groups in risk of fractures or of colorectal cancer by the end of postintervention follow‐up. However, in the group that had been randomised to combined HT, the hazard ratio (HR) for the outcome “all cancer” increased from 1.03 (95% CI 0.92 to 1.15) during the intervention phase to 1.24 (95% CI 1.04 to 1.48) in the postintervention period. This increase in risk was attributable in part to the disappearance of previous apparent protection from colorectal cancer, with some continued excess risk of breast cancer, along with added risk of lung cancer in the HT group. Study authors noted that clinical vigilance appears to be warranted with regard to sustained higher risk of malignancy following termination of combined HT therapy.
WHI 1998 (oestrogen‐only arm) reported health outcomes at a mean of 3.9 years' extended follow‐up (LaCroix 2011). Follow‐up data for this period were available for 78% of women, of whom only a small minority were using hormone therapy (up to 4.7% in the intervention arm and 3% in the placebo arm). Over the course of extended follow‐up, results continued to show no significant difference between groups in rates of coronary events. Increases in risk of stroke and venous thromboembolism in the HT arm rapidly disappeared, as did reduced risk of hip fracture in this group. As noted above, the lower incidence of breast cancer persisted and became statistically significant with extended follow‐up to 10.7 years (i.e. including both planned intervention and extended follow‐up periods).
Quality of the evidence
Most of the included studies were at low risk of bias in most domains (Figure 1). We rated the overall quality of evidence as moderate, and the main limitation involved questions about applicability of the evidence because most of the data were provided by WHI 1998, in which only about 33% of the study sample was 50 to 59 years of age at baseline (i.e. the age at which women are most likely to consider HT for vasomotor symptoms); mean participant age was 63 years.
A high proportion of women in these studies did not receive the treatment to which they were randomised. In general, the number of women who discontinued their medication or who took less than 80% of their medication was disproportionately high in the HT groups, presumably because of a higher incidence of adverse effects such as vaginal bleeding. WHI 1998 noted that if discontinuation of treatment and initiation of non‐study treatment occurred independently of risk factors for clinical outcomes, their intention‐to‐treat analysis underestimates both harms and benefits of HT among women who adhere to treatment (WHI 2002). This study included a disproportionate number of women who were unblinded in the HT group compared with the placebo group (40% vs 6%), primarily to manage persistent vaginal bleeding, and it has been suggested that this differential unblinding may have resulted in higher detection rates of otherwise undetectable myocardial infarction in the HT group (Shapiro 2003). However, it has been suggested that detection bias on a scale that would explain the differences between groups for coronary heart disease could not have occurred, and that any bias was more likely to have occurred in the opposite direction, mitigating against detection of effects (Tucker 2003).
Potential biases in the review process
This review is subject to patient selection bias. Most of the included studies had a mean participant age over 60 years, and none focused on perimenopausal women. In all but one of the 20 studies that reported mean participant age, mean age at enrolment was over 50 years. This does not reflect usual clinical practice with respect to prescribing of HT, which is most likely to occur for treatment of vasomotor symptoms at the time women reach menopause (Pedersen 2003). Moreover, participants described as 'relatively healthy' in this review were derived largely from WHI 1998. Investigators reported a high frequency of obesity and hypertensive disorders among WHI 1998 participants; only 30% were of normal weight, and 30% were morbidly obese (body mass index (BMI) > 30 kg/m2); 36% were receiving treatment for hypertension or had blood pressure exceeding 140/90 mmHg at enrolment.
Despite extensive searching, we may have failed to identify all relevant studies. However, it is unlikely that we missed any study large enough to substantially influence our overall findings, given dominance of the review by WHI 1998. Similarly, although our data could conceivably have been organised in a different way (e.g. for categorising of study populations and HT doses), again the dominance of WHI 1998 makes it extremely unlikely that this would have influenced our findings. We chose not to pool studies that used different types of HT, and this approach is supported by contrasting findings in the two arms (combined vs oestrogen‐only HT) of WHI 1998 for some outcomes.
The choice of 1 year's duration of HT as a cut‐off point for inclusion of studies was arbitrary but is unlikely to have introduced bias, as it was a prespecified criterion.
Agreements and disagreements with other studies or reviews
Our findings are consistent with those of a Cochrane review of HT for preventing cardiovascular disease in postmenopausal women (Boardman 2015), which concluded that use of HT in postmenopausal women has little if any benefit for primary or secondary prevention of cardiovascular disease and causes an increase in the risk of stroke and venous thromboembolic events. Boardman 2015 differed from the current review in that review authors pooled data related to unopposed oestrogen with data for combined HT.
However, our findings differ from those of some older systematic reviews.
A systematic review of available randomised evidence was conducted in 1997 and was updated with unpublished evidence in 2000 (Hemminki 1997; Hemminki 2000). Review authors reported a conservatively estimated odds ratio for cardiovascular events of 1.34 (95% CI 0.55 to 3.30) among those taking HT. However, this result was based on only 15 secondary events in those allocated to HT and seven among the control groups and provided insufficient evidence to exclude potential benefit from HT.
Beral 2002 pooled the results of four randomised controlled trials of HT published between 1998 and 2002 (EVTET 2000; HERS 1998; WEST 2001; WHI 1998). They reported no significant excess or reduction in the risk ratio of CHD, and their findings negated the large beneficial effect of HT reported for cardiovascular outcomes in earlier observational studies. Moreover, they described excess risk of stroke, pulmonary embolus and breast cancer. Review authors found that risk of colorectal cancer or fractured neck of femur was significantly reduced for the HT group, and the findings for endometrial cancer risk were inconclusive. The authors of this review pooled the results of studies that used different types of HT over variable time frames. The most notable difference between the current review and Beral 2002 is that the current review found a statistically significant increase in risk of coronary heart disease among women taking combined continuous HT, particularly in the first year. Unlike the current review, Beral 2002 pooled results from studies of differing participant groups and types of HT; this appears to explain why overall findings differ.
Salpeter 2004 meta‐analysed 17 RCTs of HT that reported at least 1 death and concluded that risk of death was significantly reduced in women with a mean age under 60 years who were taking HT compared with those taking a placebo, although results showed no difference when older women were compared. This meta‐analysis pooled studies that differed widely with respect to the type of HT used and the clinical status of participants; in several studies, death was not a prespecified outcome. Moreover, women with poor prognosis for ovarian cancer accounted for 60% of events in the meta‐analysis of studies of younger women. In the current review, evidence shows no survival advantage for women taking HT, although only one of the included studies (WHI 1998 (oestrogen‐only HT)) analysed younger women as a subgroup for this outcome. Of the 17 studies that Salpeter et al included in their meta‐analysis of younger women, only two met the inclusion criteria for the present review; the other 15 studies included in the earlier review were not blinded, did not report mortality as a primary or secondary outcome or were of less than 1 year's duration.
A systematic review of studies of hormone therapy and ovarian cancer (Greiser 2006) included 30 case‐control studies, seven cohort studies, one randomised controlled study and four cancer registry studies. This review found increased risk of ovarian cancer associated with the use of oestrogen‐only HT (RR 1.28, 95% CI 1.18 to 1.40) or combined hormone therapy (RR 1.11, 95% CI 1.02 to 1.21). This risk applied to a range of common histological subtypes of ovarian cancer. Review authors noted that this review was limited by reliance on observational data; however, heterogeneity was low or moderate in most analyses.
Another systematic review (Bath 2005) meta‐analysed 28 RCTs of HT that reported stroke events. HT was associated with a statistically significant excess risk of stroke, particularly ischaemic stroke. Moreover, participants in the HT group who had a stroke seemed to have a worse outcome. This review had very broad inclusion criteria and pooled a wide range of studies, which used different types of HT for a range of indications, some with male participants and some without placebo control. It is unclear to what extent these findings apply to perimenopausal and postmenopausal women.
A Danish study (Schierbeck 2012) of 1006 recently postmenopausal or perimenopausal women (aged 45 to 58 years) was not eligible for this review owing to lack of blinding. Investigators reported that after 10 years of treatment, women taking triphasic 17‐B oestradiol with norethisterone acetate or (in those who had had a hysterectomy) oestradiol alone were at lower risk of experiencing their primary outcome ‐ a composite of death and admission to hospital for heart failure or myocardial infarction (hazard ratio 0.48, 95% CI 0.26 to 0.87; P = 0.015). No increase in risk of cancer, venous thromboembolism or stroke was apparent. Study authors attributed the difference between their findings and those of WHI 1998 to the younger age and proximity to menopause of their participants. This study was limited by lack of blinding and by the use of a composite primary outcome that was not prespecified in the study protocol (Marjoribanks 2012; Schroll 2012; Shapiro 2003). It has been noted that the cardiovascular outcomes were not ascertained by researchers but were based on data from individual clinicians entered into a national database (Abelin 2012).
We found no randomised studies or systematic reviews that provided evidence about the risks of long‐term HT in perimenopausal women or those younger than 50 years of age.
Current recommendations favour the use of low‐dose HT for relief of vasomotor symptoms among women within 10 years of their last period, taken for the shortest possible time required to achieve treatment goals, with doses individually tailored and reviewed regularly (NAMS 2012; NICE 2015; RANZCOG 2012).

Risk of bias summary: review authors' judgements about each risk of bias item for each included study.

Study flow diagram.

Risk of bias graph: review authors' judgements about each risk of bias item presented as percentages across all included studies.

Comparison 1 Women without major health problems (selected outcomes: death, CVD, cognition, QOL), Outcome 1 Death from any cause: oestrogen‐only HT.

Comparison 1 Women without major health problems (selected outcomes: death, CVD, cognition, QOL), Outcome 2 Death from any cause: combined HT.
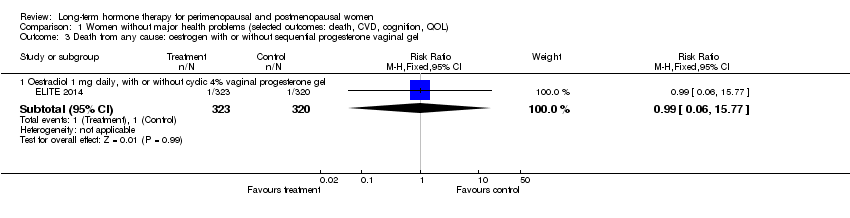
Comparison 1 Women without major health problems (selected outcomes: death, CVD, cognition, QOL), Outcome 3 Death from any cause: oestrogen with or without sequential progesterone vaginal gel.
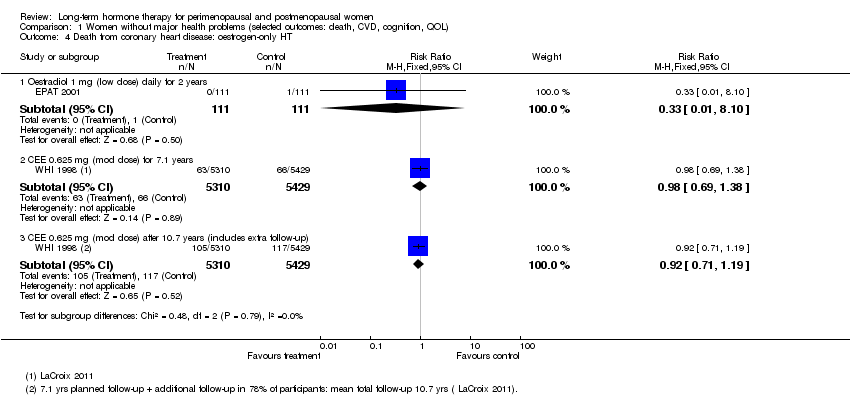
Comparison 1 Women without major health problems (selected outcomes: death, CVD, cognition, QOL), Outcome 4 Death from coronary heart disease: oestrogen‐only HT.

Comparison 1 Women without major health problems (selected outcomes: death, CVD, cognition, QOL), Outcome 5 Death from coronary heart disease: combined continuous HT.

Comparison 1 Women without major health problems (selected outcomes: death, CVD, cognition, QOL), Outcome 6 Death from coronary heart disease: combined sequential HT.
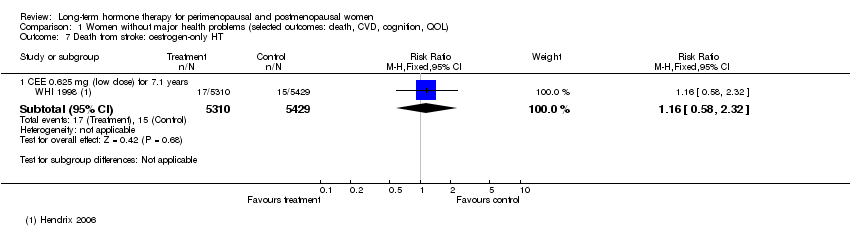
Comparison 1 Women without major health problems (selected outcomes: death, CVD, cognition, QOL), Outcome 7 Death from stroke: oestrogen‐only HT.

Comparison 1 Women without major health problems (selected outcomes: death, CVD, cognition, QOL), Outcome 8 Death from stroke: combined sequential HT.

Comparison 1 Women without major health problems (selected outcomes: death, CVD, cognition, QOL), Outcome 9 Death from stroke: combined continuous HT.
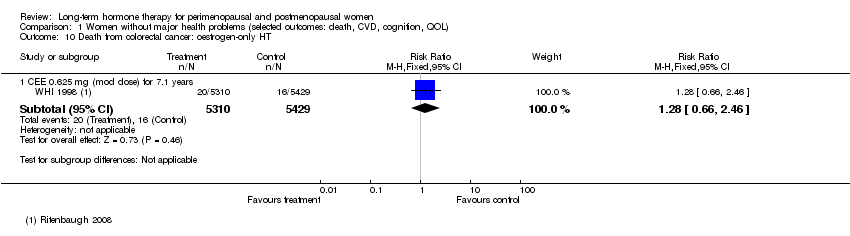
Comparison 1 Women without major health problems (selected outcomes: death, CVD, cognition, QOL), Outcome 10 Death from colorectal cancer: oestrogen‐only HT.

Comparison 1 Women without major health problems (selected outcomes: death, CVD, cognition, QOL), Outcome 11 Death from breast cancer: combined continuous HT.
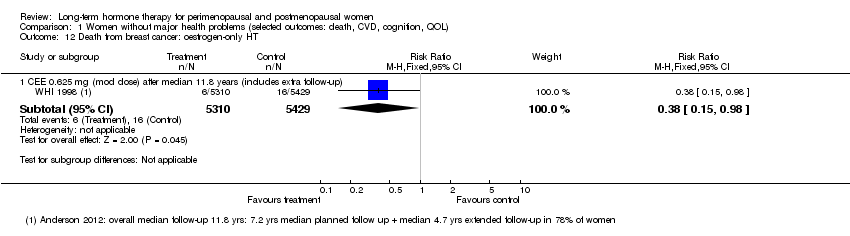
Comparison 1 Women without major health problems (selected outcomes: death, CVD, cognition, QOL), Outcome 12 Death from breast cancer: oestrogen‐only HT.

Comparison 1 Women without major health problems (selected outcomes: death, CVD, cognition, QOL), Outcome 13 Death from colorectal cancer: combined continuous HT.
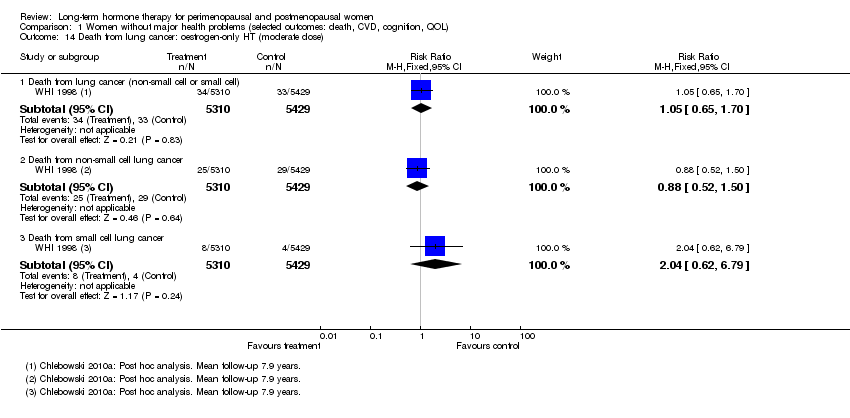
Comparison 1 Women without major health problems (selected outcomes: death, CVD, cognition, QOL), Outcome 14 Death from lung cancer: oestrogen‐only HT (moderate dose).

Comparison 1 Women without major health problems (selected outcomes: death, CVD, cognition, QOL), Outcome 15 Death from lung cancer: combined continuous HT (moderate dose).

Comparison 1 Women without major health problems (selected outcomes: death, CVD, cognition, QOL), Outcome 16 Death from lung cancer: combined sequential HT (low dose oestrogen).
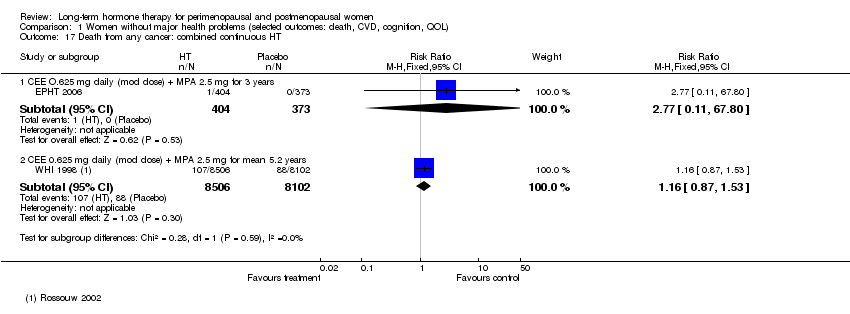
Comparison 1 Women without major health problems (selected outcomes: death, CVD, cognition, QOL), Outcome 17 Death from any cancer: combined continuous HT.
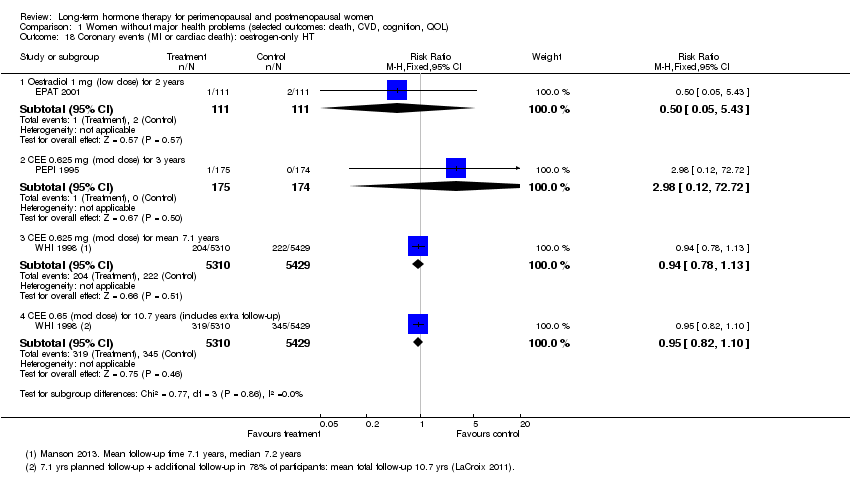
Comparison 1 Women without major health problems (selected outcomes: death, CVD, cognition, QOL), Outcome 18 Coronary events (MI or cardiac death): oestrogen‐only HT.
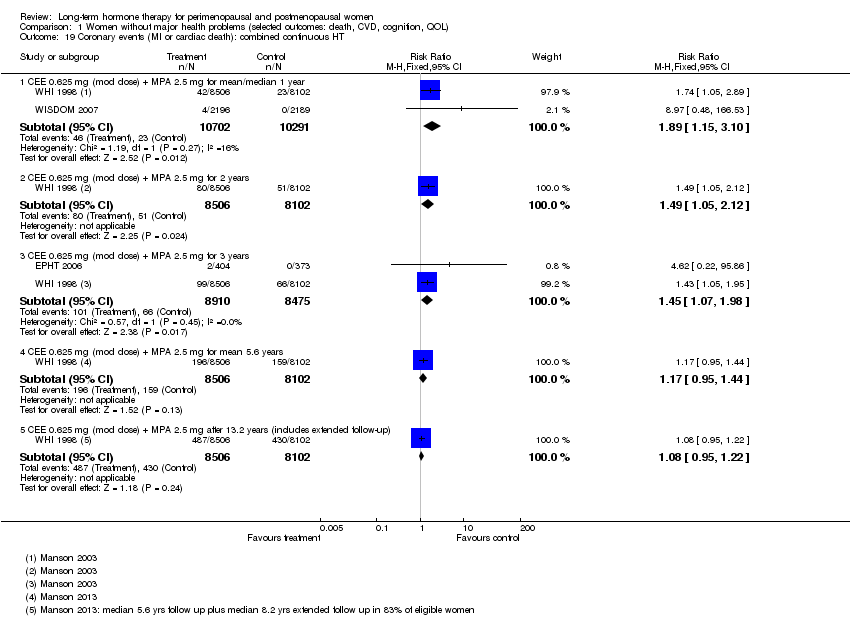
Comparison 1 Women without major health problems (selected outcomes: death, CVD, cognition, QOL), Outcome 19 Coronary events (MI or cardiac death): combined continuous HT.

Comparison 1 Women without major health problems (selected outcomes: death, CVD, cognition, QOL), Outcome 20 Coronary events (MI or cardiac death): combined sequential HT.
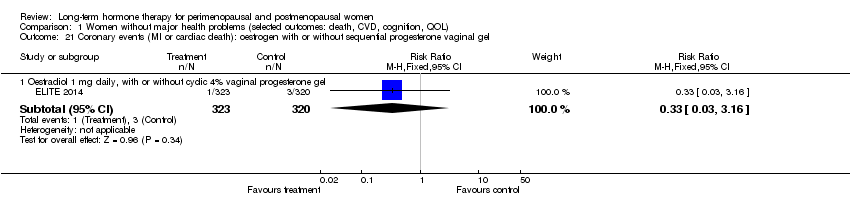
Comparison 1 Women without major health problems (selected outcomes: death, CVD, cognition, QOL), Outcome 21 Coronary events (MI or cardiac death): oestrogen with or without sequential progesterone vaginal gel.

Comparison 1 Women without major health problems (selected outcomes: death, CVD, cognition, QOL), Outcome 22 Stroke: unopposed oestrogen.

Comparison 1 Women without major health problems (selected outcomes: death, CVD, cognition, QOL), Outcome 23 Stroke: combined continuous HT.

Comparison 1 Women without major health problems (selected outcomes: death, CVD, cognition, QOL), Outcome 24 Stroke: combined sequential HT.
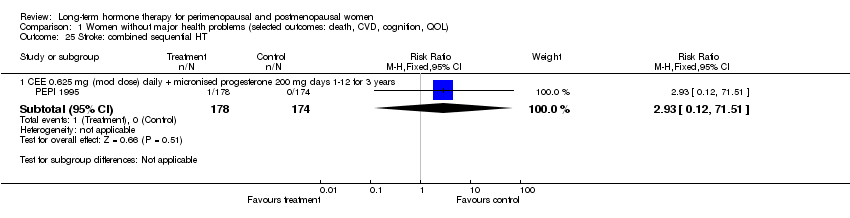
Comparison 1 Women without major health problems (selected outcomes: death, CVD, cognition, QOL), Outcome 25 Stroke: combined sequential HT.
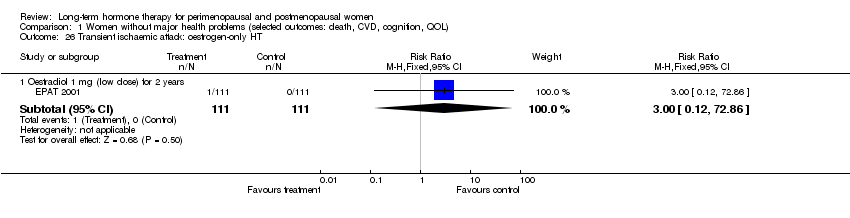
Comparison 1 Women without major health problems (selected outcomes: death, CVD, cognition, QOL), Outcome 26 Transient ischaemic attack: oestrogen‐only HT.
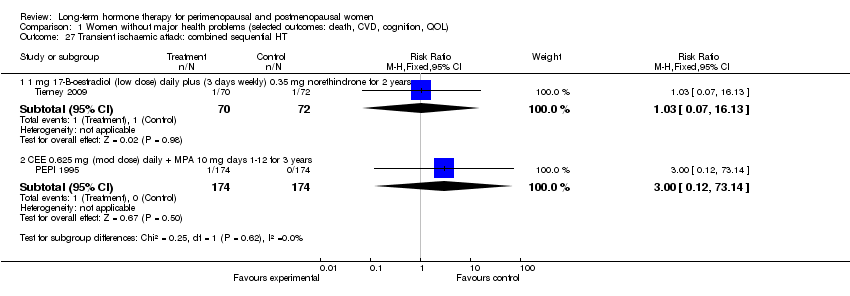
Comparison 1 Women without major health problems (selected outcomes: death, CVD, cognition, QOL), Outcome 27 Transient ischaemic attack: combined sequential HT.
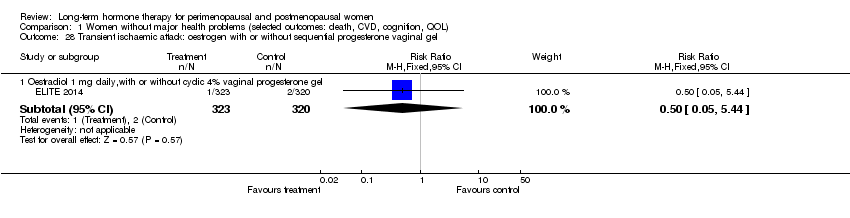
Comparison 1 Women without major health problems (selected outcomes: death, CVD, cognition, QOL), Outcome 28 Transient ischaemic attack: oestrogen with or without sequential progesterone vaginal gel.

Comparison 1 Women without major health problems (selected outcomes: death, CVD, cognition, QOL), Outcome 29 Stroke or transient ischaemic attack.

Comparison 1 Women without major health problems (selected outcomes: death, CVD, cognition, QOL), Outcome 30 Venous thromboembolism (DVT or PE): oestrogen‐only HT.

Comparison 1 Women without major health problems (selected outcomes: death, CVD, cognition, QOL), Outcome 31 Venous thromboembolism (DVT or PE): combined sequential HT.

Comparison 1 Women without major health problems (selected outcomes: death, CVD, cognition, QOL), Outcome 32 Venous thromboembolism (DVT or PE): combined continuous HT.

Comparison 1 Women without major health problems (selected outcomes: death, CVD, cognition, QOL), Outcome 33 Venous thromboembolism (DVT or PE): oestrogen with or without sequential progesterone vaginal gel.

Comparison 1 Women without major health problems (selected outcomes: death, CVD, cognition, QOL), Outcome 34 Global cognitive function.

Comparison 1 Women without major health problems (selected outcomes: death, CVD, cognition, QOL), Outcome 35 Probable dementia.

Comparison 2 Women with cardiovascular disease (selected outcomes: death, CVD, cognition, QOL), Outcome 1 Death from any cause: oestrogen‐only HT.

Comparison 2 Women with cardiovascular disease (selected outcomes: death, CVD, cognition, QOL), Outcome 2 Death from any cause: oestrogen‐only or combined sequential HT.

Comparison 2 Women with cardiovascular disease (selected outcomes: death, CVD, cognition, QOL), Outcome 3 Death from any cause: combined continuous HT.

Comparison 2 Women with cardiovascular disease (selected outcomes: death, CVD, cognition, QOL), Outcome 4 Death from coronary heart disease: oestrogen‐only HT.

Comparison 2 Women with cardiovascular disease (selected outcomes: death, CVD, cognition, QOL), Outcome 5 Death from CHD: oestrogen‐only or combined sequential HT.

Comparison 2 Women with cardiovascular disease (selected outcomes: death, CVD, cognition, QOL), Outcome 6 Death from CHD: combined continuous HT.
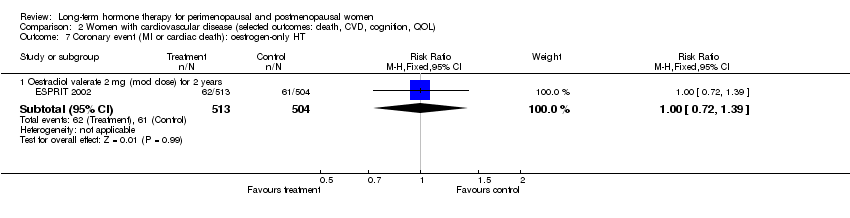
Comparison 2 Women with cardiovascular disease (selected outcomes: death, CVD, cognition, QOL), Outcome 7 Coronary event (MI or cardiac death): oestrogen‐only HT.
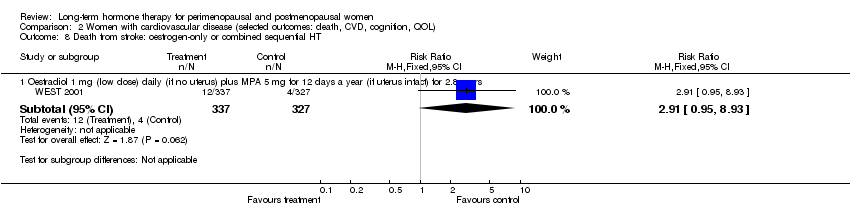
Comparison 2 Women with cardiovascular disease (selected outcomes: death, CVD, cognition, QOL), Outcome 8 Death from stroke: oestrogen‐only or combined sequential HT.

Comparison 2 Women with cardiovascular disease (selected outcomes: death, CVD, cognition, QOL), Outcome 9 Death from cancer: combined continuous HT.

Comparison 2 Women with cardiovascular disease (selected outcomes: death, CVD, cognition, QOL), Outcome 10 Coronary event (MI or cardiac death): oestrogen‐only HT.
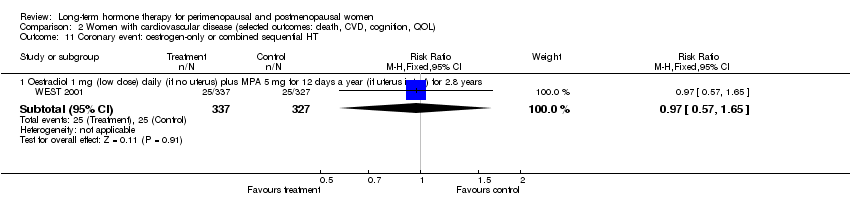
Comparison 2 Women with cardiovascular disease (selected outcomes: death, CVD, cognition, QOL), Outcome 11 Coronary event: oestrogen‐only or combined sequential HT.

Comparison 2 Women with cardiovascular disease (selected outcomes: death, CVD, cognition, QOL), Outcome 12 Coronary event (MI or cardiac death): combined continuous HT.

Comparison 2 Women with cardiovascular disease (selected outcomes: death, CVD, cognition, QOL), Outcome 13 Stroke (first or recurrent): oestrogen‐only HT or combined sequential.

Comparison 2 Women with cardiovascular disease (selected outcomes: death, CVD, cognition, QOL), Outcome 14 Stroke (first or recurrent): oestrogen‐only HT (mod dose).

Comparison 2 Women with cardiovascular disease (selected outcomes: death, CVD, cognition, QOL), Outcome 15 Stroke (first or recurrent): combined continuous HT (mod dose oestrogen).

Comparison 2 Women with cardiovascular disease (selected outcomes: death, CVD, cognition, QOL), Outcome 16 Transient ischaemic attack: oestrogen‐only HT (mod dose).

Comparison 2 Women with cardiovascular disease (selected outcomes: death, CVD, cognition, QOL), Outcome 17 Transient ischaemic attack: oestrogen‐only or combined sequential HT.

Comparison 2 Women with cardiovascular disease (selected outcomes: death, CVD, cognition, QOL), Outcome 18 Transient ischaemic attack: combined continuous HT.

Comparison 2 Women with cardiovascular disease (selected outcomes: death, CVD, cognition, QOL), Outcome 19 Stroke or transient ischaemic attack: oestrogen‐only HT.

Comparison 2 Women with cardiovascular disease (selected outcomes: death, CVD, cognition, QOL), Outcome 20 Stroke or transient ischaemic attack: combined continuous HT.

Comparison 2 Women with cardiovascular disease (selected outcomes: death, CVD, cognition, QOL), Outcome 21 VTE (first or recurrent PE or DVT): oestrogen‐only HT.
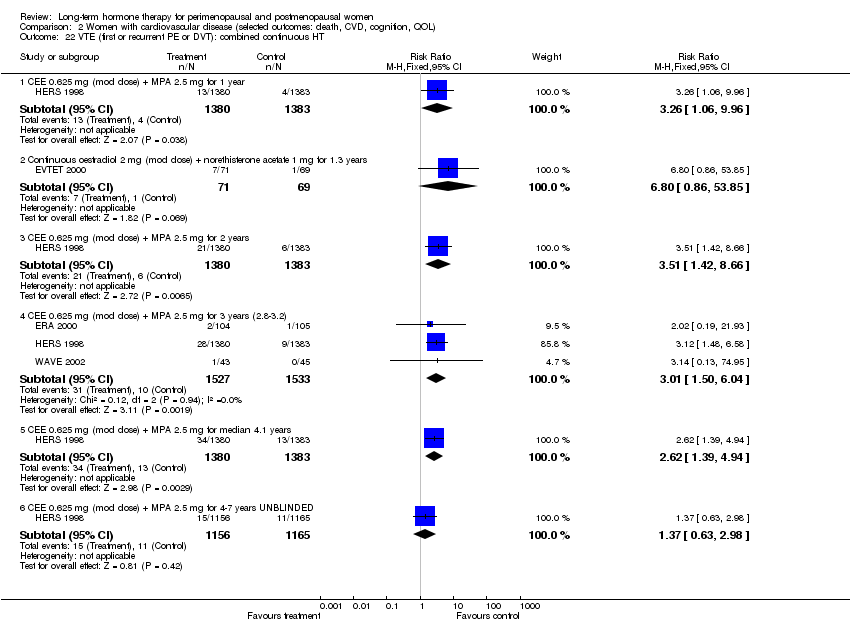
Comparison 2 Women with cardiovascular disease (selected outcomes: death, CVD, cognition, QOL), Outcome 22 VTE (first or recurrent PE or DVT): combined continuous HT.

Comparison 3 Women with dementia, Outcome 1 Worsening of dementia on treatment (by ADCS‐CGIC score): oestrogen‐only HT.
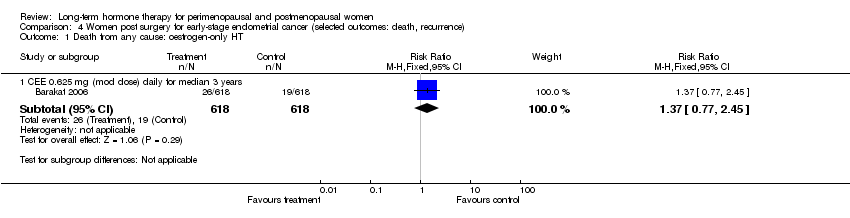
Comparison 4 Women post surgery for early‐stage endometrial cancer (selected outcomes: death, recurrence), Outcome 1 Death from any cause: oestrogen‐only HT.
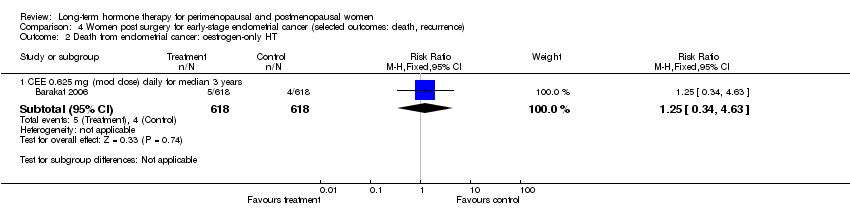
Comparison 4 Women post surgery for early‐stage endometrial cancer (selected outcomes: death, recurrence), Outcome 2 Death from endometrial cancer: oestrogen‐only HT.

Comparison 4 Women post surgery for early‐stage endometrial cancer (selected outcomes: death, recurrence), Outcome 3 Death from CHD: oestrogen‐only HT.

Comparison 5 Women hospitalised with chronic illness (selected outcomes: death, CVD, VTE), Outcome 1 All‐cause death: combined sequential HT.

Comparison 5 Women hospitalised with chronic illness (selected outcomes: death, CVD, VTE), Outcome 2 Myocardial infarction: combined sequential HT.

Comparison 5 Women hospitalised with chronic illness (selected outcomes: death, CVD, VTE), Outcome 3 Venous thromboembolism (DVT or PE): combined sequential HT.

Comparison 6 All women (selected outcomes: cancer, cholecystic disease, fractures), Outcome 1 Breast cancer: oestrogen‐only HT.
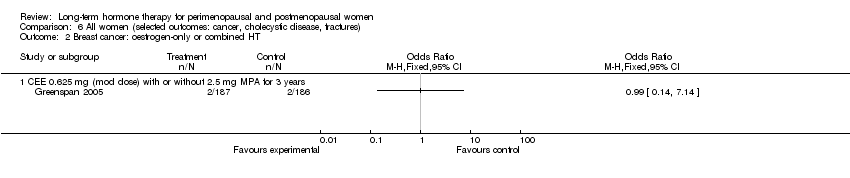
Comparison 6 All women (selected outcomes: cancer, cholecystic disease, fractures), Outcome 2 Breast cancer: oestrogen‐only or combined HT.

Comparison 6 All women (selected outcomes: cancer, cholecystic disease, fractures), Outcome 3 Breast cancer: combined continuous HT.

Comparison 6 All women (selected outcomes: cancer, cholecystic disease, fractures), Outcome 4 Breast cancer: combined sequential HT.

Comparison 6 All women (selected outcomes: cancer, cholecystic disease, fractures), Outcome 5 Breast cancer: oestrogen with or without sequential progesterone vaginal gel.
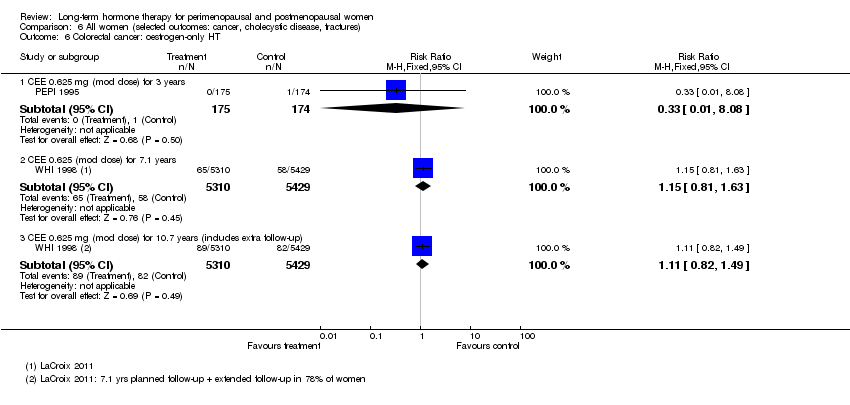
Comparison 6 All women (selected outcomes: cancer, cholecystic disease, fractures), Outcome 6 Colorectal cancer: oestrogen‐only HT.
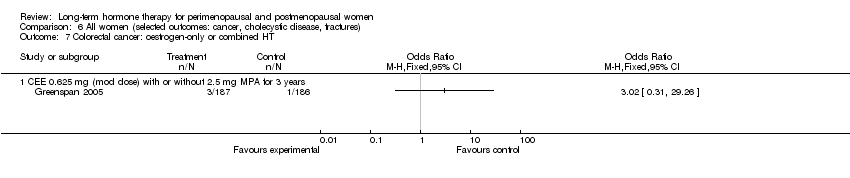
Comparison 6 All women (selected outcomes: cancer, cholecystic disease, fractures), Outcome 7 Colorectal cancer: oestrogen‐only or combined HT.
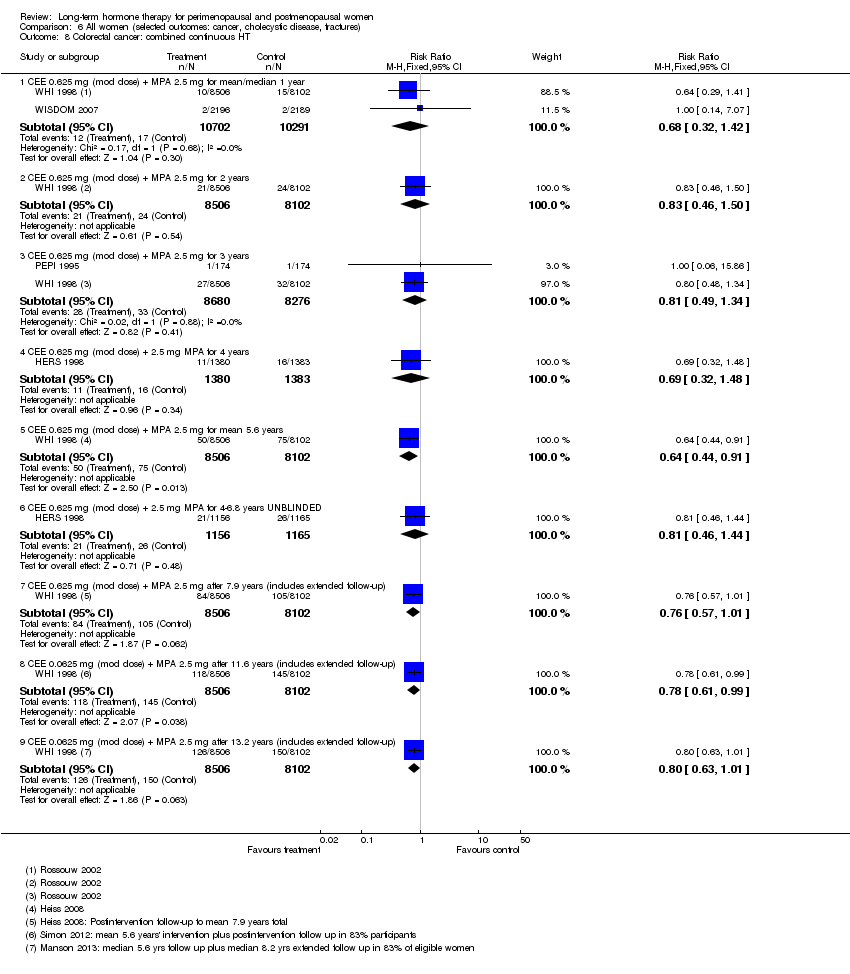
Comparison 6 All women (selected outcomes: cancer, cholecystic disease, fractures), Outcome 8 Colorectal cancer: combined continuous HT.

Comparison 6 All women (selected outcomes: cancer, cholecystic disease, fractures), Outcome 9 Colorectal cancer: combined sequential HT.
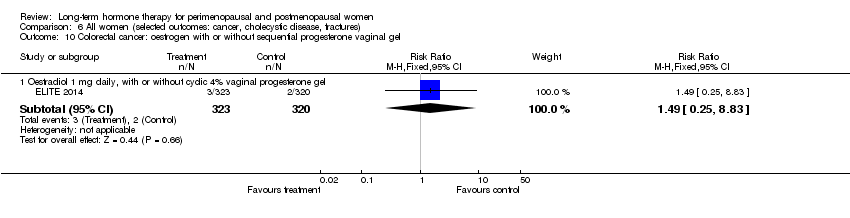
Comparison 6 All women (selected outcomes: cancer, cholecystic disease, fractures), Outcome 10 Colorectal cancer: oestrogen with or without sequential progesterone vaginal gel.

Comparison 6 All women (selected outcomes: cancer, cholecystic disease, fractures), Outcome 11 Lung cancer: oestrogen‐only HT (moderate dose).

Comparison 6 All women (selected outcomes: cancer, cholecystic disease, fractures), Outcome 12 Lung cancer: combined continuous HT (mod dose oestrogen).
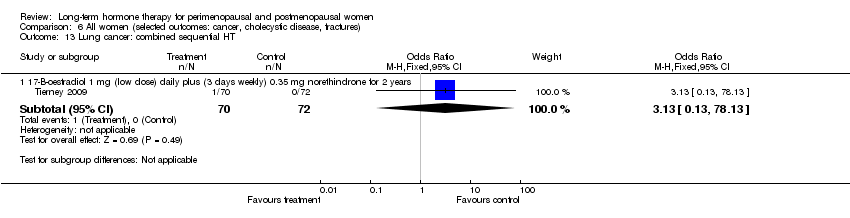
Comparison 6 All women (selected outcomes: cancer, cholecystic disease, fractures), Outcome 13 Lung cancer: combined sequential HT.

Comparison 6 All women (selected outcomes: cancer, cholecystic disease, fractures), Outcome 14 Endometrial cancer: oestrogen‐only HT.
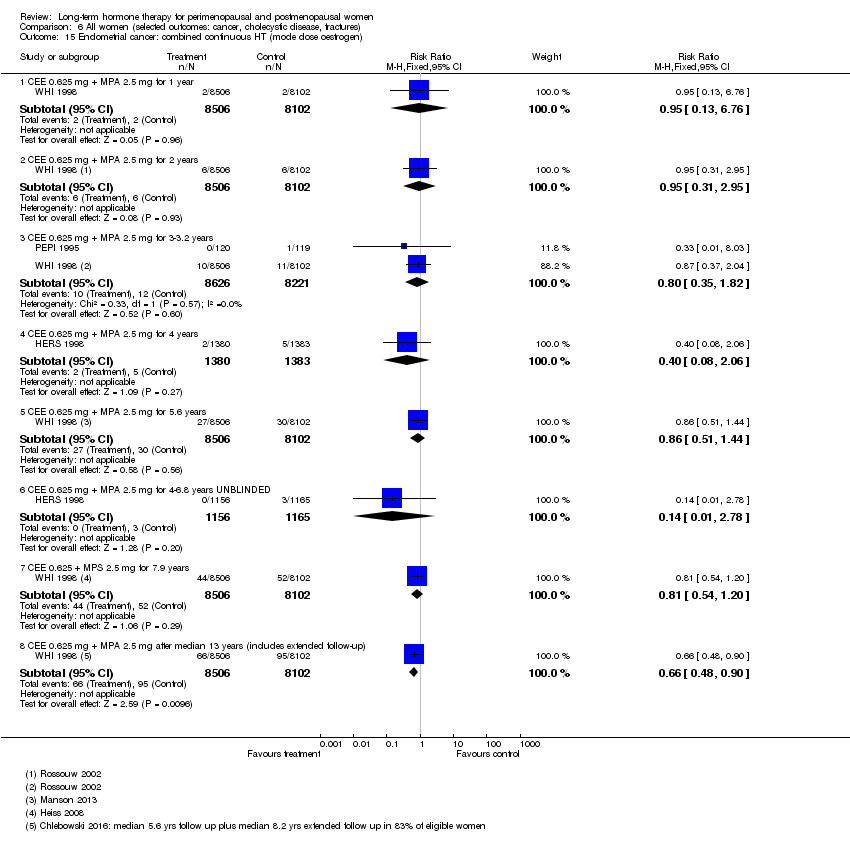
Comparison 6 All women (selected outcomes: cancer, cholecystic disease, fractures), Outcome 15 Endometrial cancer: combined continuous HT (mode dose oestrogen).

Comparison 6 All women (selected outcomes: cancer, cholecystic disease, fractures), Outcome 16 Endometrial cancer: combined sequential HT.

Comparison 6 All women (selected outcomes: cancer, cholecystic disease, fractures), Outcome 17 Recurrent endometrial cancer: oestrogen‐only HT.

Comparison 6 All women (selected outcomes: cancer, cholecystic disease, fractures), Outcome 18 Ovarian cancer: combined continuous HT.
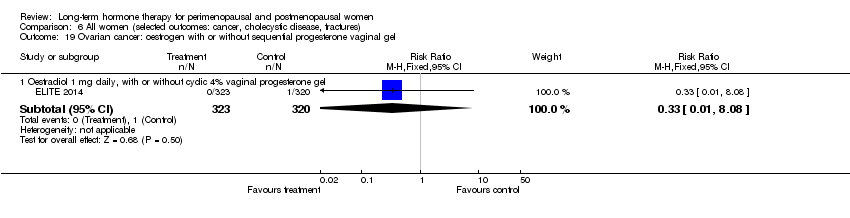
Comparison 6 All women (selected outcomes: cancer, cholecystic disease, fractures), Outcome 19 Ovarian cancer: oestrogen with or without sequential progesterone vaginal gel.

Comparison 6 All women (selected outcomes: cancer, cholecystic disease, fractures), Outcome 20 Gallbladder disease requiring surgery: oestrogen‐only HT.

Comparison 6 All women (selected outcomes: cancer, cholecystic disease, fractures), Outcome 21 Gallbladder disease requiring surgery: combined continuous HT.

Comparison 6 All women (selected outcomes: cancer, cholecystic disease, fractures), Outcome 22 Gallbladder disease requiring surgery: combined sequential HT.

Comparison 6 All women (selected outcomes: cancer, cholecystic disease, fractures), Outcome 23 Hip fractures: oestrogen‐only HT.

Comparison 6 All women (selected outcomes: cancer, cholecystic disease, fractures), Outcome 24 Hip fractures: oestrogen‐only or combined sequential HT.
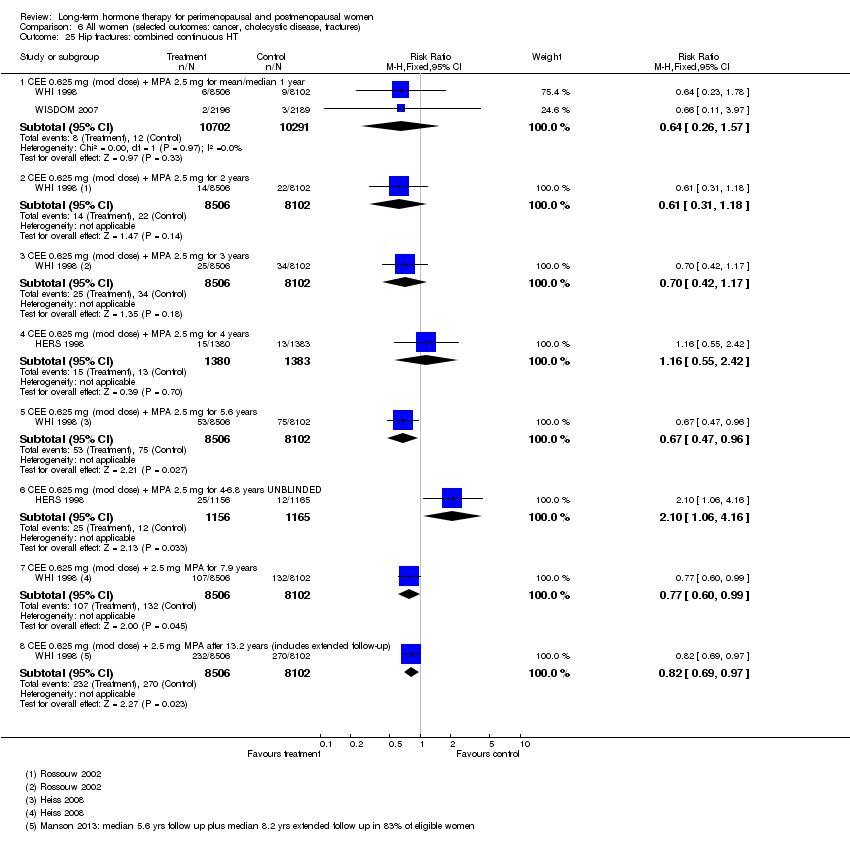
Comparison 6 All women (selected outcomes: cancer, cholecystic disease, fractures), Outcome 25 Hip fractures: combined continuous HT.
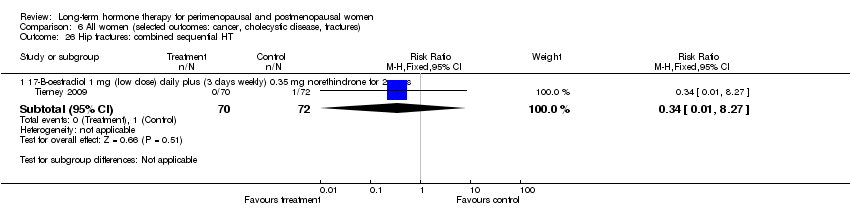
Comparison 6 All women (selected outcomes: cancer, cholecystic disease, fractures), Outcome 26 Hip fractures: combined sequential HT.
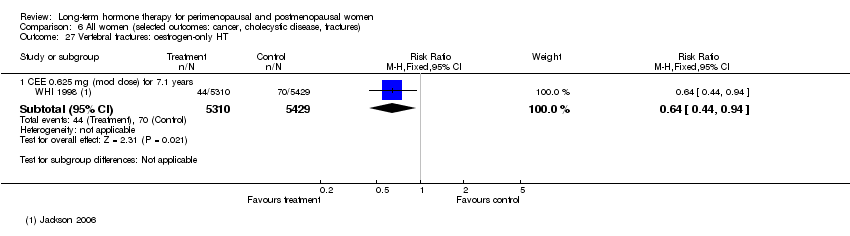
Comparison 6 All women (selected outcomes: cancer, cholecystic disease, fractures), Outcome 27 Vertebral fractures: oestrogen‐only HT.

Comparison 6 All women (selected outcomes: cancer, cholecystic disease, fractures), Outcome 28 Vertebral fractures: combined continuous HT.

Comparison 6 All women (selected outcomes: cancer, cholecystic disease, fractures), Outcome 29 All clinical fractures: oestrogen‐only or combined sequential HT.

Comparison 6 All women (selected outcomes: cancer, cholecystic disease, fractures), Outcome 30 All clinical fractures: oestrogen‐only HT (moderate dose).

Comparison 6 All women (selected outcomes: cancer, cholecystic disease, fractures), Outcome 31 All clinical fractures: oestrogen‐only or combined HT.

Comparison 6 All women (selected outcomes: cancer, cholecystic disease, fractures), Outcome 32 All clinical fractures: combined continuous HT.

Comparison 6 All women (selected outcomes: cancer, cholecystic disease, fractures), Outcome 33 All clinical fractures: combined sequential HT.
| Combined continuous hormone therapy (HT) compared with placebo for perimenopausal and postmenopausal women | ||||||
| Population: relatively healthy postmenopausal women Setting: community | ||||||
| Outcomes | Illustrative comparative risks* (95% CI) | Relative effect | No. of participants | Quality of the evidence | Comments | |
| Assumed risk* | Corresponding risk | |||||
| Placebo | Combined continuous hormone therapy (HT) | |||||
| Coronary events (MI or cardiac death) Follow‐up: mean/median 1 year | 2 per 1000 | 4 per 1000 | RR 1.89 | 20,993 | ⊕⊕⊕⊝ | |
| Stroke | 6 per 1000 | 8 per 1000 | RR 146 | 17,585 | ⊕⊕⊕⊝ | |
| Venous thromboembolism (DVT or PE) Follow‐up: mean/median 1 year | 2 per 1000 | 7 per 1000 | RR 4.28 | 20,993 | ⊕⊕⊕⊝ | |
| Breast cancer | 19 per 1000 | 24 per 1000 | RR 1.27 (1.03 to 1.56) | 16,608 | ⊕⊕⊕⊝ | |
| Death from lung cancer Follow‐up: median 8 yearsb | 5 per 1,000 | 9 per 1000 (6 to 13) | RR 1.74 (1.18 to 2.55) | 16,608 | ⊕⊕⊕⊝ | |
| Gallbladder disease Follow‐up: mean 5.6 years | 16 per 1000 | 27 per 1000 (21 to 34) | RR 1.64 (1.30 to 2.06) | 14,203 (1 study) | ⊕⊕⊕⊝ | |
| All clinical fractures | 111 per 1000 | 87 per 1000 | RR 0.78 | 16,608 | ⊕⊕⊕⊝ | |
| *The basis for the assumed risk is the mean risk in the control group. The corresponding risk (and its 95% confidence interval) is based on the assumed risk in the comparison group and the relative effect of the intervention (and its 95% CI). | ||||||
| GRADE Working Group grades of evidence. | ||||||
| aDowngraded one level for questionable applicability: Only about 33% of the study sample was 50‐59 years of age at baseline (i.e. the age women are most likely to consider HT for vasomotor symptoms); mean participant age was 63 years. b5.6 years' intervention plus postintervention follow‐up: post hoc analysis. | ||||||
| Oestrogen‐only hormone therapy (HT) compared with placebo for perimenopausal and postmenopausal women | ||||||
| Population: relatively healthy postmenopausal women Setting: community | ||||||
| Outcomes | Illustrative comparative risks* (95% CI) | Relative effect | No. of participants | Quality of the evidence | Comments | |
| Assumed risk | Corresponding risk | |||||
| Placebo | Oestrogen‐only hormone therapy (HT) | |||||
| Coronary events (MI or cardiac death) | 41 per 1000 | 38 per 1000 | RR 0.94 | 10,739 | ⊕⊕⊕⊝ | |
| Stroke | 24 per 1000 | 32 per 1000 | RR 1.33 | 10,739 | ⊕⊕⊕⊝ | |
| Venous thromboembolism (DVT or PE) Follow up 1‐2 years | 2 per 1000 | 5 per 1000 (2 to 10) | RR 2.22 (1.12 to 4.39) | 10,739 | ⊕⊕⊕⊝ | |
| Venous thromboembolism (DVT or PE): CEE 0.625 mg (moderate dose) | 16 per 1000 | 21 per 1000 | RR 1.32 | 10,739 | ⊕⊕⊕⊝ | |
| Breast cancer | 25 per 1000 | 20 per 1000 | RR 0.79 | 10,739 | ⊕⊕⊕⊝ | |
| Gallbladder disease Follow‐up: mean 7.1 yearsa | 27 per 1000 | 47 per 1000 (38 to 60) | RR 1.78 (1.42 to 2.24) | 8376 | ⊕⊕⊕⊝ | |
| All clinical fractures | 141 per 1000 | 103 per 1000 | RR 0.73 | 10,739 | ⊕⊕⊕⊝ | |
| *The basis for the assumed risk is the mean risk in the control group. The corresponding risk (and its 95% confidence interval) is based on the assumed risk in the comparison group and the relative effect of the intervention (and its 95% CI). | ||||||
| GRADE Working Group grades of evidence. | ||||||
| aMedian use of CEE 5.9 years (LaCroix 2011). | ||||||
| Study | How defined | Assessment | HT group | Placebo group | Note |
| Discontinuation of therapy for longer than a month (or use of HT in placebo group) | Not stated | 41.1% compliant for whole follow‐up period (median 3 years) | 50.1% compliant for whole follow‐up period (median 3 years) | ||
| > 80% of prescribed treatment taken | Pill counts | Median > 98% over median of 5 years | Median > 98% over median of 5 years | ||
| Percentage of study medication consumed | Pill counts | Level of adherence 95% in the 87% of participants evaluated | Level of adherence 92% in the 92% of participants evaluated | ||
| > 80% of prescribed treatment taken | Number of collected and returned drugs and clinic reports | < 40% compliant at 3 years (estimated from graph) | < 30% compliant at 3 years (estimated from graph) | ||
| Percentage of study medication taken | Pill counts | Level of adherence at 3.2 years: Women on combined HRT, measured in 82% of participants only: 84% | Level of adherence at 3.2 years: | ||
| "Regular tablet use" | Self‐report to family doctor. Self‐report to study nurse at 6 weeks and whenever in contact with trial staff | Number non‐adherent: | Number non‐adherent: | Triallists attribute higher non‐compliance in HRT group to prevalence of vaginal bleeding (reported by 56% in HRT group, 7% in controls) | |
| Adherence not described | |||||
| Adherence not described | |||||
| "Taking at least 80% of medication for at least 80% of entire study period" | Pill counts 6‐monthly | 90% adherent at 3 years | 94% adherent at 3 years | ||
| Taking at least 80% of study medication | Pill counts | 79% adherent at 1 year | 91% adherent at 1 year | Proportion of women who reported taking study medication at 1 year: | |
| Pill or patch counts, percentage used | Pill counts or weights | 94%‐95% in all groups, among women who completed trial at 4 years | |||
| Taking at least 80% of study medication | Plasma oestradiol level evaluation at each visit | No information given in publication | |||
| Adherence not described | |||||
| Adherence not described | |||||
| Adherence not described | |||||
| Taking at least 80% of study medication | Study diary reviewed at clinic visits | Number adherent at 36 months: Women with uterus: | Number adherent at 36 months: Women with uterus: 76% | ||
| Taking at least 80% of study medication | Pill counts weekly | No information given in publication | |||
| Percentage of study medication taken | Pill counts | At 2.8 years: | At 2.8 years: | ||
| Percentage of study medication taken | Self‐report to study nurse 3‐monthly | At 2.8 years: Mean adherence excluding dropouts: 90% | At 2.8 years: Mean adherence excluding dropouts: 90% 24% discontinued medication | ||
| WHI 1998 (unopposed oestrogen arm) | Taking at least 80% of study medication. Temporary discontinuation (e.g. during surgery) permitted | Weighing of returned medication bottles | At 6.8 years, about 53.8% of women were non‐adherent | At 6.8 years, about 53.8% of women were non‐adherent | |
| WHI 1998 (combined arm) | Taking at least 80% of study medication. Temporary discontinuation (e.g. during surgery) permitted | Weighing of returned medication bottles | 42% non‐adherent by 5.2 years | 10.7% crossed to active treatment by 5.2 years | Analyses censoring events 6 months after non‐adherence increased effect sizes |
| Supply of study medication | Time at risk minus temporary interruptions and time after withdrawal from treatment | 73% of time | 86% of time | Women had a 3 month run‐in period on placebo. Only women who took 80% of tablets were randomised | |
| Supply of study medication | Patch counts: 75% use over 2 years counted as compliance | 84% | 84% of time | Women had a 1 week run‐in period. Only compliant women were randomised. |
| Study | Comparison | Instrument | Measure | Outcome | Intervention | Effect |
| Oestrogen (CEE or oestradiol) + cyclic oral micronised progesterone 200 mg/d × 12 days per month vs placebo (n = 275) for 48 months | Modified Mini Mental State Examination (MMSE) | Differences between intervention and placebo groups in mean rate of change over time | Global cognition | 0.45 mg/d oral CEE (n = 230) | P = 0.178 | |
| 0.05 mg/d transdermal oestradiol (n = 222) | P = 0.840 |
| Outcome or subgroup title | No. of studies | No. of participants | Statistical method | Effect size |
| 1 Death from any cause: oestrogen‐only HT Show forest plot | 2 | Risk Ratio (M‐H, Fixed, 95% CI) | Subtotals only | |
| 1.1 Oestradiol 1 mg (low dose) for 2 years | 1 | 222 | Risk Ratio (M‐H, Fixed, 95% CI) | 0.33 [0.01, 8.10] |
| 1.2 CEE 0.625 mg (mod dose) for 7.1 years | 1 | 10739 | Risk Ratio (M‐H, Fixed, 95% CI) | 1.03 [0.88, 1.20] |
| 1.3 CEE 0.625 mg (mod dose) for 10.7 years (includes extra follow‐up) | 1 | 10739 | Risk Ratio (M‐H, Fixed, 95% CI) | 1.02 [0.91, 1.13] |
| 2 Death from any cause: combined HT Show forest plot | 5 | Risk Ratio (M‐H, Fixed, 95% CI) | Subtotals only | |
| 2.1 CEE 0.625 mg (mod dose) + MPA 2.5 mg for mean/median 1 year | 2 | 20993 | Risk Ratio (M‐H, Fixed, 95% CI) | 1.31 [0.76, 2.27] |
| 2.2 CEE 0.625 mg (mod dose) + MPA 2.5 mg for 2 years | 1 | 16608 | Risk Ratio (M‐H, Fixed, 95% CI) | 1.05 [0.71, 1.56] |
| 2.3 CEE 0.625 mg (mod dose) + P (as per footnotes) for 3 years | 3 | 18075 | Risk Ratio (M‐H, Fixed, 95% CI) | 1.09 [0.81, 1.46] |
| 2.4 CEE 0.045 mg (lowish dose) + 200 mg sequential progesterone for 4 years | 1 | 505 | Risk Ratio (M‐H, Fixed, 95% CI) | 3.58 [0.15, 87.57] |
| 2.5 CEE 0.625 mg (mod dose) + MPA 2.5 mg for 5.6 years | 1 | 16608 | Risk Ratio (M‐H, Fixed, 95% CI) | 1.00 [0.84, 1.19] |
| 2.6 CEE 0.625 mg (mod dose) + MPA 2.5 mg for 7.9 years | 1 | 16608 | Risk Ratio (M‐H, Fixed, 95% CI) | 1.06 [0.93, 1.20] |
| 2.7 CEE 0.625 mg (mod dose) + MPA 2.5 mg after 13.2 years (includes extended follow‐up) | 1 | 16608 | Risk Ratio (M‐H, Fixed, 95% CI) | 1.00 [0.92, 1.08] |
| 3 Death from any cause: oestrogen with or without sequential progesterone vaginal gel Show forest plot | 1 | Risk Ratio (M‐H, Fixed, 95% CI) | Subtotals only | |
| 3.1 Oestradiol 1 mg daily, with or without cyclic 4% vaginal progesterone gel | 1 | 643 | Risk Ratio (M‐H, Fixed, 95% CI) | 0.99 [0.06, 15.77] |
| 4 Death from coronary heart disease: oestrogen‐only HT Show forest plot | 2 | Risk Ratio (M‐H, Fixed, 95% CI) | Subtotals only | |
| 4.1 Oestradiol 1 mg (low dose) daily for 2 years | 1 | 222 | Risk Ratio (M‐H, Fixed, 95% CI) | 0.33 [0.01, 8.10] |
| 4.2 CEE 0.625 mg (mod dose) for 7.1 years | 1 | 10739 | Risk Ratio (M‐H, Fixed, 95% CI) | 0.98 [0.69, 1.38] |
| 4.3 CEE 0.625 mg (mod dose) after 10.7 years (includes extra follow‐up) | 1 | 10739 | Risk Ratio (M‐H, Fixed, 95% CI) | 0.92 [0.71, 1.19] |
| 5 Death from coronary heart disease: combined continuous HT Show forest plot | 1 | Risk Ratio (M‐H, Fixed, 95% CI) | Subtotals only | |
| 5.1 CEE 0.625 mg (mod dose) + MPA 2.5 mg for mean 5.6 years | 1 | 16608 | Risk Ratio (M‐H, Fixed, 95% CI) | 1.06 [0.68, 1.66] |
| 5.2 CEE 0.625 mg (mod dose) + MPA 2.5 mg for mean 7.9 years | 1 | 16608 | Risk Ratio (M‐H, Fixed, 95% CI) | 0.99 [0.72, 1.38] |
| 6 Death from coronary heart disease: combined sequential HT Show forest plot | 1 | Risk Ratio (M‐H, Fixed, 95% CI) | Subtotals only | |
| 6.1 1 mg 17‐B‐oestradiol (low dose) daily plus (3 days weekly) 0.35 mg norethindrone for 2 years | 1 | 142 | Risk Ratio (M‐H, Fixed, 95% CI) | 0.34 [0.01, 8.27] |
| 7 Death from stroke: oestrogen‐only HT Show forest plot | 1 | Risk Ratio (M‐H, Fixed, 95% CI) | Subtotals only | |
| 7.1 CEE 0.625 mg (low dose) for 7.1 years | 1 | 10739 | Risk Ratio (M‐H, Fixed, 95% CI) | 1.16 [0.58, 2.32] |
| 8 Death from stroke: combined sequential HT Show forest plot | 1 | Risk Ratio (M‐H, Fixed, 95% CI) | Subtotals only | |
| 8.1 1 mg 17‐B‐oestradiol (low dose) daily plus (3 days weekly) 0.35 mg norethindrone for 2 years | 1 | 142 | Risk Ratio (M‐H, Fixed, 95% CI) | 3.08 [0.13, 74.46] |
| 9 Death from stroke: combined continuous HT Show forest plot | 2 | Risk Ratio (M‐H, Fixed, 95% CI) | Subtotals only | |
| 9.1 CEE 0.625 mg (mod dose) + MPA 2.5 mg for median 1 year | 1 | 4385 | Risk Ratio (M‐H, Fixed, 95% CI) | 2.99 [0.12, 73.37] |
| 9.2 CEE 0.625 mg (mod dose) + MPA 2.5 mg for mean 5.6 years | 1 | 16608 | Risk Ratio (M‐H, Fixed, 95% CI) | 1.04 [0.46, 2.35] |
| 10 Death from colorectal cancer: oestrogen‐only HT Show forest plot | 1 | Risk Ratio (M‐H, Fixed, 95% CI) | Subtotals only | |
| 10.1 CEE 0.625 mg (mod dose) for 7.1 years | 1 | 10739 | Risk Ratio (M‐H, Fixed, 95% CI) | 1.28 [0.66, 2.46] |
| 11 Death from breast cancer: combined continuous HT Show forest plot | 1 | Risk Ratio (M‐H, Fixed, 95% CI) | Subtotals only | |
| 12 Death from breast cancer: oestrogen‐only HT Show forest plot | 1 | Risk Ratio (M‐H, Fixed, 95% CI) | Subtotals only | |
| 12.1 CEE 0.625 mg (mod dose) after median 11.8 years (includes extra follow‐up) | 1 | 10739 | Risk Ratio (M‐H, Fixed, 95% CI) | 0.38 [0.15, 0.98] |
| 13 Death from colorectal cancer: combined continuous HT Show forest plot | 1 | Risk Ratio (M‐H, Fixed, 95% CI) | Subtotals only | |
| 13.1 CEE 0.625 mg (mod dose) + MPA 2.5 mg for mean 5.6 years | 1 | 16608 | Risk Ratio (M‐H, Fixed, 95% CI) | 0.95 [0.40, 2.29] |
| 13.2 CEE 0.625 mg (mod dose) + MPA 2.5 mg for 7.1 years | 1 | 16608 | Risk Ratio (M‐H, Fixed, 95% CI) | 1.01 [0.52, 1.96] |
| 13.3 CEE 0.0625 mg (mod dose) + MPA 2.5 mg after 11.6 years | 1 | 16608 | Risk Ratio (M‐H, Fixed, 95% CI) | 1.31 [0.80, 2.14] |
| 14 Death from lung cancer: oestrogen‐only HT (moderate dose) Show forest plot | 1 | Risk Ratio (M‐H, Fixed, 95% CI) | Subtotals only | |
| 14.1 Death from lung cancer (non‐small cell or small cell) | 1 | 10739 | Risk Ratio (M‐H, Fixed, 95% CI) | 1.05 [0.65, 1.70] |
| 14.2 Death from non‐small cell lung cancer | 1 | 10739 | Risk Ratio (M‐H, Fixed, 95% CI) | 0.88 [0.52, 1.50] |
| 14.3 Death from small cell lung cancer | 1 | 10739 | Risk Ratio (M‐H, Fixed, 95% CI) | 2.04 [0.62, 6.79] |
| 15 Death from lung cancer: combined continuous HT (moderate dose) Show forest plot | 1 | Risk Ratio (M‐H, Fixed, 95% CI) | Subtotals only | |
| 15.1 Death from lung cancer (non‐small cell or small cell) at mean 7.9 years | 1 | 16608 | Risk Ratio (M‐H, Fixed, 95% CI) | 1.74 [1.18, 2.55] |
| 15.2 Death from non‐small cell lung cancer at mean 7.9 years | 1 | 16608 | Risk Ratio (M‐H, Fixed, 95% CI) | 1.91 [1.24, 2.93] |
| 15.3 Death from small cell lung cancer at mean 7.9 years | 1 | 16608 | Risk Ratio (M‐H, Fixed, 95% CI) | 1.16 [0.48, 2.81] |
| 15.4 Death from lung cancer (any type) at median 14 years | 1 | 16608 | Risk Ratio (M‐H, Fixed, 95% CI) | 1.10 [0.88, 1.39] |
| 16 Death from lung cancer: combined sequential HT (low dose oestrogen) Show forest plot | 1 | Risk Ratio (M‐H, Fixed, 95% CI) | Subtotals only | |
| 16.1 1 mg 17‐B‐oestradiol (low dose) daily plus (3 days weekly) 0.35 mg norethindrone for 2 years | 1 | 142 | Risk Ratio (M‐H, Fixed, 95% CI) | 3.08 [0.13, 74.46] |
| 17 Death from any cancer: combined continuous HT Show forest plot | 2 | Risk Ratio (M‐H, Fixed, 95% CI) | Subtotals only | |
| 17.1 CEE O.625 mg daily (mod dose) + MPA 2.5 mg for 3 years | 1 | 777 | Risk Ratio (M‐H, Fixed, 95% CI) | 2.77 [0.11, 67.80] |
| 17.2 CEE 0.625 mg daily (mod dose) + MPA 2.5 mg for mean 5.2 years | 1 | 16608 | Risk Ratio (M‐H, Fixed, 95% CI) | 1.16 [0.87, 1.53] |
| 18 Coronary events (MI or cardiac death): oestrogen‐only HT Show forest plot | 3 | Risk Ratio (M‐H, Fixed, 95% CI) | Subtotals only | |
| 18.1 Oestradiol 1 mg (low dose) for 2 years | 1 | 222 | Risk Ratio (M‐H, Fixed, 95% CI) | 0.5 [0.05, 5.43] |
| 18.2 CEE 0.625 mg (mod dose) for 3 years | 1 | 349 | Risk Ratio (M‐H, Fixed, 95% CI) | 2.98 [0.12, 72.72] |
| 18.3 CEE 0.625 mg (mod dose) for mean 7.1 years | 1 | 10739 | Risk Ratio (M‐H, Fixed, 95% CI) | 0.94 [0.78, 1.13] |
| 18.4 CEE 0.65 (mod dose) for 10.7 years (includes extra follow‐up) | 1 | 10739 | Risk Ratio (M‐H, Fixed, 95% CI) | 0.95 [0.82, 1.10] |
| 19 Coronary events (MI or cardiac death): combined continuous HT Show forest plot | 3 | Risk Ratio (M‐H, Fixed, 95% CI) | Subtotals only | |
| 19.1 CEE 0.625 mg (mod dose) + MPA 2.5 mg for mean/median 1 year | 2 | 20993 | Risk Ratio (M‐H, Fixed, 95% CI) | 1.89 [1.15, 3.10] |
| 19.2 CEE 0.625 mg (mod dose) + MPA 2.5 mg for 2 years | 1 | 16608 | Risk Ratio (M‐H, Fixed, 95% CI) | 1.49 [1.05, 2.12] |
| 19.3 CEE 0.625 mg (mod dose) + MPA 2.5 mg for 3 years | 2 | 17385 | Risk Ratio (M‐H, Fixed, 95% CI) | 1.45 [1.07, 1.98] |
| 19.4 CEE 0.625 mg (mod dose) + MPA 2.5 mg for mean 5.6 years | 1 | 16608 | Risk Ratio (M‐H, Fixed, 95% CI) | 1.17 [0.95, 1.44] |
| 19.5 CEE 0.625 mg (mod dose) + MPA 2.5 mg after 13.2 years (includes extended follow‐up) | 1 | 16608 | Risk Ratio (M‐H, Fixed, 95% CI) | 1.08 [0.95, 1.22] |
| 20 Coronary events (MI or cardiac death): combined sequential HT Show forest plot | 3 | Risk Ratio (M‐H, Fixed, 95% CI) | Subtotals only | |
| 20.1 CEE 0.625 mg (mod dose) daily + micronised progesterone 200 mg days 1‐12 for 3 years | 1 | 352 | Risk Ratio (M‐H, Fixed, 95% CI) | 4.89 [0.24, 101.09] |
| 20.2 1 mg (low dose) 17‐B‐oestradiol daily plus (3 days weekly) 0.35 mg norethindrone for 2 years | 1 | 142 | Risk Ratio (M‐H, Fixed, 95% CI) | 0.34 [0.01, 8.27] |
| 20.3 Oestradiol patch 0.05 mg (mod dose) + 200 mg sequential progesterone for 4 years | 1 | 497 | Risk Ratio (M‐H, Fixed, 95% CI) | 3.71 [0.15, 90.70] |
| 21 Coronary events (MI or cardiac death): oestrogen with or without sequential progesterone vaginal gel Show forest plot | 1 | Risk Ratio (M‐H, Fixed, 95% CI) | Subtotals only | |
| 21.1 Oestradiol 1 mg daily, with or without cyclic 4% vaginal progesterone gel | 1 | 643 | Risk Ratio (M‐H, Fixed, 95% CI) | 0.33 [0.03, 3.16] |
| 22 Stroke: unopposed oestrogen Show forest plot | 2 | Risk Ratio (M‐H, Fixed, 95% CI) | Subtotals only | |
| 22.1 Oestradiol 1 mg (low dose) for 2 years | 1 | 222 | Risk Ratio (M‐H, Fixed, 95% CI) | 3.0 [0.12, 72.86] |
| 22.2 CEE 0.625 mg (mod dose) for mean 7.1 years | 1 | 10739 | Risk Ratio (M‐H, Fixed, 95% CI) | 1.33 [1.06, 1.67] |
| 22.3 CEE 0.625 mg (mod dose) for 10.7 years (includes extra follow‐up) | 1 | 10739 | Risk Ratio (M‐H, Fixed, 95% CI) | 1.17 [0.97, 1.40] |
| 23 Stroke: combined continuous HT Show forest plot | 2 | Risk Ratio (M‐H, Fixed, 95% CI) | Subtotals only | |
| 23.1 CEE 0.625 mg (mod dose) + MPA 2.5 mg for 1 year | 1 | 16608 | Risk Ratio (M‐H, Fixed, 95% CI) | 0.95 [0.49, 1.86] |
| 23.2 CEE 0.625 mg (mod dose) + MPA 2.5 mg for 2 years | 1 | 16608 | Risk Ratio (M‐H, Fixed, 95% CI) | 1.31 [0.83, 2.06] |
| 23.3 CEE 0.625 mg (mod dose) + MPA 2.5 mg for 3 years | 2 | 17385 | Risk Ratio (M‐H, Fixed, 95% CI) | 1.46 [1.02, 2.09] |
| 23.4 CEE 0.625 mg (mod dose) + MPA 2.5 mg for mean 5.6 years | 1 | 16608 | Risk Ratio (M‐H, Fixed, 95% CI) | 1.39 [1.09, 1.77] |
| 23.5 CEE 0.625 mg (mod dose) + MPA 2.5 mg for mean 7.9 years | 1 | 16608 | Risk Ratio (M‐H, Fixed, 95% CI) | 1.29 [1.06, 1.56] |
| 23.6 CEE 0.625 mg (mod dose) + MPA 2.5 mg after 13.2 years (includes extended follow‐up) | 1 | 16608 | Risk Ratio (M‐H, Fixed, 95% CI) | 1.15 [0.99, 1.33] |
| 24 Stroke: combined sequential HT Show forest plot | 2 | Risk Ratio (M‐H, Fixed, 95% CI) | Subtotals only | |
| 24.1 1 mg (low dose) 17‐B‐oestradiol daily plus (3 days weekly) 0.35 mg norethindrone for 2 years | 1 | 142 | Risk Ratio (M‐H, Fixed, 95% CI) | 3.08 [0.13, 74.46] |
| 24.2 CEE 0.625 mg (mod dose) daily + MPA 10 mg days 1‐12 for 3 years | 1 | 348 | Risk Ratio (M‐H, Fixed, 95% CI) | 3.0 [0.12, 73.14] |
| 25 Stroke: combined sequential HT Show forest plot | 1 | Risk Ratio (M‐H, Fixed, 95% CI) | Subtotals only | |
| 25.1 CEE 0.625 mg (mod dose) daily + micronised progesterone 200 mg days 1‐12 for 3 years | 1 | 352 | Risk Ratio (M‐H, Fixed, 95% CI) | 2.93 [0.12, 71.51] |
| 26 Transient ischaemic attack: oestrogen‐only HT Show forest plot | 1 | Risk Ratio (M‐H, Fixed, 95% CI) | Subtotals only | |
| 26.1 Oestradiol 1 mg (low dose) for 2 years | 1 | 222 | Risk Ratio (M‐H, Fixed, 95% CI) | 3.0 [0.12, 72.86] |
| 27 Transient ischaemic attack: combined sequential HT Show forest plot | 2 | Risk Ratio (M‐H, Fixed, 95% CI) | Subtotals only | |
| 27.1 1 mg 17‐B‐oestradiol (low dose) daily plus (3 days weekly) 0.35 mg norethindrone for 2 years | 1 | 142 | Risk Ratio (M‐H, Fixed, 95% CI) | 1.03 [0.07, 16.13] |
| 27.2 CEE 0.625 mg (mod dose) daily + MPA 10 mg days 1‐12 for 3 years | 1 | 348 | Risk Ratio (M‐H, Fixed, 95% CI) | 3.0 [0.12, 73.14] |
| 28 Transient ischaemic attack: oestrogen with or without sequential progesterone vaginal gel Show forest plot | 1 | Risk Ratio (M‐H, Fixed, 95% CI) | Subtotals only | |
| 28.1 Oestradiol 1 mg daily,with or without cyclic 4% vaginal progesterone gel | 1 | 643 | Risk Ratio (M‐H, Fixed, 95% CI) | 0.50 [0.05, 5.44] |
| 29 Stroke or transient ischaemic attack Show forest plot | 1 | Risk Ratio (M‐H, Fixed, 95% CI) | Subtotals only | |
| 29.1 CEE 0.625 mg (mod dose) + MPA 2.5 mg for mean/median 1 year | 1 | 4385 | Risk Ratio (M‐H, Fixed, 95% CI) | 0.73 [0.37, 1.46] |
| 30 Venous thromboembolism (DVT or PE): oestrogen‐only HT Show forest plot | 2 | Risk Ratio (M‐H, Fixed, 95% CI) | Subtotals only | |
| 30.1 CEE 0.625 mg (mod dose) for up to 2 years | 1 | 10739 | Risk Ratio (M‐H, Fixed, 95% CI) | 2.22 [1.12, 4.39] |
| 30.2 CEE 0.625 mg (mod dose) for 3 years | 1 | 349 | Risk Ratio (M‐H, Fixed, 95% CI) | 6.96 [0.36, 133.75] |
| 30.3 CEE 0.625 mg (mod dose) for 7.1 years | 1 | 10739 | Risk Ratio (M‐H, Fixed, 95% CI) | 1.32 [1.00, 1.74] |
| 30.4 CEE 0.625 mg (mod dose) for 10.7 years (includes extra follow‐up) | 1 | 10739 | Risk Ratio (M‐H, Fixed, 95% CI) | 1.04 [0.84, 1.29] |
| 31 Venous thromboembolism (DVT or PE): combined sequential HT Show forest plot | 3 | Risk Ratio (M‐H, Fixed, 95% CI) | Subtotals only | |
| 31.1 1 mg 17‐B‐oestradiol (low dose) daily plus (3 days weekly) 0.35 mg norethindrone for 2 years | 1 | 142 | Risk Ratio (M‐H, Fixed, 95% CI) | 3.08 [0.13, 74.46] |
| 31.2 CEE 0.625 mg (mod dose) daily + MPA 10 mg days 1‐12 for 3 years | 1 | 348 | Risk Ratio (M‐H, Fixed, 95% CI) | 3.0 [0.12, 73.14] |
| 31.3 CEE 0.045 mg (lowish dose) + 200 mg sequential progesterone for 4 years | 1 | 505 | Risk Ratio (M‐H, Fixed, 95% CI) | 0.40 [0.02, 9.73] |
| 31.4 Oestradiol patch 0.05 mg (mod dose) + 200 mg sequential progesterone for 4 years | 1 | 497 | Risk Ratio (M‐H, Fixed, 95% CI) | 1.24 [0.08, 19.69] |
| 32 Venous thromboembolism (DVT or PE): combined continuous HT Show forest plot | 2 | Risk Ratio (M‐H, Fixed, 95% CI) | Subtotals only | |
| 32.1 CEE 0.625 mg (mod dose) + MPA 2.5 mg for mean/median 1 year | 2 | 20993 | Risk Ratio (M‐H, Fixed, 95% CI) | 4.28 [2.49, 7.34] |
| 32.2 CEE 0.625 mg (mod dose) + MPA 2.5 mg for 2 years | 1 | 16608 | Risk Ratio (M‐H, Fixed, 95% CI) | 2.98 [1.88, 4.71] |
| 32.3 CEE 0.625 mg (mod dose) + MPA 2.5 mg for 3 years | 1 | 16608 | Risk Ratio (M‐H, Fixed, 95% CI) | 2.54 [1.73, 3.72] |
| 32.4 CEE 0.625 mg (mod dose) + MPA 2.5 mg for mean 5.6 years | 1 | 16608 | Risk Ratio (M‐H, Fixed, 95% CI) | 2.03 [1.55, 2.64] |
| 32.5 CEE 0.625 mg (mod dose) + 2.5 mg MPA for mean 7.9 years | 1 | 16707 | Risk Ratio (M‐H, Fixed, 95% CI) | 1.65 [1.32, 2.05] |
| 33 Venous thromboembolism (DVT or PE): oestrogen with or without sequential progesterone vaginal gel Show forest plot | 1 | Risk Ratio (M‐H, Random, 95% CI) | Subtotals only | |
| 33.1 Oestradiol 1 mg daily, with or without cyclic 4% vaginal progesterone gel | 1 | 643 | Risk Ratio (M‐H, Random, 95% CI) | 1.49 [0.25, 8.83] |
| 34 Global cognitive function Show forest plot | 4 | Mean Difference (Fixed, 95% CI) | Subtotals only | |
| 34.1 Transdermal estradiol 0.014 mg (low dose): MMSE scores (baseline MMSE ≤ 90) | 1 | Mean Difference (Fixed, 95% CI) | ‐1.21 [‐5.05, 2.63] | |
| 34.2 Transdermal estradiol 0.014 mg (low dose): MMSE scores (baseline MMSE > 90) | 1 | Mean Difference (Fixed, 95% CI) | ‐0.3 [‐0.73, 0.13] | |
| 34.3 CEE 0.625 mg (mod dose) with or without 2.5 mg MPA for 3 years: MMSE scores | 1 | Mean Difference (Fixed, 95% CI) | ‐0.1 [‐0.35, 0.15] | |
| 34.4 CEE 0.625 mg (mod dose) for mean 5.2 years: MMSE scores | 1 | Mean Difference (Fixed, 95% CI) | ‐0.26 [‐0.52, 0.00] | |
| 34.5 Combined continuous CEE 0.625 mg (mod dose) + MPA 2.5 mg for mean 4.2 years: MMSE scores | 1 | Mean Difference (Fixed, 95% CI) | ‐0.18 [‐0.36, 0.00] | |
| 34.6 Oestrogen with or without sequential progesterone vaginal gel | 1 | Mean Difference (Fixed, 95% CI) | ‐0.03 [‐0.21, 0.15] | |
| 35 Probable dementia Show forest plot | 1 | Risk Ratio (M‐H, Fixed, 95% CI) | Subtotals only | |
| 35.1 CEE 0.625 mg (mod dose) for 5.2 years | 1 | 2947 | Risk Ratio (M‐H, Fixed, 95% CI) | 1.52 [0.89, 2.59] |
| 35.2 Combined continuous CEE 0.625 mg (mod dose) + MPA 2.5 mg for mean 4.05 years | 1 | 4532 | Risk Ratio (M‐H, Fixed, 95% CI) | 1.97 [1.16, 3.33] |
| Outcome or subgroup title | No. of studies | No. of participants | Statistical method | Effect size |
| 1 Death from any cause: oestrogen‐only HT Show forest plot | 3 | Risk Ratio (M‐H, Fixed, 95% CI) | Subtotals only | |
| 1.1 CEE 0.625 mg (mod dose) daily for 3 years (2.8‐3.2) | 2 | 327 | Risk Ratio (M‐H, Fixed, 95% CI) | 1.31 [0.53, 3.22] |
| 1.2 Oestradiol valerate 2 mg (mod dose) for 2 years | 1 | 1017 | Risk Ratio (M‐H, Fixed, 95% CI) | 0.81 [0.51, 1.27] |
| 2 Death from any cause: oestrogen‐only or combined sequential HT Show forest plot | 1 | Risk Ratio (M‐H, Fixed, 95% CI) | Subtotals only | |
| 2.1 Oestradiol 1 mg (low dose) daily (if no uterus) plus MPA 5 mg for 12 days a year (if uterus intact) for 2.8 years | 1 | 664 | Risk Ratio (M‐H, Fixed, 95% CI) | 1.14 [0.77, 1.67] |
| 3 Death from any cause: combined continuous HT Show forest plot | 3 | Risk Ratio (M‐H, Fixed, 95% CI) | Subtotals only | |
| 3.1 CEE 0.625 mg (mod dose) + MPA 2.5 mg for 2.8‐3.2 years | 2 | 297 | Risk Ratio (M‐H, Fixed, 95% CI) | 0.86 [0.28, 2.62] |
| 3.2 CEE 0.625 mg (mod dose) + MPA 2.5 mg for 4 years | 1 | 2763 | Risk Ratio (M‐H, Fixed, 95% CI) | 1.06 [0.84, 1.34] |
| 3.3 CEE 0.625 mg (mod dose) + MPA 2.5 mg for 4‐7 years UNBLINDED | 1 | 2321 | Risk Ratio (M‐H, Fixed, 95% CI) | 1.14 [0.90, 1.44] |
| 4 Death from coronary heart disease: oestrogen‐only HT Show forest plot | 3 | Risk Ratio (M‐H, Fixed, 95% CI) | Subtotals only | |
| 4.1 CEE 0.625 mg (mod dose) daily for 2.8‐3.2 years | 2 | 327 | Risk Ratio (M‐H, Fixed, 95% CI) | 1.31 [0.36, 4.77] |
| 4.2 Oestradiol valerate 2 mg (mod dose) for 2 years | 1 | 1017 | Risk Ratio (M‐H, Fixed, 95% CI) | 0.69 [0.40, 1.18] |
| 5 Death from CHD: oestrogen‐only or combined sequential HT Show forest plot | 1 | Risk Ratio (M‐H, Fixed, 95% CI) | Subtotals only | |
| 5.1 Oestradiol 1 mg (low dose) daily (if no uterus) plus MPA 5 mg for 12 days a year (if uterus intact) for 2.8 years | 1 | 664 | Risk Ratio (M‐H, Fixed, 95% CI) | 0.82 [0.37, 1.81] |
| 6 Death from CHD: combined continuous HT Show forest plot | 3 | Risk Ratio (M‐H, Fixed, 95% CI) | Subtotals only | |
| 6.1 CEE 0.625 mg (mod dose) daily + MPA 2.5 mg for 1 year | 1 | 2763 | Risk Ratio (M‐H, Fixed, 95% CI) | 1.55 [0.73, 3.29] |
| 6.2 CEE 0.625 mg (mod dose) daily + MPA 2.5 mg for 2 years | 1 | 2763 | Risk Ratio (M‐H, Fixed, 95% CI) | 1.50 [0.90, 2.51] |
| 6.3 CEE 0.625 mg (mod dose) daily + MPA 2.5 mg for 3 years (2.8‐3.2) | 3 | 3060 | Risk Ratio (M‐H, Fixed, 95% CI) | 1.30 [0.88, 1.90] |
| 6.4 CEE 0.625 mg (mod dose) daily + MPA 2.5 mg for 4+ years (median 4.1) | 1 | 2763 | Risk Ratio (M‐H, Fixed, 95% CI) | 1.19 [0.85, 1.67] |
| 6.5 CEE 0.625 mg (mod dose) daily + MPA 2.5 mg for 4‐6.8 years | 1 | 2321 | Risk Ratio (M‐H, Fixed, 95% CI) | 0.99 [0.71, 1.39] |
| 7 Coronary event (MI or cardiac death): oestrogen‐only HT Show forest plot | 1 | Risk Ratio (M‐H, Fixed, 95% CI) | Subtotals only | |
| 7.1 Oestradiol valerate 2 mg (mod dose) for 2 years | 1 | 1017 | Risk Ratio (M‐H, Fixed, 95% CI) | 1.00 [0.72, 1.39] |
| 8 Death from stroke: oestrogen‐only or combined sequential HT Show forest plot | 1 | Risk Ratio (M‐H, Fixed, 95% CI) | Subtotals only | |
| 8.1 Oestradiol 1 mg (low dose) daily (if no uterus) plus MPA 5 mg for 12 days a year (if uterus intact) for 2.8 years | 1 | 664 | Risk Ratio (M‐H, Fixed, 95% CI) | 2.91 [0.95, 8.93] |
| 9 Death from cancer: combined continuous HT Show forest plot | 1 | Risk Ratio (M‐H, Fixed, 95% CI) | Subtotals only | |
| 9.1 CEE 0.625 mg daily (mod dose) + MPA 2.5 mg for 4+ years (median 4.1) | 1 | 2763 | Risk Ratio (M‐H, Fixed, 95% CI) | 0.88 [0.49, 1.57] |
| 9.2 CEE 0.625 mg daily (mod dose) + MPA 2.5 mg for 4‐6.8 years UNBLINDED | 1 | 2321 | Risk Ratio (M‐H, Fixed, 95% CI) | 1.51 [0.86, 2.65] |
| 10 Coronary event (MI or cardiac death): oestrogen‐only HT Show forest plot | 2 | Risk Ratio (M‐H, Fixed, 95% CI) | Subtotals only | |
| 10.1 CEE 0.625 (mod dose) daily for 2.8‐3.2 years | 2 | 327 | Risk Ratio (M‐H, Fixed, 95% CI) | 1.13 [0.54, 2.40] |
| 11 Coronary event: oestrogen‐only or combined sequential HT Show forest plot | 1 | Risk Ratio (M‐H, Fixed, 95% CI) | Subtotals only | |
| 11.1 Oestradiol 1 mg (low dose) daily (if no uterus) plus MPA 5 mg for 12 days a year (if uterus intact) for 2.8 years | 1 | 664 | Risk Ratio (M‐H, Fixed, 95% CI) | 0.97 [0.57, 1.65] |
| 12 Coronary event (MI or cardiac death): combined continuous HT Show forest plot | 3 | Risk Ratio (M‐H, Fixed, 95% CI) | Subtotals only | |
| 12.1 CEE 0.625 mg (mod dose) + MPA 2.5 mg for 1 year | 1 | 2763 | Risk Ratio (M‐H, Fixed, 95% CI) | 1.50 [1.00, 2.25] |
| 12.2 CEE 0.625 mg (mod dose) + MPA 2.5 mg for 2 years | 1 | 2763 | Risk Ratio (M‐H, Fixed, 95% CI) | 1.20 [0.91, 1.58] |
| 12.3 CEE 0.625 mg (mod dose) + MPA 2.5 mg for 3 years (2.8‐3.2) | 3 | 3060 | Risk Ratio (M‐H, Fixed, 95% CI) | 1.07 [0.86, 1.33] |
| 12.4 CEE 0.625 mg (mod dose) + MPA 2.5 mg for median 4.1 years | 1 | 2763 | Risk Ratio (M‐H, Fixed, 95% CI) | 0.99 [0.81, 1.19] |
| 12.5 CEE 0.625 mg (mod dose) + MPA 2.5 mg for 4‐6.8 years UNBLINDED | 1 | 2321 | Risk Ratio (M‐H, Fixed, 95% CI) | 1.01 [0.78, 1.29] |
| 13 Stroke (first or recurrent): oestrogen‐only HT or combined sequential Show forest plot | 1 | Risk Ratio (M‐H, Fixed, 95% CI) | Subtotals only | |
| 13.1 Oestradiol 1 mg daily (low dose) (if no uterus) plus MPA 5 mg for 12 days a year (if uterus intact) for 2.8 years | 1 | 664 | Risk Ratio (M‐H, Fixed, 95% CI) | 1.09 [0.79, 1.51] |
| 14 Stroke (first or recurrent): oestrogen‐only HT (mod dose) Show forest plot | 2 | Risk Ratio (M‐H, Fixed, 95% CI) | Subtotals only | |
| 14.1 CEE 0.625 mg (mod dose) daily for 2.8 years | 1 | 122 | Risk Ratio (M‐H, Fixed, 95% CI) | 0.69 [0.12, 3.98] |
| 14.2 Oestradiol valerate 2 mg (mod dose) for 2 years | 1 | 1017 | Risk Ratio (M‐H, Fixed, 95% CI) | 1.64 [0.60, 4.47] |
| 15 Stroke (first or recurrent): combined continuous HT (mod dose oestrogen) Show forest plot | 3 | Risk Ratio (M‐H, Fixed, 95% CI) | Subtotals only | |
| 15.1 Continuous oestradiol 2 mg (mod dose) + norethisterone acetate 1 mg for 1.3 years | 1 | 140 | Risk Ratio (M‐H, Fixed, 95% CI) | 0.32 [0.01, 7.82] |
| 15.2 CEE 0.625 mg (mod dose) + MPA for 2.8 years | 1 | 88 | Risk Ratio (M‐H, Fixed, 95% CI) | 5.23 [0.26, 105.85] |
| 15.3 CEE 0.625 mg (mod dose) + MPA 2.5 mg for median 4.1 years | 1 | 2763 | Risk Ratio (M‐H, Fixed, 95% CI) | 1.23 [0.90, 1.68] |
| 15.4 CEE 0.625 mg (mod dose) + MPA for 4‐6.8 years UNBLINDED | 1 | 2321 | Risk Ratio (M‐H, Fixed, 95% CI) | 1.05 [0.71, 1.57] |
| 16 Transient ischaemic attack: oestrogen‐only HT (mod dose) Show forest plot | 1 | Risk Ratio (M‐H, Fixed, 95% CI) | Subtotals only | |
| 16.1 Oestradiol valerate 2 mg (mod dose) for 2 years | 1 | 1017 | Risk Ratio (M‐H, Fixed, 95% CI) | 1.13 [0.54, 2.36] |
| 17 Transient ischaemic attack: oestrogen‐only or combined sequential HT Show forest plot | 1 | Risk Ratio (M‐H, Fixed, 95% CI) | Subtotals only | |
| 17.1 Oestradiol 1 mg (low dose) daily (if no uterus) plus MPA 5 mg for 12 days a year (if uterus intact) for 2.8 years | 1 | 664 | Risk Ratio (M‐H, Fixed, 95% CI) | 1.16 [0.70, 1.94] |
| 18 Transient ischaemic attack: combined continuous HT Show forest plot | 1 | Risk Ratio (M‐H, Fixed, 95% CI) | Subtotals only | |
| 18.1 CEE 0.625 mg (mod dose) + MPA 2.5 mg for 4 years | 1 | 2763 | Risk Ratio (M‐H, Fixed, 95% CI) | 0.80 [0.51, 1.23] |
| 18.2 CEE 0.625 mg (mod dose) + MPA 2.5 mg for 4‐6.8 years UNBLINDED | 1 | 2321 | Risk Ratio (M‐H, Fixed, 95% CI) | 0.95 [0.49, 1.84] |
| 19 Stroke or transient ischaemic attack: oestrogen‐only HT Show forest plot | 1 | Risk Ratio (M‐H, Fixed, 95% CI) | Subtotals only | |
| 19.1 CEE 0.625 mg (mod dose) daily for 3.2 years | 1 | 205 | Risk Ratio (M‐H, Fixed, 95% CI) | 0.88 [0.28, 2.78] |
| 20 Stroke or transient ischaemic attack: combined continuous HT Show forest plot | 1 | Risk Ratio (M‐H, Fixed, 95% CI) | Subtotals only | |
| 20.1 CEE 0.625 mg (mod dose) + MPA 2.5 mg for 3.2 years | 1 | 209 | Risk Ratio (M‐H, Fixed, 95% CI) | 1.01 [0.34, 3.03] |
| 21 VTE (first or recurrent PE or DVT): oestrogen‐only HT Show forest plot | 3 | Risk Ratio (M‐H, Fixed, 95% CI) | Subtotals only | |
| 21.1 Oestradiol valerate 2 mg (mod dose) for 2 years | 1 | 1017 | Risk Ratio (M‐H, Fixed, 95% CI) | 1.23 [0.33, 4.55] |
| 21.2 CEE 0.625 mg (mod dose) daily for 2.8‐3.2 years | 2 | 327 | Risk Ratio (M‐H, Fixed, 95% CI) | 1.64 [0.44, 6.17] |
| 22 VTE (first or recurrent PE or DVT): combined continuous HT Show forest plot | 4 | Risk Ratio (M‐H, Fixed, 95% CI) | Subtotals only | |
| 22.1 CEE 0.625 mg (mod dose) + MPA 2.5 mg for 1 year | 1 | 2763 | Risk Ratio (M‐H, Fixed, 95% CI) | 3.26 [1.06, 9.96] |
| 22.2 Continuous oestradiol 2 mg (mod dose) + norethisterone acetate 1 mg for 1.3 years | 1 | 140 | Risk Ratio (M‐H, Fixed, 95% CI) | 6.80 [0.86, 53.85] |
| 22.3 CEE 0.625 mg (mod dose) + MPA 2.5 mg for 2 years | 1 | 2763 | Risk Ratio (M‐H, Fixed, 95% CI) | 3.51 [1.42, 8.66] |
| 22.4 CEE 0.625 mg (mod dose) + MPA 2.5 mg for 3 years (2.8‐3.2) | 3 | 3060 | Risk Ratio (M‐H, Fixed, 95% CI) | 3.01 [1.50, 6.04] |
| 22.5 CEE 0.625 mg (mod dose) + MPA 2.5 mg for median 4.1 years | 1 | 2763 | Risk Ratio (M‐H, Fixed, 95% CI) | 2.62 [1.39, 4.94] |
| 22.6 CEE 0.625 mg (mod dose) + MPA 2.5 mg for 4‐7 years UNBLINDED | 1 | 2321 | Risk Ratio (M‐H, Fixed, 95% CI) | 1.37 [0.63, 2.98] |
| Outcome or subgroup title | No. of studies | No. of participants | Statistical method | Effect size |
| 1 Worsening of dementia on treatment (by ADCS‐CGIC score): oestrogen‐only HT Show forest plot | 1 | Risk Ratio (M‐H, Fixed, 95% CI) | Totals not selected | |
| 1.1 Unopposed CEE 0.625 mg (mod dose) or 1.25 mg (high dose) daily for 1 year | 1 | Risk Ratio (M‐H, Fixed, 95% CI) | 0.0 [0.0, 0.0] | |
| Outcome or subgroup title | No. of studies | No. of participants | Statistical method | Effect size |
| 1 Death from any cause: oestrogen‐only HT Show forest plot | 1 | Risk Ratio (M‐H, Fixed, 95% CI) | Subtotals only | |
| 1.1 CEE 0.625 mg (mod dose) daily for median 3 years | 1 | 1236 | Risk Ratio (M‐H, Fixed, 95% CI) | 1.37 [0.77, 2.45] |
| 2 Death from endometrial cancer: oestrogen‐only HT Show forest plot | 1 | Risk Ratio (M‐H, Fixed, 95% CI) | Subtotals only | |
| 2.1 CEE 0.625 mg (mod dose) daily for median 3 years | 1 | 1236 | Risk Ratio (M‐H, Fixed, 95% CI) | 1.25 [0.34, 4.63] |
| 3 Death from CHD: oestrogen‐only HT Show forest plot | 1 | Risk Ratio (M‐H, Fixed, 95% CI) | Subtotals only | |
| 3.1 CEE 0.625 mg (mod dose) daily for median 3 years | 1 | 1236 | Risk Ratio (M‐H, Fixed, 95% CI) | 1.25 [0.34, 4.63] |
| Outcome or subgroup title | No. of studies | No. of participants | Statistical method | Effect size |
| 1 All‐cause death: combined sequential HT Show forest plot | 1 | Risk Ratio (M‐H, Fixed, 95% CI) | Subtotals only | |
| 1.1 CEE 2.5 mg (high dose) daily + MPA 10 mg for 7 days each cycle | 1 | 168 | Risk Ratio (M‐H, Fixed, 95% CI) | 0.43 [0.11, 1.60] |
| 2 Myocardial infarction: combined sequential HT Show forest plot | 1 | Risk Ratio (M‐H, Fixed, 95% CI) | Subtotals only | |
| 2.1 CEE 2.5 mg (high dose) daily + MPA 10 mg for 7 days each cycle | 1 | 168 | Risk Ratio (M‐H, Fixed, 95% CI) | 0.33 [0.04, 3.14] |
| 3 Venous thromboembolism (DVT or PE): combined sequential HT Show forest plot | 1 | Risk Ratio (M‐H, Fixed, 95% CI) | Subtotals only | |
| 3.1 CEE 2.5 mg (high dose) daily + MPA 10 mg for 7 days each cycle | 1 | 168 | Risk Ratio (M‐H, Fixed, 95% CI) | 0.33 [0.01, 8.07] |
| Outcome or subgroup title | No. of studies | No. of participants | Statistical method | Effect size |
| 1 Breast cancer: oestrogen‐only HT Show forest plot | 7 | Risk Ratio (M‐H, Fixed, 95% CI) | Subtotals only | |
| 1.1 Oestrogen only HRT patch 0.025 (low dose) mg daily for 2 years | 1 | 176 | Risk Ratio (M‐H, Fixed, 95% CI) | 2.93 [0.12, 71.04] |
| 1.2 Oestradiol 1 mg (low dose) for 2 years | 1 | 222 | Risk Ratio (M‐H, Fixed, 95% CI) | 0.33 [0.01, 8.10] |
| 1.3 Oestradiol valerate 2 mg (mod dose) for 2 years | 1 | 1017 | Risk Ratio (M‐H, Fixed, 95% CI) | 0.98 [0.25, 3.91] |
| 1.4 Oestradiol patch 0.075 mg (high dose) for 2 years | 1 | 176 | Risk Ratio (M‐H, Fixed, 95% CI) | 2.93 [0.12, 71.04] |
| 1.5 CEE 0.625 mg (mod dose) for 2.8‐3.2 years | 3 | 676 | Risk Ratio (M‐H, Fixed, 95% CI) | 2.05 [0.38, 11.04] |
| 1.6 CEE 0.625 mg (mod dose) for 7.1 years | 1 | 10739 | Risk Ratio (M‐H, Fixed, 95% CI) | 0.79 [0.61, 1.01] |
| 1.7 CEE 0.625 mg (mod dose) after 10.7 years (includes extra follow‐up) | 1 | 10739 | Risk Ratio (M‐H, Fixed, 95% CI) | 0.78 [0.63, 0.96] |
| 1.8 CEE 0.625 mg (mod dose) after 13 years (includes extra follow‐up) | 1 | 10739 | Risk Ratio (M‐H, Fixed, 95% CI) | 0.80 [0.65, 0.97] |
| 2 Breast cancer: oestrogen‐only or combined HT Show forest plot | 1 | Odds Ratio (M‐H, Fixed, 95% CI) | Totals not selected | |
| 2.1 CEE 0.625 mg (mod dose) with or without 2.5 mg MPA for 3 years | 1 | Odds Ratio (M‐H, Fixed, 95% CI) | 0.0 [0.0, 0.0] | |
| 3 Breast cancer: combined continuous HT Show forest plot | 5 | Risk Ratio (M‐H, Fixed, 95% CI) | Subtotals only | |
| 3.1 CEE 0.625 mg (mod dose) + MPA 2.5 mg for mean/median 1 year | 2 | 23182 | Risk Ratio (M‐H, Fixed, 95% CI) | 0.52 [0.28, 0.96] |
| 3.2 CEE 0.625 mg (mod dose) + MPA 2.5 mg for 2 years | 1 | 16608 | Risk Ratio (M‐H, Fixed, 95% CI) | 0.71 [0.47, 1.08] |
| 3.3 CEE 0.625 mg (mod dose) + MPA 2.5 mg for 2.8‐3.4 years | 3 | 17733 | Risk Ratio (M‐H, Fixed, 95% CI) | 0.85 [0.62, 1.18] |
| 3.4 CEE 0.625 mg (mod dose) + MPA 2.5 mg for 4 years | 1 | 2763 | Risk Ratio (M‐H, Fixed, 95% CI) | 1.36 [0.82, 2.27] |
| 3.5 CEE 0.625 mg (mod dose) + MPA 2.5 mg for 5.6 years | 1 | 16608 | Risk Ratio (M‐H, Fixed, 95% CI) | 1.27 [1.03, 1.56] |
| 3.6 CEE 0.625 mg (mod dose) + MPA 2.5 mg for 4‐7 years unblinded | 1 | 2321 | Risk Ratio (M‐H, Fixed, 95% CI) | 1.08 [0.52, 2.23] |
| 3.7 CEE 0.625 mg (mod dose) + MPA 2.5 mg for 7.9 years | 1 | 16607 | Risk Ratio (M‐H, Fixed, 95% CI) | 1.27 [1.07, 1.52] |
| 3.8 CEE 0.625 mg (mod dose) + MPA 2.5 mg after 11 years (includes extra follow‐up) | 1 | 16608 | Risk Ratio (M‐H, Fixed, 95% CI) | 1.25 [1.08, 1.45] |
| 3.9 CEE 0.625 mg (mod dose) + MPA 2.5 mg after 13.2 years (includes extended follow up) | 1 | 16608 | Risk Ratio (M‐H, Fixed, 95% CI) | 1.28 [1.11, 1.47] |
| 4 Breast cancer: combined sequential HT Show forest plot | 3 | Risk Ratio (M‐H, Fixed, 95% CI) | Subtotals only | |
| 4.1 CEE 0.625 mg (mod dose) daily + MPA 10 mg days 1‐12 for 3 years | 1 | 348 | Risk Ratio (M‐H, Fixed, 95% CI) | 2.0 [0.18, 21.85] |
| 4.2 CEE 0.625 mg (mod dose) daily + micronised progesterone 200 mg days 1‐12 for 3 years | 1 | 352 | Risk Ratio (M‐H, Fixed, 95% CI) | 3.91 [0.44, 34.64] |
| 4.3 CEE 0.045 mg (lowish dose) + 200 mg sequential progesterone for 4 years | 1 | 505 | Risk Ratio (M‐H, Fixed, 95% CI) | 1.79 [0.30, 10.64] |
| 4.4 Oestradiol patch 0.05 mg (mod dose) + 200 mg sequential progesterone for 4 years | 1 | 497 | Risk Ratio (M‐H, Fixed, 95% CI) | 1.86 [0.31, 11.02] |
| 4.5 CEE 2.5 mg daily (high dose) + MPA 10 mg for 7 days each cycle for 10 years | 1 | 168 | Risk Ratio (M‐H, Fixed, 95% CI) | 0.11 [0.01, 2.03] |
| 5 Breast cancer: oestrogen with or without sequential progesterone vaginal gel Show forest plot | 1 | Risk Ratio (M‐H, Fixed, 95% CI) | Subtotals only | |
| 5.1 Oestradiol 1 mg daily, with or without cyclic 4% vaginal progesterone gel | 1 | 643 | Risk Ratio (M‐H, Fixed, 95% CI) | 1.24 [0.50, 3.10] |
| 6 Colorectal cancer: oestrogen‐only HT Show forest plot | 2 | Risk Ratio (M‐H, Fixed, 95% CI) | Subtotals only | |
| 6.1 CEE 0.625 mg (mod dose) for 3 years | 1 | 349 | Risk Ratio (M‐H, Fixed, 95% CI) | 0.33 [0.01, 8.08] |
| 6.2 CEE 0.625 (mod dose) for 7.1 years | 1 | 10739 | Risk Ratio (M‐H, Fixed, 95% CI) | 1.15 [0.81, 1.63] |
| 6.3 CEE 0.625 mg (mod dose) for 10.7 years (includes extra follow‐up) | 1 | 10739 | Risk Ratio (M‐H, Fixed, 95% CI) | 1.11 [0.82, 1.49] |
| 7 Colorectal cancer: oestrogen‐only or combined HT Show forest plot | 1 | Odds Ratio (M‐H, Fixed, 95% CI) | Totals not selected | |
| 7.1 CEE 0.625 mg (mod dose) with or without 2.5 mg MPA for 3 years | 1 | Odds Ratio (M‐H, Fixed, 95% CI) | 0.0 [0.0, 0.0] | |
| 8 Colorectal cancer: combined continuous HT Show forest plot | 4 | Risk Ratio (M‐H, Fixed, 95% CI) | Subtotals only | |
| 8.1 CEE 0.625 mg (mod dose) + MPA 2.5 mg for mean/median 1 year | 2 | 20993 | Risk Ratio (M‐H, Fixed, 95% CI) | 0.68 [0.32, 1.42] |
| 8.2 CEE 0.625 mg (mod dose) + MPA 2.5 mg for 2 years | 1 | 16608 | Risk Ratio (M‐H, Fixed, 95% CI) | 0.83 [0.46, 1.50] |
| 8.3 CEE 0.625 mg (mod dose) + MPA 2.5 mg for 3 years | 2 | 16956 | Risk Ratio (M‐H, Fixed, 95% CI) | 0.81 [0.49, 1.34] |
| 8.4 CEE 0.625 mg (mod dose) + 2.5 mg MPA for 4 years | 1 | 2763 | Risk Ratio (M‐H, Fixed, 95% CI) | 0.69 [0.32, 1.48] |
| 8.5 CEE 0.625 mg (mod dose) + MPA 2.5 mg for mean 5.6 years | 1 | 16608 | Risk Ratio (M‐H, Fixed, 95% CI) | 0.64 [0.44, 0.91] |
| 8.6 CEE 0.625 mg (mod dose) + 2.5 mg MPA for 4‐6.8 years UNBLINDED | 1 | 2321 | Risk Ratio (M‐H, Fixed, 95% CI) | 0.81 [0.46, 1.44] |
| 8.7 CEE 0.625 mg (mod dose) + MPA 2.5 mg after 7.9 years (includes extended follow‐up) | 1 | 16608 | Risk Ratio (M‐H, Fixed, 95% CI) | 0.76 [0.57, 1.01] |
| 8.8 CEE 0.0625 mg (mod dose) + MPA 2.5 mg after 11.6 years (includes extended follow‐up) | 1 | 16608 | Risk Ratio (M‐H, Fixed, 95% CI) | 0.78 [0.61, 0.99] |
| 8.9 CEE 0.0625 mg (mod dose) + MPA 2.5 mg after 13.2 years (includes extended follow‐up) | 1 | 16608 | Risk Ratio (M‐H, Fixed, 95% CI) | 0.80 [0.63, 1.01] |
| 9 Colorectal cancer: combined sequential HT Show forest plot | 2 | Risk Ratio (M‐H, Fixed, 95% CI) | Subtotals only | |
| 9.1 CEE 0.625 mg (mod dose) daily + MPA 10 mg days 1‐12 for 3 years | 1 | 348 | Risk Ratio (M‐H, Fixed, 95% CI) | 0.33 [0.01, 8.13] |
| 9.2 CEE 0.625 mg (mod dose) daily + micronised progesterone 200 mg days 1‐12 for 3 years | 1 | 352 | Risk Ratio (M‐H, Fixed, 95% CI) | 0.33 [0.01, 7.95] |
| 9.3 CEE 2.5 mg (high dose) daily + MPA 10 mg for 7 days each cycle for 10 years | 1 | 168 | Risk Ratio (M‐H, Fixed, 95% CI) | 1.0 [0.06, 15.73] |
| 10 Colorectal cancer: oestrogen with or without sequential progesterone vaginal gel Show forest plot | 1 | Risk Ratio (M‐H, Fixed, 95% CI) | Subtotals only | |
| 10.1 Oestradiol 1 mg daily, with or without cyclic 4% vaginal progesterone gel | 1 | 643 | Risk Ratio (M‐H, Fixed, 95% CI) | 1.49 [0.25, 8.83] |
| 11 Lung cancer: oestrogen‐only HT (moderate dose) Show forest plot | 1 | Risk Ratio (M‐H, Fixed, 95% CI) | Subtotals only | |
| 11.1 Any lung cancer (non‐small cell or small cell) at 7.1 years | 1 | 10739 | Risk Ratio (M‐H, Fixed, 95% CI) | 1.04 [0.73, 1.48] |
| 12 Lung cancer: combined continuous HT (mod dose oestrogen) Show forest plot | 1 | Risk Ratio (M‐H, Fixed, 95% CI) | Subtotals only | |
| 12.1 Any lung cancer at 5.6 years (non‐small cell or small cell) | 1 | 16608 | Risk Ratio (M‐H, Fixed, 95% CI) | 1.06 [0.77, 1.46] |
| 12.2 Any lung cancer at 7.9 years | 1 | 16608 | Risk Ratio (M‐H, Fixed, 95% CI) | 1.22 [0.92, 1.62] |
| 12.3 Any lung cancer after median 14 years (includes extended follow‐up) | 1 | 16608 | Risk Ratio (M‐H, Fixed, 95% CI) | 1.13 [0.93, 1.38] |
| 13 Lung cancer: combined sequential HT Show forest plot | 1 | Odds Ratio (M‐H, Fixed, 95% CI) | Subtotals only | |
| 13.1 17‐B‐oestradiol 1 mg (low dose) daily plus (3 days weekly) 0.35 mg norethindrone for 2 years | 1 | 142 | Odds Ratio (M‐H, Fixed, 95% CI) | 3.13 [0.13, 78.13] |
| 14 Endometrial cancer: oestrogen‐only HT Show forest plot | 1 | Risk Ratio (M‐H, Fixed, 95% CI) | Subtotals only | |
| 14.1 CEE 0.625 mg (mod dose) for 3‐3.2 years | 1 | 238 | Risk Ratio (M‐H, Fixed, 95% CI) | 0.33 [0.01, 8.10] |
| 15 Endometrial cancer: combined continuous HT (mode dose oestrogen) Show forest plot | 3 | Risk Ratio (M‐H, Fixed, 95% CI) | Subtotals only | |
| 15.1 CEE 0.625 mg + MPA 2.5 mg for 1 year | 1 | 16608 | Risk Ratio (M‐H, Fixed, 95% CI) | 0.95 [0.13, 6.76] |
| 15.2 CEE 0.625 mg + MPA 2.5 mg for 2 years | 1 | 16608 | Risk Ratio (M‐H, Fixed, 95% CI) | 0.95 [0.31, 2.95] |
| 15.3 CEE 0.625 mg + MPA 2.5 mg for 3‐3.2 years | 2 | 16847 | Risk Ratio (M‐H, Fixed, 95% CI) | 0.80 [0.35, 1.82] |
| 15.4 CEE 0.625 mg + MPA 2.5 mg for 4 years | 1 | 2763 | Risk Ratio (M‐H, Fixed, 95% CI) | 0.40 [0.08, 2.06] |
| 15.5 CEE 0.625 mg + MPA 2.5 mg for 5.6 years | 1 | 16608 | Risk Ratio (M‐H, Fixed, 95% CI) | 0.86 [0.51, 1.44] |
| 15.6 CEE 0.625 mg + MPA 2.5 mg for 4‐6.8 years UNBLINDED | 1 | 2321 | Risk Ratio (M‐H, Fixed, 95% CI) | 0.14 [0.01, 2.78] |
| 15.7 CEE 0.625 + MPS 2.5 mg for 7.9 years | 1 | 16608 | Risk Ratio (M‐H, Fixed, 95% CI) | 0.81 [0.54, 1.20] |
| 15.8 CEE 0.625 mg + MPA 2.5 mg after median 13 years (includes extended follow‐up) | 1 | 16608 | Risk Ratio (M‐H, Fixed, 95% CI) | 0.66 [0.48, 0.90] |
| 16 Endometrial cancer: combined sequential HT Show forest plot | 4 | Risk Ratio (M‐H, Fixed, 95% CI) | Subtotals only | |
| 16.1 17‐B‐oestradiol 1 mg (low dose) + dydrogesterone 5 mg days 14‐28 for 2 years | 1 | 163 | Risk Ratio (M‐H, Fixed, 95% CI) | 1.90 [0.08, 45.95] |
| 16.2 CEE 0.625 mg (mod dose) daily + micronised progesterone 200 mg days 1‐12 for 3 years | 1 | 239 | Risk Ratio (M‐H, Fixed, 95% CI) | 0.33 [0.01, 8.03] |
| 16.3 Oestradiol 2 mg (mod dose) + dihydrogesterone 20 mg for 2 years | 1 | 159 | Risk Ratio (M‐H, Fixed, 95% CI) | 3.30 [0.16, 67.59] |
| 16.4 CEE 0.045 mg (lowish dose) + 200 mg sequential progesterone for 4 years | 1 | 505 | Risk Ratio (M‐H, Fixed, 95% CI) | 5.97 [0.29, 123.81] |
| 16.5 Oestradiol patch 0.05 mg (mod dose) + 200 mg sequential progesterone for 4 years | 1 | 497 | Risk Ratio (M‐H, Fixed, 95% CI) | 3.71 [0.15, 90.70] |
| 16.6 CEE 2.5 mg (high dose) daily + MPA 10 mg for 7 days each cycle for 10 years | 1 | 168 | Risk Ratio (M‐H, Fixed, 95% CI) | 0.33 [0.01, 8.07] |
| 17 Recurrent endometrial cancer: oestrogen‐only HT Show forest plot | 1 | Risk Ratio (M‐H, Fixed, 95% CI) | Subtotals only | |
| 17.1 Oestrogen (type and dose not stated) for median 3 years | 1 | 1236 | Risk Ratio (M‐H, Fixed, 95% CI) | 1.17 [0.54, 2.50] |
| 18 Ovarian cancer: combined continuous HT Show forest plot | 1 | Risk Ratio (M‐H, Fixed, 95% CI) | Subtotals only | |
| 18.1 CEE 0.625 mg (mod dose) + MPA 2.5 mg for 5.6 years | 1 | 16608 | Risk Ratio (M‐H, Fixed, 95% CI) | 1.43 [0.76, 2.69] |
| 18.2 CEE 0.625 mg (mod dose) + MPA 2.5 mg after 13.2 years (includes extended follow‐up) | 1 | 16608 | Risk Ratio (M‐H, Fixed, 95% CI) | 1.23 [0.82, 1.85] |
| 19 Ovarian cancer: oestrogen with or without sequential progesterone vaginal gel Show forest plot | 1 | Risk Ratio (M‐H, Fixed, 95% CI) | Subtotals only | |
| 19.1 Oestradiol 1 mg daily, with or without cyclic 4% vaginal progesterone gel | 1 | 643 | Risk Ratio (M‐H, Fixed, 95% CI) | 0.33 [0.01, 8.08] |
| 20 Gallbladder disease requiring surgery: oestrogen‐only HT Show forest plot | 3 | 8930 | Risk Ratio (M‐H, Fixed, 95% CI) | 1.75 [1.40, 2.19] |
| 20.1 CEE 0.625 mg (mod dose) for 3‐3.2 years | 2 | 554 | Risk Ratio (M‐H, Fixed, 95% CI) | 0.77 [0.17, 3.39] |
| 20.2 CEE O.625 mg (mod dose) for 7.1 years | 1 | 8376 | Risk Ratio (M‐H, Fixed, 95% CI) | 1.78 [1.42, 2.24] |
| 21 Gallbladder disease requiring surgery: combined continuous HT Show forest plot | 4 | Risk Ratio (M‐H, Fixed, 95% CI) | Subtotals only | |
| 21.1 CEE 0.625 mg (mod dose) + 2.5 mg MPA for 3 years | 2 | 557 | Risk Ratio (M‐H, Fixed, 95% CI) | 2.01 [0.61, 6.59] |
| 21.2 CEE 0.625 mg (mod dose) + 2.5 mg MPA for 4 years | 1 | 2253 | Risk Ratio (M‐H, Fixed, 95% CI) | 1.35 [0.98, 1.85] |
| 21.3 CEE 0.625 mg (mod dose) + 2.5 mg MPA for mean 5.6 years | 1 | 14203 | Risk Ratio (M‐H, Fixed, 95% CI) | 1.64 [1.30, 2.06] |
| 22 Gallbladder disease requiring surgery: combined sequential HT Show forest plot | 1 | Risk Ratio (M‐H, Fixed, 95% CI) | Subtotals only | |
| 22.1 CEE 0.625 mg (mod dose) daily + MPA 10 mg days 1‐12 for 3 years | 1 | 348 | Risk Ratio (M‐H, Fixed, 95% CI) | 2.0 [0.37, 10.78] |
| 22.2 CEE 0.625 mg (mod dose) daily + micronised progesterone 200 mg days 1‐12 for 3 years | 1 | 352 | Risk Ratio (M‐H, Fixed, 95% CI) | 1.47 [0.25, 8.67] |
| 23 Hip fractures: oestrogen‐only HT Show forest plot | 1 | Risk Ratio (M‐H, Fixed, 95% CI) | Subtotals only | |
| 23.1 CEE 0.625 mg (mod dose) for 7.1 years | 1 | 10739 | Risk Ratio (M‐H, Fixed, 95% CI) | 0.66 [0.46, 0.95] |
| 23.2 CEE 0.625 mg (mod dose) for 10.7 years (includes extra follow‐up) | 1 | 10739 | Risk Ratio (M‐H, Fixed, 95% CI) | 0.92 [0.71, 1.18] |
| 23.3 CEE 0.625 mg (mod dose) after 13.2 years (includes extended follow‐up) | 1 | 10739 | Risk Ratio (M‐H, Fixed, 95% CI) | 0.93 [0.74, 1.17] |
| 24 Hip fractures: oestrogen‐only or combined sequential HT Show forest plot | 1 | Risk Ratio (M‐H, Fixed, 95% CI) | Subtotals only | |
| 24.1 Oestradiol 1 mg (low dose) daily (if no uterus) plus MPA 5 mg for 12 days a year (if uterus intact) for 2.8 years | 1 | 664 | Risk Ratio (M‐H, Fixed, 95% CI) | 0.62 [0.27, 1.42] |
| 25 Hip fractures: combined continuous HT Show forest plot | 3 | Risk Ratio (M‐H, Fixed, 95% CI) | Subtotals only | |
| 25.1 CEE 0.625 mg (mod dose) + MPA 2.5 mg for mean/median 1 year | 2 | 20993 | Risk Ratio (M‐H, Fixed, 95% CI) | 0.64 [0.26, 1.57] |
| 25.2 CEE 0.625 mg (mod dose) + MPA 2.5 mg for 2 years | 1 | 16608 | Risk Ratio (M‐H, Fixed, 95% CI) | 0.61 [0.31, 1.18] |
| 25.3 CEE 0.625 mg (mod dose) + MPA 2.5 mg for 3 years | 1 | 16608 | Risk Ratio (M‐H, Fixed, 95% CI) | 0.70 [0.42, 1.17] |
| 25.4 CEE 0.625 mg (mod dose) + MPA 2.5 mg for 4 years | 1 | 2763 | Risk Ratio (M‐H, Fixed, 95% CI) | 1.16 [0.55, 2.42] |
| 25.5 CEE 0.625 mg (mod dose) + MPA 2.5 mg for 5.6 years | 1 | 16608 | Risk Ratio (M‐H, Fixed, 95% CI) | 0.67 [0.47, 0.96] |
| 25.6 CEE 0.625 mg (mod dose) + MPA 2.5 mg for 4‐6.8 years UNBLINDED | 1 | 2321 | Risk Ratio (M‐H, Fixed, 95% CI) | 2.10 [1.06, 4.16] |
| 25.7 CEE 0.625 mg (mod dose) + 2.5 mg MPA for 7.9 years | 1 | 16608 | Risk Ratio (M‐H, Fixed, 95% CI) | 0.77 [0.60, 0.99] |
| 25.8 CEE 0.625 mg (mod dose) + 2.5 mg MPA after 13.2 years (includes extended follow‐up) | 1 | 16608 | Risk Ratio (M‐H, Fixed, 95% CI) | 0.82 [0.69, 0.97] |
| 26 Hip fractures: combined sequential HT Show forest plot | 1 | Risk Ratio (M‐H, Fixed, 95% CI) | Subtotals only | |
| 26.1 17‐B‐oestradiol 1 mg (low dose) daily plus (3 days weekly) 0.35 mg norethindrone for 2 years | 1 | 142 | Risk Ratio (M‐H, Fixed, 95% CI) | 0.34 [0.01, 8.27] |
| 27 Vertebral fractures: oestrogen‐only HT Show forest plot | 1 | Risk Ratio (M‐H, Fixed, 95% CI) | Subtotals only | |
| 27.1 CEE 0.625 mg (mod dose) for 7.1 years | 1 | 10739 | Risk Ratio (M‐H, Fixed, 95% CI) | 0.64 [0.44, 0.94] |
| 28 Vertebral fractures: combined continuous HT Show forest plot | 2 | Risk Ratio (M‐H, Fixed, 95% CI) | Subtotals only | |
| 28.1 CEE 0.625 mg (mod dose) + MPA 2.5 mg for 4 years | 1 | 2763 | Risk Ratio (M‐H, Fixed, 95% CI) | 0.74 [0.37, 1.47] |
| 28.2 CEE 0.625 mg (mod dose) + MPA 2.5 mg for mean 5.6 years | 1 | 16608 | Risk Ratio (M‐H, Fixed, 95% CI) | 0.68 [0.49, 0.96] |
| 28.3 CEE 0.625 mg (mod dose) + MPA 2.5 mg for 4‐6.8 years UNBLINDED | 1 | 2321 | Risk Ratio (M‐H, Fixed, 95% CI) | 1.10 [0.49, 2.48] |
| 28.4 CEE 0.625 mg (mod dose) + MPA 2.5 mg for mean 7.9 years | 1 | 16608 | Risk Ratio (M‐H, Fixed, 95% CI) | 0.78 [0.60, 1.01] |
| 29 All clinical fractures: oestrogen‐only or combined sequential HT Show forest plot | 1 | Risk Ratio (M‐H, Fixed, 95% CI) | Subtotals only | |
| 29.1 Oestradiol 1 mg (low dose) daily (if no uterus) plus MPA 5 mg for 12 days a year (if uterus intact) for 2.8 years | 1 | 664 | Risk Ratio (M‐H, Fixed, 95% CI) | 1.23 [0.68, 2.19] |
| 30 All clinical fractures: oestrogen‐only HT (moderate dose) Show forest plot | 3 | Risk Ratio (M‐H, Fixed, 95% CI) | Subtotals only | |
| 30.1 Oestradiol valerate 2 mg (mod dose) for 2 years | 1 | 1017 | Risk Ratio (M‐H, Fixed, 95% CI) | 0.60 [0.29, 1.26] |
| 30.2 CEE 0.625 mg (mod dose) daily for 3.2 years | 1 | 205 | Risk Ratio (M‐H, Fixed, 95% CI) | 0.42 [0.17, 1.04] |
| 30.3 CEE 0.625 mg (mod dose) for 7.1 years | 1 | 10739 | Risk Ratio (M‐H, Fixed, 95% CI) | 0.73 [0.65, 0.80] |
| 31 All clinical fractures: oestrogen‐only or combined HT Show forest plot | 1 | Risk Ratio (M‐H, Fixed, 95% CI) | Totals not selected | |
| 31.1 CEE 0.625 mg (mod dose) with or without 2.5 mg MPA for 3 years | 1 | Risk Ratio (M‐H, Fixed, 95% CI) | 0.0 [0.0, 0.0] | |
| 32 All clinical fractures: combined continuous HT Show forest plot | 5 | Risk Ratio (M‐H, Fixed, 95% CI) | Subtotals only | |
| 32.1 CEE 0.625 mg (mod dose) + MPA 2.5 mg for median 1 year | 1 | 4385 | Risk Ratio (M‐H, Fixed, 95% CI) | 0.69 [0.46, 1.02] |
| 32.2 CEE 0.625 mg (mod dose) + MPA 2.5 mg for 3.2‐3.4 years | 2 | 986 | Risk Ratio (M‐H, Fixed, 95% CI) | 0.52 [0.32, 0.87] |
| 32.3 CEE 0.625 mg (mod dose) + MPA 2.5 mg for mean 5.6 years | 1 | 16608 | Risk Ratio (M‐H, Fixed, 95% CI) | 0.78 [0.71, 0.86] |
| 32.4 CEE 0.625 mg (mod dose) + MPA 2.5 mg for 4 years | 1 | 2763 | Risk Ratio (M‐H, Fixed, 95% CI) | 0.95 [0.76, 1.18] |
| 32.5 CEE 0.625 mg (mod dose) + MPA 2.5 mg for 4‐6.8 years UNBLINDED | 1 | 2321 | Risk Ratio (M‐H, Fixed, 95% CI) | 1.23 [0.91, 1.65] |
| 32.6 CEE 0.0625 mg (mod dose) + MPA 2.5 mg for mean 7.9 years | 1 | 16608 | Risk Ratio (M‐H, Fixed, 95% CI) | 0.82 [0.76, 0.89] |
| 33 All clinical fractures: combined sequential HT Show forest plot | 1 | Risk Ratio (M‐H, Fixed, 95% CI) | Subtotals only | |
| 33.1 17‐B‐oestradiol 1 mg (low dose) daily plus (3 days weekly) 0.35 mg norethindrone for 2 years | 1 | 142 | Risk Ratio (M‐H, Fixed, 95% CI) | 0.44 [0.12, 1.64] |