Agonistas adrenérgicos alfa 2 para la prevención de complicaciones cardíacas en adultos sometidos a cirugía
Información
- DOI:
- https://doi.org/10.1002/14651858.CD004126.pub3Copiar DOI

- Base de datos:
-
- Cochrane Database of Systematic Reviews
- Versión publicada:
-
- 06 marzo 2018see what's new
- Tipo:
-
- Intervention
- Etapa:
-
- Review
- Grupo Editorial Cochrane:
-
Grupo Cochrane de Anestesia
- Copyright:
-
- Copyright © 2018 The Cochrane Collaboration. Published by John Wiley & Sons, Ltd.
Cifras del artículo
Altmetric:
Citado por:
Autores
Contributions of authors
Conceiving the review: DNW, WSB.
Coordinating the review: DNW.
Undertaking manual searches: DD, AS.
Screening search results: DD, AS.
Organizing retrieval of papers: DD, AS.
Screening retrieved papers against inclusion criteria: DD, AS.
Appraising quality of papers: DD, AS.
Abstracting data from papers: DD, AS.
Writing to authors of papers for additional information: DD, AS.
Data management for the review: DD.
Entering data into Review Manager 5 (RevMan 2014): DD, AS.
RevMan statistical data: DD.
Interpretation of data: DD, AS, WSB, DNW.
Statistical inferences: DD, AS, WSB, DNW.
Writing the review: DD, AS, WSB, DNW.
Performing previous work that was the foundation of the present study: DNW, WSB.
Guarantor for the review (one author): DNW.
Person responsible for reading and checking review before submission: DNW.
Sources of support
Internal sources
-
Department of Anesthesia, University of Toronto, Canada.
External sources
-
Canadian Institutes of Health Research, Canada.
Declarations of interest
DD: no conflict of interest.
AS: no conflicts of interest.
WSB: the senior author of one included study (Wijeysundera 2014a); however, he had no involvement in either the data abstraction or quality assessment process. This author had no other relevant conflicts of interest.
DNW: the lead author of one included study (Wijeysundera 2014a); however, he had no involvement in either the primary data abstraction or quality assessment process. This author had no other relevant conflicts of interest.
Agradecimientos
We would like to thank Rodrigo Cavallazz (content editor), Cathal D Walsh (statistical editor), Ben Gibbison, Pierre Foex, Ernst‐Peter Horn (peer reviewers), Anne Lyddiatt (consumer referee) for their help and editorial advice during the preparation of this updated systematic review.
Dr Wijeysundera is supported in part by a New Investigator Award from the Canadian Institutes of Health Research (Ottawa, Ontario, Canada). Dr Beattie is the Fraser Elliot Chair of Cardiac Anesthesia at the University Health Network (Toronto, Ontario, Canada). Both Dr Wijeysundera and Dr Beattie are supported in part by Merit Awards from the Department of Anesthesia at the University of Toronto (Toronto, Ontario, Canada). We are indebted to the following authors who responded to our questions regarding their publications: Drs M Fischler, RM Grounds, HM Loick, I Matot, P Myles, M Oliver, L Quintin, C Spies, P Talke and A Wallace.
Version history
| Published | Title | Stage | Authors | Version |
| 2018 Mar 06 | Alpha‐2 adrenergic agonists for the prevention of cardiac complications among adults undergoing surgery | Review | Dallas Duncan, Ashwin Sankar, W Scott Beattie, Duminda N Wijeysundera | |
| 2009 Oct 07 | Alpha‐2 adrenergic agonists for the prevention of cardiac complications among patients undergoing surgery | Review | Duminda N Wijeysundera, Jennifer S Bender, W Scott Beattie | |
| 2009 Jul 08 | Alpha‐2 adrenergic agonists for the prevention of cardiovascular complications among patients undergoing cardiac or non‐cardiac surgery | Protocol | Duminda N Wijeysundera, Jennifer S Bender, W Scott Beattie | |
Differences between protocol and review
Several changes have been made since the publication of the original protocol (Wijeysundera 2003).
Changes for the 2018 review.
-
The target population of 'all major surgery' was divided into the subgroups of cardiac and non‐cardiac surgical procedures for all analyses. This alteration was in response to comments from an editorial board member, who raised concerns about the significant clinical heterogeneity between cardiac versus non‐cardiac surgical procedures.
-
We did not include a planned subgroup analysis comparing α‐2 adrenergic agonists to control in people receiving epidural or spinal anaesthesia as there was only one trial (Oliver 1999).
-
The inclusion criteria were broadened to include studies that only reported the outcomes of acute stroke and HF, based on comments from an editorial board member.
-
Given the large influence of two large RCTs (Devereaux 2014a; Oliver 1999), we performed a post‐hoc sensitivity analysis that excluded these specific studies.
-
Based on based on comments received during the peer‐review process, we performed post‐hoc sensitivity analyses that excluded the two RCTs of mivazerol (McSPI‐Europe 1997; Oliver 1999) since it is not available for clinical use.
-
Based on comments received during the peer‐review process, we performed post‐hoc sensitivity analyses that excluded studies where data collection or enrolment occurred more than 20 years ago, specifically to assess for the potential influence of temporal advances in perioperative on pooled treatment effects.
-
The quality of evidence underlying the main estimated pooled treatment effects was assessed based on the GRADE methodology and presented in 'Summary of findings' tables.
Changes for 2009 review (Wijeysundera 2009):
-
Based on comments from a peer reviewer (Peter Alston), the title was changed from 'Alpha‐2 adrenergic agonists for the prevention of cardiovascular complications among patients undergoing cardiac or non‐cardiac surgery' to 'Alpha‐2 adrenergic agonists for the prevention of cardiac complications among patients undergoing surgery.'
-
We performed several post‐hoc analyses that were not specified in the original protocol.
-
A subgroup analysis was performed based on drug type to explain the moderate heterogeneity for the pooled effect of α‐2 adrenergic agonists on perioperative hypotension.
-
We performed a post‐hoc subgroup analysis based on surgical procedure to explain the significant heterogeneity for the pooled effect of α‐2 adrenergic agonists on perioperative bradycardia.
-
-
We have added acute stroke as a secondary outcome (side‐effect from treatment) based on comments from a peer‐reviewer (Helen Higham), and the results of the POISE‐1 trial (POISE 2008). Specifically, the POISE‐1 trial found that perioperative beta‐blockers caused a significantly increased risk of perioperative acute stroke.
Notes
August 2016
Two studies (Boldt 1996;Wahlander 2005), which were included in the previous 2009 version of this review (Wijeysundera 2009), were removed from the 2016 version of the review due to concerns about scientific conduct.
Keywords
MeSH
Medical Subject Headings (MeSH) Keywords
- Adrenergic alpha‐Agonists [adverse effects, *therapeutic use];
- Clonidine [therapeutic use];
- Dexmedetomidine [therapeutic use];
- Heart Diseases [mortality, *prevention & control];
- Imidazoles [therapeutic use];
- Intraoperative Complications [mortality, prevention & control];
- Myocardial Infarction [mortality, prevention & control];
- Postoperative Complications [mortality, *prevention & control];
- Randomized Controlled Trials as Topic;
- Stress, Physiological [drug effects];
- Stroke [mortality];
- Surgical Procedures, Operative [*adverse effects, mortality];
Medical Subject Headings Check Words
Humans;
PICO

Study flow diagram.

Risk of bias graph: review authors' judgements about each risk of bias item presented as percentages across all included studies.

Risk of bias summary: review authors' judgements about each risk of bias item for each included study.

Funnel plot of comparison: 1 Alpha‐2 adrenergic agonists versus control in non‐cardiac surgery, outcome: 1.1 All‐cause mortality.

Funnel plot of comparison: 1 Alpha‐2 adrenergic agonists versus control in non‐cardiac surgery, outcome: 1.3 Myocardial infarction.

Comparison 1 Alpha‐2 adrenergic agonists versus control in non‐cardiac surgery, Outcome 1 All‐cause mortality.

Comparison 1 Alpha‐2 adrenergic agonists versus control in non‐cardiac surgery, Outcome 2 Cardiac mortality.

Comparison 1 Alpha‐2 adrenergic agonists versus control in non‐cardiac surgery, Outcome 3 Myocardial infarction.

Comparison 1 Alpha‐2 adrenergic agonists versus control in non‐cardiac surgery, Outcome 4 Myocardial ischaemia.

Comparison 1 Alpha‐2 adrenergic agonists versus control in non‐cardiac surgery, Outcome 5 Supraventricular tachyarrhythmia.

Comparison 1 Alpha‐2 adrenergic agonists versus control in non‐cardiac surgery, Outcome 6 Heart failure.

Comparison 1 Alpha‐2 adrenergic agonists versus control in non‐cardiac surgery, Outcome 7 Acute stroke.

Comparison 1 Alpha‐2 adrenergic agonists versus control in non‐cardiac surgery, Outcome 8 Bradycardia.

Comparison 1 Alpha‐2 adrenergic agonists versus control in non‐cardiac surgery, Outcome 9 Hypotension.

Comparison 2 Alpha‐2 adrenergic agonists versus control in cardiac surgery, Outcome 1 All‐cause mortality.

Comparison 2 Alpha‐2 adrenergic agonists versus control in cardiac surgery, Outcome 2 Myocardial infarction.

Comparison 2 Alpha‐2 adrenergic agonists versus control in cardiac surgery, Outcome 3 Myocardial ischaemia.

Comparison 2 Alpha‐2 adrenergic agonists versus control in cardiac surgery, Outcome 4 Supraventricular tachyarrhythmia.

Comparison 2 Alpha‐2 adrenergic agonists versus control in cardiac surgery, Outcome 5 Heart failure.

Comparison 2 Alpha‐2 adrenergic agonists versus control in cardiac surgery, Outcome 6 Acute stroke.

Comparison 2 Alpha‐2 adrenergic agonists versus control in cardiac surgery, Outcome 7 Bradycardia.

Comparison 2 Alpha‐2 adrenergic agonists versus control in cardiac surgery, Outcome 8 Hypotension.

Comparison 3 Alpha‐2 adrenergic agonists versus control in non‐cardiac surgery ‐ stratified by vascular versus non‐vascular surgery, Outcome 1 All‐cause mortality.

Comparison 3 Alpha‐2 adrenergic agonists versus control in non‐cardiac surgery ‐ stratified by vascular versus non‐vascular surgery, Outcome 2 Cardiac mortality.
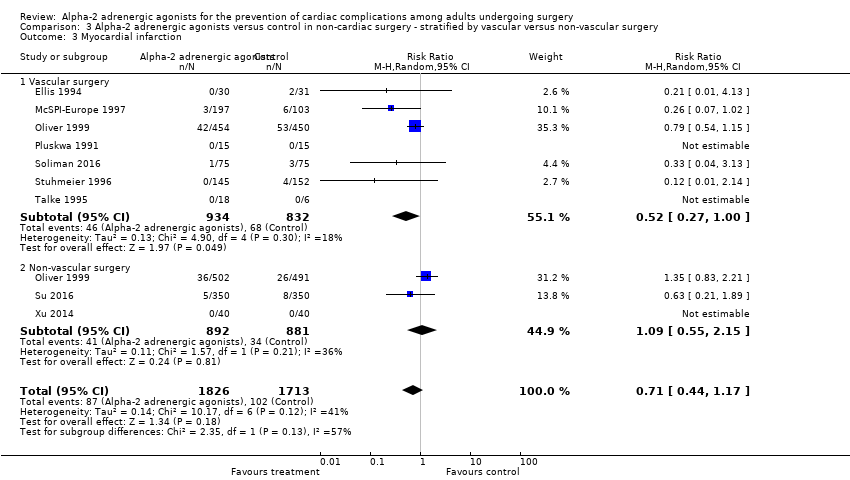
Comparison 3 Alpha‐2 adrenergic agonists versus control in non‐cardiac surgery ‐ stratified by vascular versus non‐vascular surgery, Outcome 3 Myocardial infarction.

Comparison 3 Alpha‐2 adrenergic agonists versus control in non‐cardiac surgery ‐ stratified by vascular versus non‐vascular surgery, Outcome 4 Myocardial ischaemia.

Comparison 4 Alpha‐2 adrenergic agonists (stratified by drug) versus control in non‐cardiac surgery, Outcome 1 All‐cause mortality.
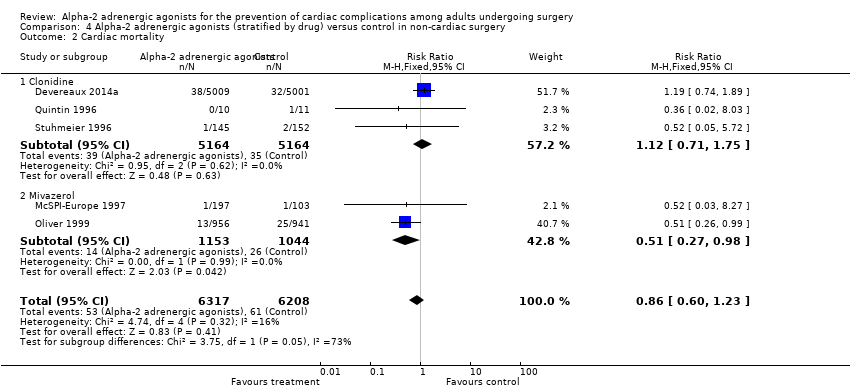
Comparison 4 Alpha‐2 adrenergic agonists (stratified by drug) versus control in non‐cardiac surgery, Outcome 2 Cardiac mortality.

Comparison 4 Alpha‐2 adrenergic agonists (stratified by drug) versus control in non‐cardiac surgery, Outcome 3 Myocardial infarction.

Comparison 4 Alpha‐2 adrenergic agonists (stratified by drug) versus control in non‐cardiac surgery, Outcome 4 Hypotension.

Comparison 5 Alpha‐2 adrenergic agonists versus control in non‐cardiac surgery studies with blinding and concealed allocation, Outcome 1 All‐cause mortality.

Comparison 5 Alpha‐2 adrenergic agonists versus control in non‐cardiac surgery studies with blinding and concealed allocation, Outcome 2 Myocardial infarction.

Comparison 5 Alpha‐2 adrenergic agonists versus control in non‐cardiac surgery studies with blinding and concealed allocation, Outcome 3 Myocardial ischaemia.

Comparison 6 Alpha‐2 adrenergic agonists versus control in studies that used strict definitions of myocardial infarction or ischaemia, Outcome 1 Myocardial infarction.

Comparison 6 Alpha‐2 adrenergic agonists versus control in studies that used strict definitions of myocardial infarction or ischaemia, Outcome 2 Myocardial ischaemia.

Comparison 7 Alpha‐2 adrenergic agonists versus control in non‐cardiac surgery (excluding Oliver 1999 and Devereaux 2014), Outcome 1 All‐cause mortality.

Comparison 7 Alpha‐2 adrenergic agonists versus control in non‐cardiac surgery (excluding Oliver 1999 and Devereaux 2014), Outcome 2 Cardiac mortality.
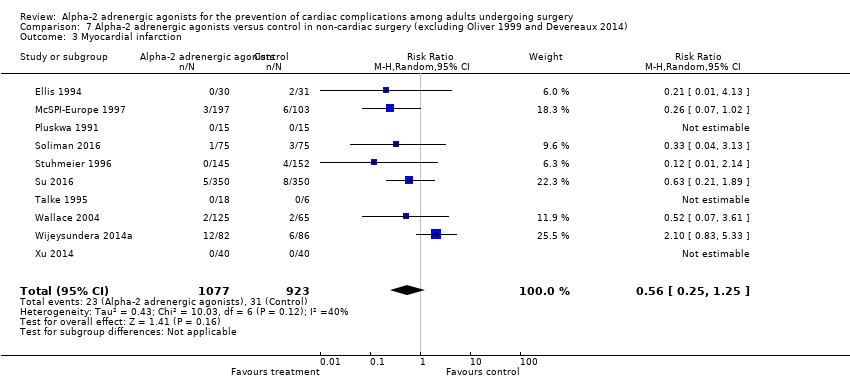
Comparison 7 Alpha‐2 adrenergic agonists versus control in non‐cardiac surgery (excluding Oliver 1999 and Devereaux 2014), Outcome 3 Myocardial infarction.

Comparison 8 Alpha‐2 adrenergic agonists (excluding mivazerol) versus control in non‐cardiac surgery, Outcome 1 All‐cause mortality.

Comparison 8 Alpha‐2 adrenergic agonists (excluding mivazerol) versus control in non‐cardiac surgery, Outcome 2 Cardiac mortality.

Comparison 8 Alpha‐2 adrenergic agonists (excluding mivazerol) versus control in non‐cardiac surgery, Outcome 3 Myocardial infarction.

Comparison 8 Alpha‐2 adrenergic agonists (excluding mivazerol) versus control in non‐cardiac surgery, Outcome 4 Myocardial ischaemia.

Comparison 8 Alpha‐2 adrenergic agonists (excluding mivazerol) versus control in non‐cardiac surgery, Outcome 5 Supraventricular tachyarrhythmia.

Comparison 8 Alpha‐2 adrenergic agonists (excluding mivazerol) versus control in non‐cardiac surgery, Outcome 6 Heart failure.

Comparison 8 Alpha‐2 adrenergic agonists (excluding mivazerol) versus control in non‐cardiac surgery, Outcome 7 Acute stroke.

Comparison 8 Alpha‐2 adrenergic agonists (excluding mivazerol) versus control in non‐cardiac surgery, Outcome 8 Bradycardia.

Comparison 8 Alpha‐2 adrenergic agonists (excluding mivazerol) versus control in non‐cardiac surgery, Outcome 9 Hypotension.

Comparison 9 Alpha‐2 adrenergic agonists versus control in non‐cardiac surgery within past 20 years, Outcome 1 All‐cause mortality.

Comparison 9 Alpha‐2 adrenergic agonists versus control in non‐cardiac surgery within past 20 years, Outcome 2 Cardiac mortality.

Comparison 9 Alpha‐2 adrenergic agonists versus control in non‐cardiac surgery within past 20 years, Outcome 3 Myocardial infarction.

Comparison 9 Alpha‐2 adrenergic agonists versus control in non‐cardiac surgery within past 20 years, Outcome 4 Myocardial ischaemia.

Comparison 9 Alpha‐2 adrenergic agonists versus control in non‐cardiac surgery within past 20 years, Outcome 5 Heart failure.

Comparison 9 Alpha‐2 adrenergic agonists versus control in non‐cardiac surgery within past 20 years, Outcome 6 Acute stroke.

Comparison 10 Alpha‐2 adrenergic agonists versus control in cardiac surgery within past 20 years, Outcome 1 All‐cause mortality.

Comparison 10 Alpha‐2 adrenergic agonists versus control in cardiac surgery within past 20 years, Outcome 2 Myocardial infarction.
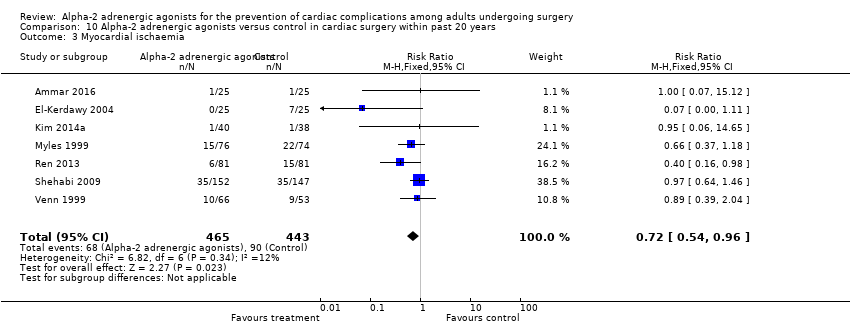
Comparison 10 Alpha‐2 adrenergic agonists versus control in cardiac surgery within past 20 years, Outcome 3 Myocardial ischaemia.

Comparison 10 Alpha‐2 adrenergic agonists versus control in cardiac surgery within past 20 years, Outcome 4 Supraventricular tachyarrhythmia.

Comparison 10 Alpha‐2 adrenergic agonists versus control in cardiac surgery within past 20 years, Outcome 5 Heart failure.

Comparison 10 Alpha‐2 adrenergic agonists versus control in cardiac surgery within past 20 years, Outcome 6 Acute stroke.
| Alpha‐2 adrenergic agonists compared to control in non‐cardiac surgery | ||||||
| Patient or population: adults undergoing non‐cardiac surgery | ||||||
| Outcomes | Anticipated absolute effects* (95% CI) | Risk ratio | № of participants | Quality of the evidence | Comments | |
| Risk with control | Risk with α‐2 adrenergic agonists | |||||
| All‐cause mortality (within 30‐days after surgery: any reported death) | Study population | RR 0.80 | 14,081 | ⊕⊕⊕⊕ | ‐ | |
| 17 per 1000 | 13 per 1000 | |||||
| Cardiac mortality (within 30‐days after surgery: sudden death or death resulting from a primarily identifiable cardiac cause.) | Study population | RR 0.86 | 12,525 | ⊕⊕⊕⊕ | ‐ | |
| 10 per 1000 | 8 per 1000 | |||||
| Myocardial infarction (within 30‐days after surgery: as detected on an electrocardiogram or trans‐oesophageal echocardiogram) | Study population | RR 0.94 | 13,907 | ⊕⊕⊕⊝ | ‐ | |
| 59 per 1000 | 55 per 1000 | |||||
| Acute stroke (within 30‐days after surgery: new focal neurologic deficit with signs and symptoms lasting longer than 24 hours) | Study population | RR 0.93 | 11,542 | ⊕⊕⊕⊕ | ‐ | |
| 5 per 1000 | 4 per 1000 | |||||
| Bradycardia (requiring pharmacological or pacemaker treatment during the period of study drug administration) | Study population | RR 1.59 | 14,035 | ⊕⊕⊕⊝ | ‐ | |
| 75 per 1000 | 119 per 1000 | |||||
| Hypotension (requiring treatment with inotropes or vasopressors during the period of study drug administration) | Study population | RR 1.24 | 13,738 | ⊕⊕⊕⊝ | ‐ | |
| 304 per 1000 | 377 per 1000 | |||||
| *The risk in the intervention group (and its 95% confidence interval) is based on the assumed risk in the comparison group and the relative effect of the intervention (and its 95% CI). | ||||||
| GRADE Working Group grades of evidence | ||||||
| 1Risk of bias was not serious. Although multiple studies lacked proper allocation concealment and blinding, outcome unlikely to be influenced. Not downgraded. 2Indirectness not serious. Intervention (mivazerol) used in one large study not available for clinical use. Not downgraded. 3Evidence of publication bias in funnel plot of analysis. Downgraded by one level. 4Serious inconsistency between studies indicated by substantial heterogeneity. Downgraded by one level. | ||||||
| Alpha‐2 adrenergic agonists compared to control in cardiac surgery | ||||||
| Patient or population: adults undergoing cardiac surgery | ||||||
| Outcomes | Anticipated absolute effects* (95% CI) | Relative effect | № of participants | Quality of the evidence | Comments | |
| Risk with control | Risk with α‐2 adrenergic agonists | |||||
| All‐cause mortality (within 30‐days after surgery: any reported death) | Study population | RR 0.52 | 1947 | ⊕⊕⊕⊝ | ‐ | |
| 21 per 1000 | 11 per 1000 | |||||
| Cardiac mortality (within 30‐days after surgery: sudden death or death resulting from a primarily identifiable cardiac cause) | 1 death from 12 participants in clonidine arm, and no deaths in 10 participants in control arm. | Not estimable | 22 (1 RCT) | Not estimable | We did not GRADE evidence for this outcome as accurate estimation of RRs is not possible for such low event rates. | |
| Myocardial infarction (within 30‐days after surgery: sudden death or death resulting from a primarily identifiable cardiac cause) | Study population | RR 1.01 | 782 | ⊕⊕⊕⊝ | ‐ | |
| 20 per 1000 | 21 per 1000 | |||||
| Acute stroke (within 30‐days after surgery: new focal neurologic deficit with signs and symptoms lasting longer than 24 hours) | Study population | RR 0.37 | 1175 | ⊕⊕⊝⊝ | Total of 18 acute stokes reported, with 14 in control group and 4 in treatment group. | |
| 24 per 1000 | 9 per 1000 | |||||
| Bradycardia (requiring pharmacological or pacemaker treatment during the period of study drug administration) | Study population | RR 1.88 | 1477 | ⊕⊕⊕⊝ | ‐ | |
| 64 per 1000 | 120 per 1000 | |||||
| Hypotension (requiring treatment with inotropes or vasopressors during the period of study drug administration) | Study population | RR 1.19 | 1413 | ⊕⊕⊝⊝ | ‐ | |
| 332 per 1000 | 395 per 1000 | |||||
| *The risk in the intervention group (and its 95% confidence interval) is based on the assumed risk in the comparison group and the relative effect of the intervention (and its 95% CI). | ||||||
| GRADE Working Group grades of evidence | ||||||
| 1Risk of bias was not serious. Although multiple studies lack proper allocation concealment and blinding, outcome unlikely to be influenced. Not downgraded. 2Serious imprecision, because analysis was below optimal information size and confidence interval includes significant benefit and harm. Downgraded by one level. 3Very serious imprecision, because analysis is below optimal information size and number of events was very small. Downgraded by two levels. 4Serious imprecision, because analysis was below optimal information size. Downgraded by one level 5Serious inconsistency between studies indicated by substantial heterogeneity. Downgraded one level. | ||||||
| Outcome or subgroup title | No. of studies | No. of participants | Statistical method | Effect size |
| 1 All‐cause mortality Show forest plot | 16 | 14081 | Risk Ratio (M‐H, Fixed, 95% CI) | 0.80 [0.61, 1.04] |
| 2 Cardiac mortality Show forest plot | 5 | 12525 | Risk Ratio (M‐H, Fixed, 95% CI) | 0.86 [0.60, 1.23] |
| 3 Myocardial infarction Show forest plot | 12 | 13907 | Risk Ratio (M‐H, Random, 95% CI) | 0.94 [0.69, 1.27] |
| 4 Myocardial ischaemia Show forest plot | 12 | 1379 | Risk Ratio (M‐H, Random, 95% CI) | 0.73 [0.53, 1.02] |
| 5 Supraventricular tachyarrhythmia Show forest plot | 2 | 44 | Risk Ratio (M‐H, Fixed, 95% CI) | 1.11 [0.05, 24.07] |
| 6 Heart failure Show forest plot | 8 | 10802 | Risk Ratio (M‐H, Fixed, 95% CI) | 1.21 [0.83, 1.75] |
| 7 Acute stroke Show forest plot | 7 | 11542 | Risk Ratio (M‐H, Fixed, 95% CI) | 0.93 [0.55, 1.56] |
| 8 Bradycardia Show forest plot | 16 | 14035 | Risk Ratio (M‐H, Random, 95% CI) | 1.59 [1.18, 2.13] |
| 9 Hypotension Show forest plot | 15 | 13738 | Risk Ratio (M‐H, Random, 95% CI) | 1.24 [1.03, 1.48] |
| Outcome or subgroup title | No. of studies | No. of participants | Statistical method | Effect size |
| 1 All‐cause mortality Show forest plot | 16 | 1947 | Risk Ratio (M‐H, Fixed, 95% CI) | 0.52 [0.26, 1.04] |
| 2 Myocardial infarction Show forest plot | 8 | 782 | Risk Ratio (M‐H, Fixed, 95% CI) | 1.01 [0.43, 2.40] |
| 3 Myocardial ischaemia Show forest plot | 13 | 1134 | Risk Ratio (M‐H, Fixed, 95% CI) | 0.69 [0.56, 0.86] |
| 4 Supraventricular tachyarrhythmia Show forest plot | 6 | 1044 | Risk Ratio (M‐H, Fixed, 95% CI) | 0.77 [0.50, 1.16] |
| 5 Heart failure Show forest plot | 4 | 549 | Risk Ratio (M‐H, Fixed, 95% CI) | 0.90 [0.49, 1.63] |
| 6 Acute stroke Show forest plot | 7 | 1175 | Risk Ratio (M‐H, Fixed, 95% CI) | 0.37 [0.15, 0.93] |
| 7 Bradycardia Show forest plot | 10 | 1477 | Risk Ratio (M‐H, Fixed, 95% CI) | 1.88 [1.35, 2.62] |
| 8 Hypotension Show forest plot | 9 | 1413 | Risk Ratio (M‐H, Random, 95% CI) | 1.19 [0.87, 1.64] |
| Outcome or subgroup title | No. of studies | No. of participants | Statistical method | Effect size |
| 1 All‐cause mortality Show forest plot | 13 | 3713 | Risk Ratio (M‐H, Fixed, 95% CI) | 0.63 [0.40, 0.98] |
| 1.1 Vascular surgery | 8 | 1798 | Risk Ratio (M‐H, Fixed, 95% CI) | 0.46 [0.25, 0.88] |
| 1.2 Non‐vascular surgery | 6 | 1915 | Risk Ratio (M‐H, Fixed, 95% CI) | 0.88 [0.46, 1.67] |
| 2 Cardiac mortality Show forest plot | 4 | 2515 | Risk Ratio (M‐H, Fixed, 95% CI) | 0.51 [0.27, 0.93] |
| 2.1 Vascular surgery | 4 | 1522 | Risk Ratio (M‐H, Fixed, 95% CI) | 0.36 [0.16, 0.79] |
| 2.2 Non‐vascular surgery | 1 | 993 | Risk Ratio (M‐H, Fixed, 95% CI) | 0.98 [0.35, 2.77] |
| 3 Myocardial infarction Show forest plot | 9 | 3539 | Risk Ratio (M‐H, Random, 95% CI) | 0.71 [0.44, 1.17] |
| 3.1 Vascular surgery | 7 | 1766 | Risk Ratio (M‐H, Random, 95% CI) | 0.52 [0.27, 1.00] |
| 3.2 Non‐vascular surgery | 3 | 1773 | Risk Ratio (M‐H, Random, 95% CI) | 1.09 [0.55, 2.15] |
| 4 Myocardial ischaemia Show forest plot | 9 | 961 | Risk Ratio (M‐H, Random, 95% CI) | 0.78 [0.52, 1.17] |
| 4.1 Vascular surgery | 6 | 865 | Risk Ratio (M‐H, Random, 95% CI) | 0.83 [0.54, 1.29] |
| 4.2 Non‐vascular surgery | 3 | 96 | Risk Ratio (M‐H, Random, 95% CI) | 0.23 [0.04, 1.34] |
| Outcome or subgroup title | No. of studies | No. of participants | Statistical method | Effect size |
| 1 All‐cause mortality Show forest plot | 16 | 14081 | Risk Ratio (M‐H, Fixed, 95% CI) | 0.80 [0.61, 1.04] |
| 1.1 Clonidine | 7 | 10787 | Risk Ratio (M‐H, Fixed, 95% CI) | 0.89 [0.64, 1.23] |
| 1.2 Dexmedetomidine | 7 | 1097 | Risk Ratio (M‐H, Fixed, 95% CI) | 0.49 [0.15, 1.58] |
| 1.3 Mivazerol | 2 | 2197 | Risk Ratio (M‐H, Fixed, 95% CI) | 0.69 [0.42, 1.15] |
| 2 Cardiac mortality Show forest plot | 5 | 12525 | Risk Ratio (M‐H, Fixed, 95% CI) | 0.86 [0.60, 1.23] |
| 2.1 Clonidine | 3 | 10328 | Risk Ratio (M‐H, Fixed, 95% CI) | 1.12 [0.71, 1.75] |
| 2.2 Mivazerol | 2 | 2197 | Risk Ratio (M‐H, Fixed, 95% CI) | 0.51 [0.27, 0.98] |
| 3 Myocardial infarction Show forest plot | 12 | 13907 | Risk Ratio (M‐H, Random, 95% CI) | 0.94 [0.69, 1.27] |
| 3.1 Clonidine | 6 | 10756 | Risk Ratio (M‐H, Random, 95% CI) | 1.05 [0.57, 1.92] |
| 3.2 Dexmedetomidine | 4 | 954 | Risk Ratio (M‐H, Random, 95% CI) | 0.55 [0.20, 1.49] |
| 3.3 Mivazerol | 2 | 2197 | Risk Ratio (M‐H, Random, 95% CI) | 0.60 [0.17, 2.08] |
| 4 Hypotension Show forest plot | 15 | 13738 | Risk Ratio (M‐H, Random, 95% CI) | 1.24 [1.03, 1.48] |
| 4.1 Clonidine | 7 | 10485 | Risk Ratio (M‐H, Random, 95% CI) | 1.29 [1.23, 1.35] |
| 4.2 Dexmedetomidine | 6 | 1056 | Risk Ratio (M‐H, Random, 95% CI) | 1.81 [1.07, 3.06] |
| 4.3 Mivazerol | 2 | 2197 | Risk Ratio (M‐H, Random, 95% CI) | 0.95 [0.82, 1.10] |
| Outcome or subgroup title | No. of studies | No. of participants | Statistical method | Effect size |
| 1 All‐cause mortality Show forest plot | 7 | 13066 | Risk Ratio (M‐H, Random, 95% CI) | 0.68 [0.41, 1.11] |
| 2 Myocardial infarction Show forest plot | 6 | 13026 | Risk Ratio (M‐H, Fixed, 95% CI) | 1.08 [0.95, 1.23] |
| 3 Myocardial ischaemia Show forest plot | 3 | 412 | Risk Ratio (M‐H, Random, 95% CI) | 0.77 [0.40, 1.48] |
| Outcome or subgroup title | No. of studies | No. of participants | Statistical method | Effect size |
| 1 Myocardial infarction Show forest plot | 11 | Risk Ratio (M‐H, Random, 95% CI) | Subtotals only | |
| 1.1 Non‐cardiac surgery | 8 | 13003 | Risk Ratio (M‐H, Random, 95% CI) | 0.98 [0.70, 1.36] |
| 1.2 Cardiac surgery | 3 | 275 | Risk Ratio (M‐H, Random, 95% CI) | 0.76 [0.19, 2.98] |
| 2 Myocardial ischaemia Show forest plot | 17 | Risk Ratio (M‐H, Random, 95% CI) | Subtotals only | |
| 2.1 Non‐cardiac surgery | 9 | 1175 | Risk Ratio (M‐H, Random, 95% CI) | 0.76 [0.54, 1.07] |
| 2.2 Cardiac surgery | 8 | 820 | Risk Ratio (M‐H, Random, 95% CI) | 0.71 [0.55, 0.91] |
| Outcome or subgroup title | No. of studies | No. of participants | Statistical method | Effect size |
| 1 All‐cause mortality Show forest plot | 14 | 2174 | Risk Ratio (M‐H, Fixed, 95% CI) | 0.45 [0.22, 0.93] |
| 2 Cardiac mortality Show forest plot | 3 | 618 | Risk Ratio (M‐H, Fixed, 95% CI) | 0.47 [0.10, 2.25] |
| 3 Myocardial infarction Show forest plot | 10 | 2000 | Risk Ratio (M‐H, Random, 95% CI) | 0.56 [0.25, 1.25] |
| Outcome or subgroup title | No. of studies | No. of participants | Statistical method | Effect size |
| 1 All‐cause mortality Show forest plot | 14 | 11884 | Risk Ratio (M‐H, Fixed, 95% CI) | 0.85 [0.62, 1.16] |
| 2 Cardiac mortality Show forest plot | 3 | 10328 | Risk Ratio (M‐H, Fixed, 95% CI) | 1.12 [0.71, 1.75] |
| 3 Myocardial infarction Show forest plot | 10 | 11710 | Risk Ratio (M‐H, Random, 95% CI) | 0.95 [0.59, 1.53] |
| 4 Myocardial ischaemia Show forest plot | 11 | 1079 | Risk Ratio (M‐H, Random, 95% CI) | 0.68 [0.48, 0.97] |
| 5 Supraventricular tachyarrhythmia Show forest plot | 2 | 44 | Risk Ratio (M‐H, Fixed, 95% CI) | 1.11 [0.05, 24.07] |
| 6 Heart failure Show forest plot | 7 | 10502 | Risk Ratio (M‐H, Fixed, 95% CI) | 1.25 [0.85, 1.84] |
| 7 Acute stroke Show forest plot | 6 | 11242 | Risk Ratio (M‐H, Fixed, 95% CI) | 0.90 [0.49, 1.63] |
| 8 Bradycardia Show forest plot | 14 | 11838 | Risk Ratio (M‐H, Random, 95% CI) | 1.66 [1.17, 2.36] |
| 9 Hypotension Show forest plot | 13 | 11541 | Risk Ratio (M‐H, Random, 95% CI) | 1.33 [1.15, 1.55] |
| Outcome or subgroup title | No. of studies | No. of participants | Statistical method | Effect size |
| 1 All‐cause mortality Show forest plot | 11 | 13378 | Risk Ratio (M‐H, Fixed, 95% CI) | 0.80 [0.61, 1.06] |
| 2 Cardiac mortality Show forest plot | 2 | 11907 | Risk Ratio (M‐H, Fixed, 95% CI) | 0.89 [0.61, 1.29] |
| 3 Myocardial infarction Show forest plot | 7 | 13195 | Risk Ratio (M‐H, Random, 95% CI) | 1.08 [0.93, 1.24] |
| 4 Myocardial ischaemia Show forest plot | 6 | 634 | Risk Ratio (M‐H, Random, 95% CI) | 0.51 [0.28, 0.93] |
| 5 Heart failure Show forest plot | 5 | 10424 | Risk Ratio (M‐H, Fixed, 95% CI) | 1.34 [0.89, 2.03] |
| 6 Acute stroke Show forest plot | 5 | 11218 | Risk Ratio (M‐H, Fixed, 95% CI) | 0.92 [0.50, 1.70] |
| Outcome or subgroup title | No. of studies | No. of participants | Statistical method | Effect size |
| 1 All‐cause mortality Show forest plot | 13 | 1782 | Risk Ratio (M‐H, Fixed, 95% CI) | 0.47 [0.23, 0.97] |
| 2 Myocardial infarction Show forest plot | 4 | 593 | Risk Ratio (M‐H, Fixed, 95% CI) | 0.81 [0.22, 3.03] |
| 3 Myocardial ischaemia Show forest plot | 7 | 908 | Risk Ratio (M‐H, Fixed, 95% CI) | 0.72 [0.54, 0.96] |
| 4 Supraventricular tachyarrhythmia Show forest plot | 5 | 964 | Risk Ratio (M‐H, Fixed, 95% CI) | 0.73 [0.44, 1.19] |
| 5 Heart failure Show forest plot | 2 | 445 | Risk Ratio (M‐H, Fixed, 95% CI) | 0.92 [0.48, 1.77] |
| 6 Acute stroke Show forest plot | 6 | 1095 | Risk Ratio (M‐H, Fixed, 95% CI) | 0.37 [0.14, 0.98] |