Tratamiento con oxígeno hiperbárico para las heridas crónicas
Información
- DOI:
- https://doi.org/10.1002/14651858.CD004123.pub4Copiar DOI

- Base de datos:
-
- Cochrane Database of Systematic Reviews
- Versión publicada:
-
- 24 junio 2015see what's new
- Tipo:
-
- Intervention
- Etapa:
-
- Review
- Grupo Editorial Cochrane:
-
Grupo Cochrane de Heridas
- Copyright:
-
- Copyright © 2020 The Cochrane Collaboration. Published by John Wiley & Sons, Ltd.
Cifras del artículo
Altmetric:
Citado por:
Autores
Contributions of authors
P. Kranke: initiated the study, dealt with correspondence, developed the protocol, undertook the searching and selected studies, appraised and data abstracted studies, entered data and wrote the review and participated in the update of the review.
M. Bennett: developed and edited the protocol, undertook the searching and selected studies, appraised and data abstracted studies, undertook the statistical analysis and wrote the review and the updated review.
M. Martyn‐St James: appraised and data abstracted selected studies identified for the update, and undertook the statistical and narrative synthesis for the update.
S. Debus: commented on the protocol and the review.
A. Schnabel: appraised and data abstracted studies, contributed to discussion.
S. Weibel: appraised and data abstracted selected studies, and undertook the statistical and narrative synthesis for the second update.
Contributions of editorial base:
Nicky Cullum: edited the review, advised on methodology, interpretation and review content. Approved the final review and review update prior to submission.
Sally Bell‐Syer: coordinated the editorial process. Advised on methodology, interpretation and content. Edited the review and the updated reviews.
Ruth Foxlee: designed the search strategy, ran the searches and edited the search methods section for the update.
Amanda Briant: ran the searches for the second update.
Sources of support
Internal sources
-
Departmental sources from the Department of Anaesthesiology, University of Wuerzburg, Germany, Germany.
External sources
-
This project was supported by the National Institute for Health Research, via Cochrane Infrastructure funding to Cochrane Wounds. The views and opinions expressed therein are those of the authors and do not necessarily reflect those of the Systematic Reviews Programme, NIHR, NHS or the Department of Health, UK.
-
NIHR Programme Grants for Applied Research, UK.
Declarations of interest
Peter Kranke: received consultancy payments from MSD and ProStrakan and payments for consultancy and grants from Fresenius Kabi.
Michael Bennett: none known.
Marissa Martyn‐St James: none known
Alexander Schnabel: none known
Sebastian Debus: none known
Stephanie Weibel: none known
27/02/20 Clarification message from the Co‐ordinating Editors: this review was found by the Cochrane Funding Arbiters, post publication, to be noncompliant with the Cochrane Conflict of Interest policy which includes the relevant parts of the Cochrane Commercial Sponsorship policy. A new update is underway which we expect to be published within 12 months. The update will have a majority of review authors and lead author free of conflicts.
Acknowledgements
The support of Professor Norbert Roewer, MD (Medical Director, Department of Anaesthesiology, University of Wuerzburg, Germany) with this review is kindly appreciated. The review authors would also like to thank Cochrane Wounds Group referees (Anne‐Marie Bagnall, Malcolm Brewster), Editors (Nicky Cullum, Andrea Nelson) and Statistician (Marialena Trivella) for their comments on this review. Thanks also to Jenny Bellorini who copy edited the updated review. I. Roeckl‐Wiedmann was involved in the development of the protocol, undertook the searching, selected and appraised studies for the review but was not involved in the updating of the review. The authors would also thank Rakesh Garg, MD (All India Institute of Medical Sciences, New Delhi, India ) for providing us raw data material for statistical analysis on request.
Version history
| Published | Title | Stage | Authors | Version |
| 2015 Jun 24 | Hyperbaric oxygen therapy for chronic wounds | Review | Peter Kranke, Michael H Bennett, Marrissa Martyn‐St James, Alexander Schnabel, Sebastian E Debus, Stephanie Weibel | |
| 2012 Apr 18 | Hyperbaric oxygen therapy for chronic wounds | Review | Peter Kranke, Michael H Bennett, Marrissa Martyn‐St James, Alexander Schnabel, Sebastian E Debus | |
| 2004 Jan 26 | Hyperbaric oxygen therapy for chronic wounds | Review | Peter Kranke, Michael H Bennett, Sebastian E Debus, Irmgard Roeckl‐Wiedmann, Alexander Schnabel | |
| 2002 Oct 14 | Hyperbaric oxygen for chronic wounds | Protocol | Peter Kranke, Mike Bennett, Irmgard Roeckl‐Wiedmann, Sebastian E. Debus | |
Differences between protocol and review
In this update, we identified one trial (Kaur 2012) which enrolled patients with different co‐morbidities and therefore different types of ulcers. Due to the possibility that in future more studies of this types will be found, we decided to add this as a new comparison termed "mixed ulcers types" to the analysis.
We introduced some changes within the methodological quality assessment (performance bias). In the original review, we defined "unclear risk of bias" for "blinding of participants and personnel", when the study does not specify the blinding process independent of the described treatment of the control group (e.g. no sham therapy offered) . We reconsidered this point and judged to assess studies as "high risk of bias", when they offered no sham therapy to the patients of the control arm. Therefore, Doctor 1992; Duzgun 2008; Faglia 1996a; Kessler 2003 are now assessed as "high risk of performance bias".
Keywords
MeSH
Medical Subject Headings (MeSH) Keywords
Medical Subject Headings Check Words
Humans;
PICO

Methodological quality summary: review authors' judgements about each methodological quality item for each included study.
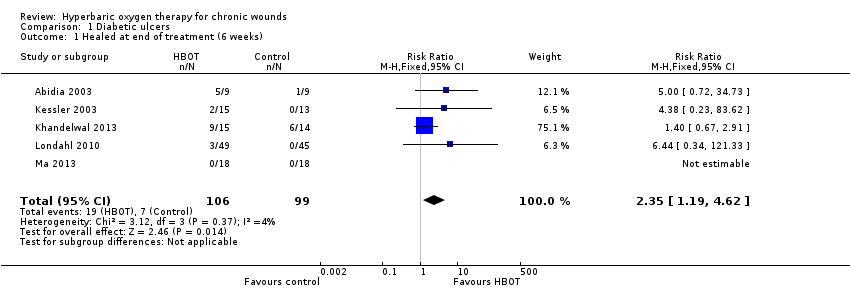
Comparison 1 Diabetic ulcers, Outcome 1 Healed at end of treatment (6 weeks).

Comparison 1 Diabetic ulcers, Outcome 2 Healed at end of treatment. Best‐case..
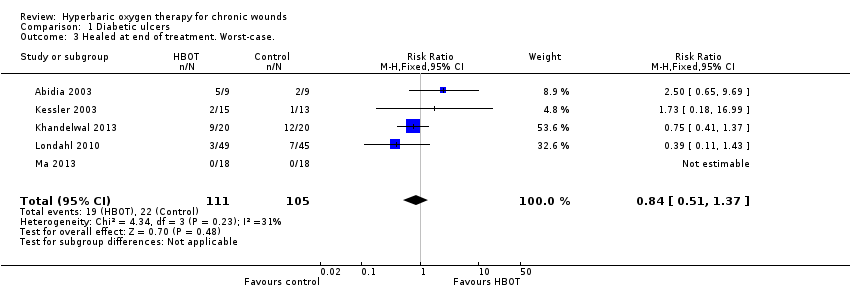
Comparison 1 Diabetic ulcers, Outcome 3 Healed at end of treatment. Worst‐case..

Comparison 1 Diabetic ulcers, Outcome 4 Healed at 6 months.
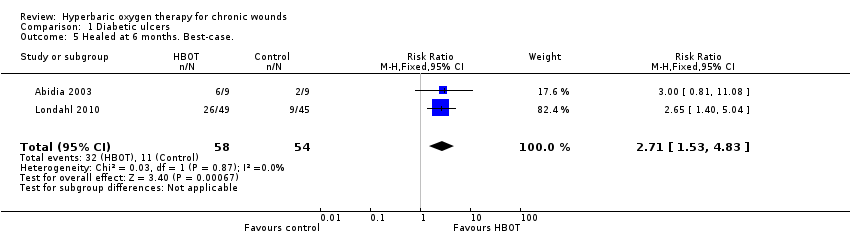
Comparison 1 Diabetic ulcers, Outcome 5 Healed at 6 months. Best‐case..

Comparison 1 Diabetic ulcers, Outcome 6 Healed at 6 months. Worst‐case..

Comparison 1 Diabetic ulcers, Outcome 7 Healed at 1 year.

Comparison 1 Diabetic ulcers, Outcome 8 Healed at 1 year. Peto analysis method..

Comparison 1 Diabetic ulcers, Outcome 9 Healed at 1 year. Best‐case..

Comparison 1 Diabetic ulcers, Outcome 10 Healed at 1 year. Worst‐case..

Comparison 1 Diabetic ulcers, Outcome 11 Major amputations.

Comparison 1 Diabetic ulcers, Outcome 12 Major amputations. Best‐case..

Comparison 1 Diabetic ulcers, Outcome 13 Major amputations. Worst‐case..
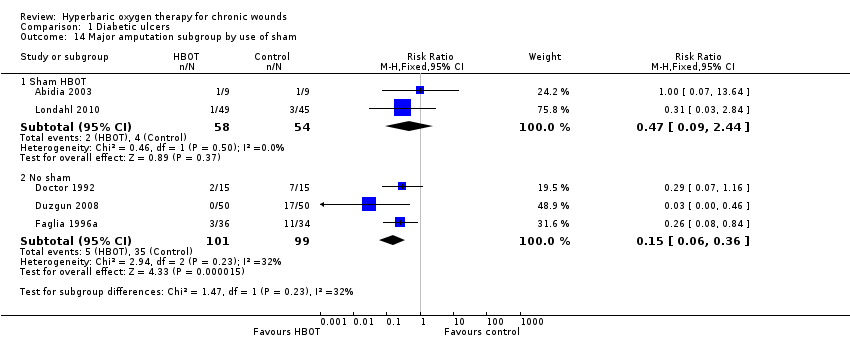
Comparison 1 Diabetic ulcers, Outcome 14 Major amputation subgroup by use of sham.
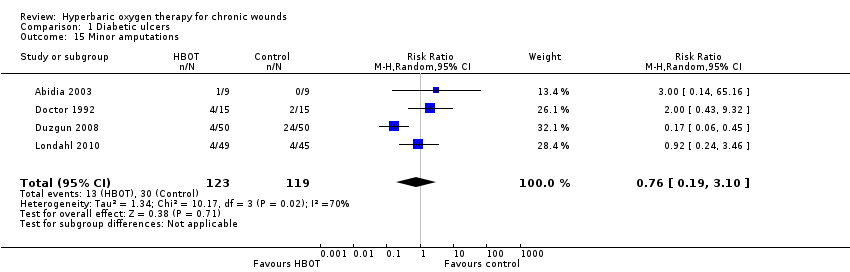
Comparison 1 Diabetic ulcers, Outcome 15 Minor amputations.

Comparison 1 Diabetic ulcers, Outcome 16 Minor amputations. Best‐case..

Comparison 1 Diabetic ulcers, Outcome 17 Minor amputations. Worst‐case..

Comparison 1 Diabetic ulcers, Outcome 18 Transcutaneous oxygen tensions change after treatment.

Comparison 1 Diabetic ulcers, Outcome 19 Absolute difference in transcutaneous oxygen at end of treatment.
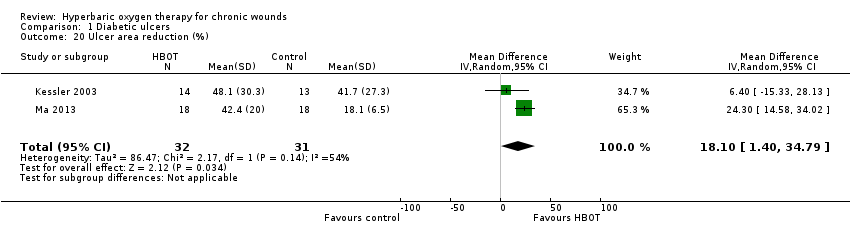
Comparison 1 Diabetic ulcers, Outcome 20 Ulcer area reduction (%).

Comparison 1 Diabetic ulcers, Outcome 21 Quality of life ‐ SF‐36 physical summary score.

Comparison 1 Diabetic ulcers, Outcome 22 Quality of life ‐ SF‐36 mental summary score.

Comparison 2 Venous ulcers, Outcome 1 Healed at 18 weeks.

Comparison 2 Venous ulcers, Outcome 2 Healed at 18 weeks. Best‐case..

Comparison 2 Venous ulcers, Outcome 3 Healed at 18 weeks. Worst‐case..

Comparison 2 Venous ulcers, Outcome 4 Wound size reduction at end treatment (6 weeks).

Comparison 2 Venous ulcers, Outcome 5 Wound size reduction at 18 weeks.

Comparison 3 Mixed ulcers types, Outcome 1 Healed at end of treatment (30 days).

Comparison 3 Mixed ulcers types, Outcome 2 Major amputations.

Comparison 3 Mixed ulcers types, Outcome 3 Periwound transcutaneous oxygen tensions at the end of treatment.

Comparison 3 Mixed ulcers types, Outcome 4 Ulcer area reduction (%).
| Hyperbaric Oxygen Therapy for chronic wounds | ||||||
| Patient or population: patients with chronic wounds | ||||||
| Outcomes | Illustrative comparative risks* (95% CI) | Relative effect | No of Participants | Quality of the evidence | Comments | |
| Assumed risk | Corresponding risk | |||||
| Control | Hyperbaric Oxygen Therapy | |||||
| Diabetic ulcers healed at 1 year. | Study population | RR 9.53 | 212 | ⊕⊕⊕⊝ | ||
| 115 per 1000 | 1000 per 1000 | |||||
| Low | ||||||
| 0 per 1000 | 0 per 1000 | |||||
| High | ||||||
| 0 per 1000 | 0 per 1000 | |||||
| Diabetic ulcers ‐ major amputations | Study population | RR 0.36 | 312 | ⊕⊕⊕⊝ | ||
| 247 per 1000 | 89 per 1000 | |||||
| Low | ||||||
| 0 per 1000 | 0 per 1000 | |||||
| High | ||||||
| 0 per 1000 | 0 per 1000 | |||||
| *The basis for the assumed risk (e.g. the median control group risk across studies) is provided in footnotes. The corresponding risk (and its 95% confidence interval) is based on the assumed risk in the comparison group and the relative effect of the intervention (and its 95% CI). | ||||||
| GRADE Working Group grades of evidence | ||||||
| 1 Analysis comprises small studies, some with zero events in control arm | ||||||
| Study | Missing but included | Missing total | Per cent of entered |
| 0 | 11 | 28% | |
| 0 | 0 | 0 | |
| 0 | 0 | 0 | |
| 0 | 0 | 0 | |
| 0 | 2 | 3% | |
| 0 | 0 | 0 | |
| 0 | 2 | 11% | |
| 0 | 5 | 31% | |
| 0 | 1 | <1% | |
| 0 | 0 | 0 | |
| 19 | 19 | 12% ‐ included in ITT | |
| 0 | 9 | 10% | |
| ITT: intention‐to‐treat | |||
| Outcome or subgroup title | No. of studies | No. of participants | Statistical method | Effect size |
| 1 Healed at end of treatment (6 weeks) Show forest plot | 5 | 205 | Risk Ratio (M‐H, Fixed, 95% CI) | 2.35 [1.19, 4.62] |
| 2 Healed at end of treatment. Best‐case. Show forest plot | 5 | 216 | Risk Ratio (M‐H, Fixed, 95% CI) | 4.61 [2.35, 9.08] |
| 3 Healed at end of treatment. Worst‐case. Show forest plot | 5 | 216 | Risk Ratio (M‐H, Fixed, 95% CI) | 0.84 [0.51, 1.37] |
| 4 Healed at 6 months Show forest plot | 2 | 112 | Risk Ratio (M‐H, Fixed, 95% CI) | 1.70 [0.90, 3.20] |
| 5 Healed at 6 months. Best‐case. Show forest plot | 2 | 112 | Risk Ratio (M‐H, Fixed, 95% CI) | 2.71 [1.53, 4.83] |
| 6 Healed at 6 months. Worst‐case. Show forest plot | 2 | 112 | Risk Ratio (M‐H, Fixed, 95% CI) | 0.93 [0.57, 1.54] |
| 7 Healed at 1 year Show forest plot | 3 | 212 | Risk Ratio (M‐H, Random, 95% CI) | 9.53 [0.44, 207.76] |
| 8 Healed at 1 year. Peto analysis method. Show forest plot | 3 | 212 | Peto Odds Ratio (Peto, Fixed, 95% CI) | 7.58 [4.33, 13.29] |
| 9 Healed at 1 year. Best‐case. Show forest plot | 3 | 212 | Risk Ratio (M‐H, Random, 95% CI) | 10.17 [0.47, 220.48] |
| 10 Healed at 1 year. Worst‐case. Show forest plot | 3 | 212 | Risk Ratio (M‐H, Random, 95% CI) | 6.55 [0.42, 101.71] |
| 11 Major amputations Show forest plot | 5 | 312 | Risk Ratio (M‐H, Random, 95% CI) | 0.36 [0.11, 1.18] |
| 11.1 Subgroup (30+ treatments) | 4 | 282 | Risk Ratio (M‐H, Random, 95% CI) | 0.40 [0.07, 2.23] |
| 11.2 Subgroup (< 30 treatments) | 1 | 30 | Risk Ratio (M‐H, Random, 95% CI) | 0.29 [0.07, 1.16] |
| 12 Major amputations. Best‐case. Show forest plot | 5 | 312 | Risk Ratio (M‐H, Fixed, 95% CI) | 0.20 [0.10, 0.38] |
| 13 Major amputations. Worst‐case. Show forest plot | 5 | 312 | Risk Ratio (M‐H, Random, 95% CI) | 0.62 [0.13, 2.98] |
| 14 Major amputation subgroup by use of sham Show forest plot | 5 | Risk Ratio (M‐H, Fixed, 95% CI) | Subtotals only | |
| 14.1 Sham HBOT | 2 | 112 | Risk Ratio (M‐H, Fixed, 95% CI) | 0.47 [0.09, 2.44] |
| 14.2 No sham | 3 | 200 | Risk Ratio (M‐H, Fixed, 95% CI) | 0.15 [0.06, 0.36] |
| 15 Minor amputations Show forest plot | 4 | 242 | Risk Ratio (M‐H, Random, 95% CI) | 0.76 [0.19, 3.10] |
| 16 Minor amputations. Best‐case. Show forest plot | 4 | 242 | Risk Ratio (M‐H, Random, 95% CI) | 0.55 [0.17, 1.75] |
| 17 Minor amputations. Worst‐case. Show forest plot | 4 | 242 | Risk Ratio (M‐H, Random, 95% CI) | 0.91 [0.21, 4.02] |
| 18 Transcutaneous oxygen tensions change after treatment Show forest plot | 1 | 68 | Mean Difference (IV, Fixed, 95% CI) | 9.0 [4.68, 13.32] |
| 19 Absolute difference in transcutaneous oxygen at end of treatment Show forest plot | 3 | 113 | Mean Difference (IV, Fixed, 95% CI) | 11.76 [5.68, 17.84] |
| 20 Ulcer area reduction (%) Show forest plot | 2 | 63 | Mean Difference (IV, Random, 95% CI) | 18.10 [1.40, 34.79] |
| 21 Quality of life ‐ SF‐36 physical summary score Show forest plot | 1 | 33 | Mean Difference (IV, Fixed, 95% CI) | ‐0.20 [‐8.58, 8.18] |
| 22 Quality of life ‐ SF‐36 mental summary score Show forest plot | 1 | 33 | Mean Difference (IV, Fixed, 95% CI) | 6.60 [‐3.93, 17.13] |
| Outcome or subgroup title | No. of studies | No. of participants | Statistical method | Effect size |
| 1 Healed at 18 weeks Show forest plot | 1 | 16 | Risk Ratio (M‐H, Fixed, 95% CI) | 5.0 [0.28, 90.18] |
| 2 Healed at 18 weeks. Best‐case. Show forest plot | 1 | 16 | Risk Ratio (M‐H, Fixed, 95% CI) | 9.0 [0.56, 143.89] |
| 3 Healed at 18 weeks. Worst‐case. Show forest plot | 1 | 16 | Risk Ratio (M‐H, Fixed, 95% CI) | 0.67 [0.15, 2.98] |
| 4 Wound size reduction at end treatment (6 weeks) Show forest plot | 1 | 16 | Mean Difference (IV, Fixed, 95% CI) | 33.0 [18.97, 47.03] |
| 5 Wound size reduction at 18 weeks Show forest plot | 1 | 11 | Mean Difference (IV, Fixed, 95% CI) | 29.60 [‐22.99, 82.19] |
| Outcome or subgroup title | No. of studies | No. of participants | Statistical method | Effect size |
| 1 Healed at end of treatment (30 days) Show forest plot | 1 | 30 | Risk Ratio (M‐H, Fixed, 95% CI) | 7.0 [0.39, 124.83] |
| 2 Major amputations Show forest plot | 1 | 30 | Risk Ratio (M‐H, Fixed, 95% CI) | 0.2 [0.03, 1.51] |
| 3 Periwound transcutaneous oxygen tensions at the end of treatment Show forest plot | 1 | 30 | Mean Difference (IV, Fixed, 95% CI) | 12.90 [4.00, 21.80] |
| 4 Ulcer area reduction (%) Show forest plot | 1 | 30 | Mean Difference (IV, Fixed, 95% CI) | 61.88 [41.91, 81.85] |