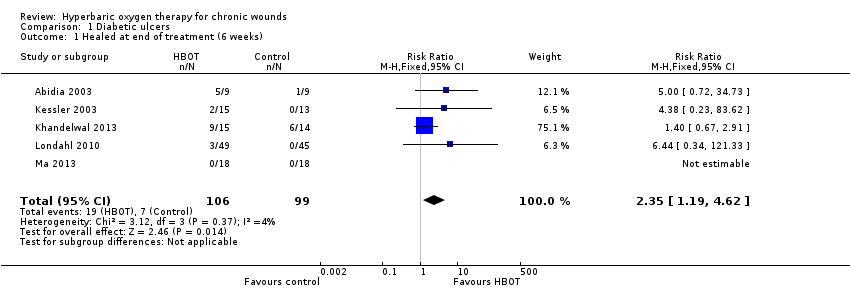
| 1 Healed at end of treatment (6 weeks) Show forest plot | 5 | 205 | Risk Ratio (M‐H, Fixed, 95% CI) | 2.35 [1.19, 4.62] |
|
| 2 Healed at end of treatment. Best‐case. Show forest plot | 5 | 216 | Risk Ratio (M‐H, Fixed, 95% CI) | 4.61 [2.35, 9.08] |
|
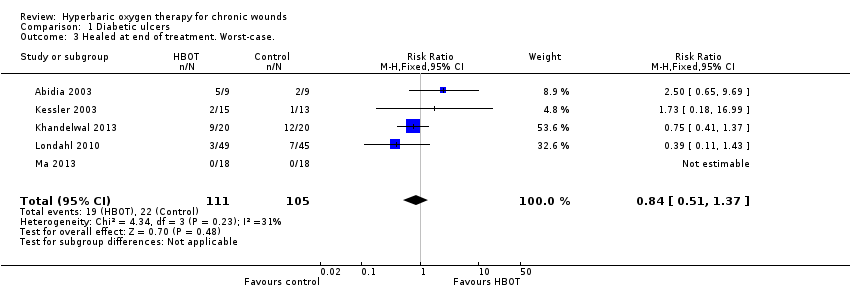
| 3 Healed at end of treatment. Worst‐case. Show forest plot | 5 | 216 | Risk Ratio (M‐H, Fixed, 95% CI) | 0.84 [0.51, 1.37] |
|
| 4 Healed at 6 months Show forest plot | 2 | 112 | Risk Ratio (M‐H, Fixed, 95% CI) | 1.70 [0.90, 3.20] |
|
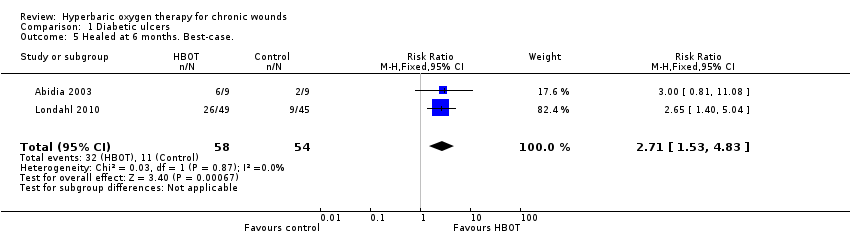
| 5 Healed at 6 months. Best‐case. Show forest plot | 2 | 112 | Risk Ratio (M‐H, Fixed, 95% CI) | 2.71 [1.53, 4.83] |
|
| 6 Healed at 6 months. Worst‐case. Show forest plot | 2 | 112 | Risk Ratio (M‐H, Fixed, 95% CI) | 0.93 [0.57, 1.54] |
|
| 7 Healed at 1 year Show forest plot | 3 | 212 | Risk Ratio (M‐H, Random, 95% CI) | 9.53 [0.44, 207.76] |
|
| 8 Healed at 1 year. Peto analysis method. Show forest plot | 3 | 212 | Peto Odds Ratio (Peto, Fixed, 95% CI) | 7.58 [4.33, 13.29] |
|
| 9 Healed at 1 year. Best‐case. Show forest plot | 3 | 212 | Risk Ratio (M‐H, Random, 95% CI) | 10.17 [0.47, 220.48] |
|
| 10 Healed at 1 year. Worst‐case. Show forest plot | 3 | 212 | Risk Ratio (M‐H, Random, 95% CI) | 6.55 [0.42, 101.71] |
|
| 11 Major amputations Show forest plot | 5 | 312 | Risk Ratio (M‐H, Random, 95% CI) | 0.36 [0.11, 1.18] |
|
| 11.1 Subgroup (30+ treatments) | 4 | 282 | Risk Ratio (M‐H, Random, 95% CI) | 0.40 [0.07, 2.23] |
| 11.2 Subgroup (< 30 treatments) | 1 | 30 | Risk Ratio (M‐H, Random, 95% CI) | 0.29 [0.07, 1.16] |
| 12 Major amputations. Best‐case. Show forest plot | 5 | 312 | Risk Ratio (M‐H, Fixed, 95% CI) | 0.20 [0.10, 0.38] |
|
| 13 Major amputations. Worst‐case. Show forest plot | 5 | 312 | Risk Ratio (M‐H, Random, 95% CI) | 0.62 [0.13, 2.98] |
|
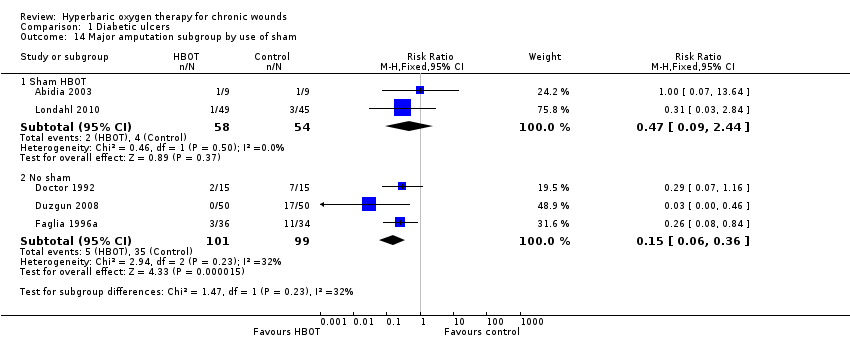
| 14 Major amputation subgroup by use of sham Show forest plot | 5 | | Risk Ratio (M‐H, Fixed, 95% CI) | Subtotals only |
|
| 14.1 Sham HBOT | 2 | 112 | Risk Ratio (M‐H, Fixed, 95% CI) | 0.47 [0.09, 2.44] |
| 14.2 No sham | 3 | 200 | Risk Ratio (M‐H, Fixed, 95% CI) | 0.15 [0.06, 0.36] |
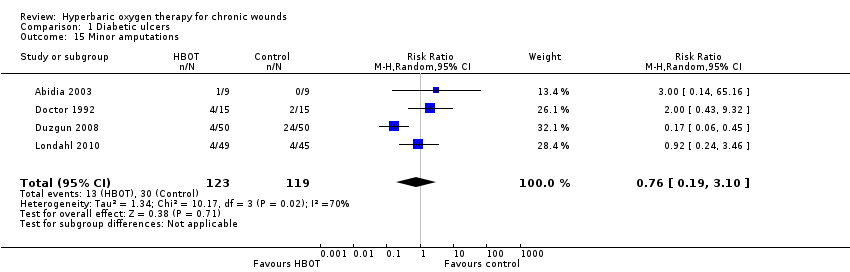
| 15 Minor amputations Show forest plot | 4 | 242 | Risk Ratio (M‐H, Random, 95% CI) | 0.76 [0.19, 3.10] |
|
| 16 Minor amputations. Best‐case. Show forest plot | 4 | 242 | Risk Ratio (M‐H, Random, 95% CI) | 0.55 [0.17, 1.75] |
|
| 17 Minor amputations. Worst‐case. Show forest plot | 4 | 242 | Risk Ratio (M‐H, Random, 95% CI) | 0.91 [0.21, 4.02] |
|
| 18 Transcutaneous oxygen tensions change after treatment Show forest plot | 1 | 68 | Mean Difference (IV, Fixed, 95% CI) | 9.0 [4.68, 13.32] |
|
| 19 Absolute difference in transcutaneous oxygen at end of treatment Show forest plot | 3 | 113 | Mean Difference (IV, Fixed, 95% CI) | 11.76 [5.68, 17.84] |
|
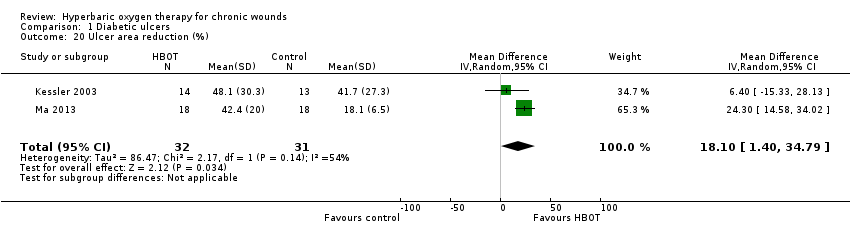
| 20 Ulcer area reduction (%) Show forest plot | 2 | 63 | Mean Difference (IV, Random, 95% CI) | 18.10 [1.40, 34.79] |
|
| 21 Quality of life ‐ SF‐36 physical summary score Show forest plot | 1 | 33 | Mean Difference (IV, Fixed, 95% CI) | ‐0.20 [‐8.58, 8.18] |
|
| 22 Quality of life ‐ SF‐36 mental summary score Show forest plot | 1 | 33 | Mean Difference (IV, Fixed, 95% CI) | 6.60 [‐3.93, 17.13] |
|