Contenido relacionado
Revisiones y protocolos relacionados
Susan L Norris, Xuanping Zhang, Alison Avenell, Edward Gregg, Christopher H Schmid, Joseph Lau | 24 enero 2005
Emma Axon, Greg Atkinson, Bernd Richter, Maria‐Inti Metzendorf, Louise Baur, Nicholas Finera, Eva Corpeleijn, Claire O'Malley, Louisa J Ells | 29 noviembre 2016
Cintia Curioni, Charles André | 18 octubre 2006
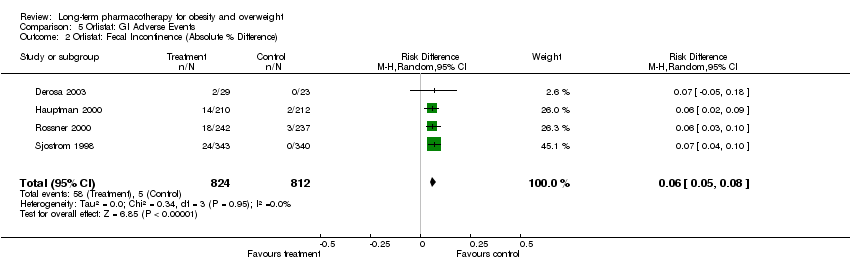
Andrew B Jull, Cliona Ni Mhurchu, Derrick A Bennett, Christel AE Dunshea‐Mooij, Anthony Rodgers | 16 julio 2008
Andrea Siebenhofer, Sebastian Winterholer, Klaus Jeitler, Karl Horvath, Andrea Berghold, Cornelia Krenn, Thomas Semlitsch | 17 enero 2021
Hiltje Oude Luttikhuis, Louise Baur, Hanneke Jansen, Vanessa A Shrewsbury, Claire O'Malley, Ronald P Stolk, Carolyn D Summerbell | 7 marzo 2019
Tannis M Jurgens, Anne Marie Whelan, Lara Killian, Steve Doucette, Sara Kirk, Elizabeth Foy | 12 diciembre 2012
Susan L Norris, Xuanping Zhang, Alison Avenell, Edward Gregg, Tamara Brown, Christopher H Schmid, Joseph Lau | 20 abril 2005
Moshe Vardi, Eyal Jacobson, Asaph Nini, Haim Bitterman | 16 julio 2008
Bianca Hemmingsen, Maria-Inti Metzendorf, Bernd Richter | 4 marzo 2021
Respuestas clínicas Cochrane
Jane Burch, Sera Tort | 9 octubre 2020