Quimioterapia paliativa y tratamientos dirigidos para el cáncer esofágico y de la unión gastroesofágica
Información
- DOI:
- https://doi.org/10.1002/14651858.CD004063.pub4Copiar DOI

- Base de datos:
-
- Cochrane Database of Systematic Reviews
- Versión publicada:
-
- 28 noviembre 2017see what's new
- Tipo:
-
- Intervention
- Etapa:
-
- Review
- Grupo Editorial Cochrane:
-
Grupo Cochrane de Salud digestiva
- Copyright:
-
- Copyright © 2017 The Cochrane Collaboration. Published by John Wiley & Sons, Ltd.
Cifras del artículo
Altmetric:
Citado por:
Autores
Contributions of authors
EJK reviewed the draft manuscript. AvdG supervised the analyses and reviewed the draft manuscript. RHJM supervised the analyses and reviewed the draft manuscript. MPP supervised the analyses and reviewed the draft manuscript. MJB supervised the analyses and reviewed the draft manuscript. EWS consulted on the statistical methodology and the interpretation of the outcomes of the analyses and reviewed the draft manuscript. MCWS selected inclusions based on abstract and full text, extracted descriptive data, risk of bias data and outcome data, supervised the analyses and reviewed the draft manuscript. VTJ selected inclusions based on abstract and full text, extracted descriptive data, risk of bias data and outcome data, attempted to contact study authors, performed analyses, wrote the draft manuscript, made revisions to the draft manuscript, and submitted the final paper.
Sources of support
Internal sources
-
Dept. of Gastroenterology & Hepatology, Erasmus MC / University Medical Center Rotterdam, Netherlands.
-
Dept. of Public Health, ErasmusMC, University Medical Center Rotterdam, Netherlands.
-
Biomedical information specialists, Medical Library ErasmusMC, University Medical Center Rotterdam, Netherlands.
External sources
-
No sources of support supplied
Declarations of interest
VTJ: none known.
EWS: none known.
AvdG: none known.
RHJM: none known.
MJB: none known.
MPP: none known.
EJK: none known.
MCWS: none known.
Acknowledgements
The authors would like to thank the Cochrane Upper Gastrointestinal and Pancreatic Group for their critical review, support and advice. Additionally, the authors would like to thank the biomedical information specialists of the medical library of the Erasmus MC, University Medical Center Rotterdam, the Netherlands for their support with building the search. Finally, we thank the previous authors of this review who paved the way for this updated version.
Version history
| Published | Title | Stage | Authors | Version |
| 2017 Nov 28 | Palliative chemotherapy and targeted therapies for esophageal and gastroesophageal junction cancer | Review | Vincent T Janmaat, Ewout W Steyerberg, Ate van der Gaast, Ron HJ Mathijssen, Marco J Bruno, Maikel P Peppelenbosch, Ernst J Kuipers, Manon CW Spaander | |
| 2010 May 12 | Chemotherapy for metastatic carcinoma of the esophagus and gastro‐esophageal junction | Review | Marjolein YV Homs, Ate van der Gaast, Peter D Siersema, Ewout W Steyerberg, Ernst J Kuipers | |
| 2006 Oct 18 | Chemotherapy for metastatic carcinoma of the esophagus and gastro‐esophageal junction | Review | Marjolein Y.V. Homs, Ate v.d. Gaast, Peter D. Siersema, Ewout W. Steyerberg, Ernst J. Kuipers | |
| 2003 Jan 20 | Chemotherapy for metastatic carcinoma of the esophagus and gastric cardia | Protocol | Marjolein Y.V. Homs, Ate v.d. Gaast, Peter D. Siersema, Ewout W. Steyerberg, Ernst J. Kuipers | |
Differences between protocol and review
Differences between the protocol of the previous review and the protocol of the current review
Types of participants
Besides people with metastatic disease, we also included people with advanced (T3‐T4NxM0 if technically inoperable) disease, with the exception of those with locally advanced cancer who received systemic therapy in order to assess secondary resectability. We included people with advanced, non‐metastasized disease when the intent of the treatment was palliation. We included studies involving only a subset of eligible participants if they contained at least 15 eligible participants, and we only included these studies in a meta‐analysis if there were enough studies to perform a meaningful sensitivity analysis by meta‐regression.
Types of interventions
Interventions studying targeted therapies fall explicitly within the types of interventions studied in this review. This was not specified in the previous version.
Electronic searches
In addition to researching CENTRAL, MEDLINE, Embase, and PUBMED, we also searched the Web of Science, Google Scholar, ClinicalTrials.gov, and WHO International Clinical Trials Registry Platform (ICTRP).
Individual participant data
We attempted to contact the authors of all studies that included suitable participants and asked them to provide individual participant data for studies included after the search of 3 October 2013. We did the same for studies that included some suitable participants but did not report the outcomes separately for this group.
Quality assessment of studies
We included an additional quality assessment domain on selective reporting bias. We no longer subdivided studies into categories of quality depending on the risk of bias criteria. We defined baseline comparability and intention‐to‐treat analysis.
Measures of treatment effect
We extracted or estimated HRs and 95% CIs as relevant effect measures directly or indirectly from the given data. This was not specified in the previous version.
Dealing with missing data
In case of missing outcomes, we contacted the trial authors. If the authors were not willing or able to share their data, we estimated the missing outcomes if possible, and if not, we included the studies and described the outcomes that were reported. We then noted missing data on individuals and missing study level characteristics in the 'Risk of bias' tables.
Assessment of reporting biases
We assessed small study effects such as publication bias in a qualitative manner using a funnel plot. This was not specified in the previous version.
Data synthesis
Given the heterogeneous methods of the included studies, we calculated pooled estimates of effect using an inverse variance random‐effects model for meta‐analysis. We synthesized the Ln(HR) for overall survival and progression‐free survival as well as median overall and progression‐free survival, which was not specified in the previous version. We summarized toxicity and quality of life data narratively for comparison one as was done in the previous version, but we did not repeat them for the subcomparisons.
Summary of findings tables
We used the GRADE system to assess the quality of the evidence for each analysis, presenting our assessments in 'Summary of findings' tables using RevMan 5. This was not specified in the previous version.
Sensitivity analysis
The effect modifier identified was the presence of ineligible participants in the study. If we performed data synthesis including studies from this subgroup, we ran a sensitivity analysis by meta‐regression to quantify the amount of heterogeneity between the two subgroups.
Keywords
MeSH
Medical Subject Headings (MeSH) Keywords
- Adenocarcinoma [drug therapy, mortality];
- Antibodies, Monoclonal [therapeutic use];
- Antibodies, Monoclonal, Humanized;
- Antineoplastic Agents [therapeutic use];
- Antineoplastic Combined Chemotherapy Protocols [*therapeutic use];
- Carcinoma, Squamous Cell [drug therapy, mortality];
- Disease-Free Survival;
- Esophageal Neoplasms [*drug therapy, mortality];
- *Esophagogastric Junction;
- Molecular Targeted Therapy [*methods, mortality];
- Palliative Care [*methods];
- Quality of Life;
- Randomized Controlled Trials as Topic;
- Stomach Neoplasms [*drug therapy, mortality];
Medical Subject Headings Check Words
Humans;
PICO

Study flow diagram: review update

Risk of bias summary: review authors' judgements about each risk of bias item for each included study.

Forest plot of the main analysis: chemotherapy or targeted therapy agent(s) plus control arm versus control arm, outcome: 1.1 Overall survival.

Funnel plot of the main comparison: chemotherapy or targeted therapy agent(s) plus control arm versus control arm, outcome: 1.1 Overall survival.

Forest plot of the main analysis: chemotherapy or targeted therapy agent(s) plus control arm versus control arm, outcome: 1.2 Progression free survival.
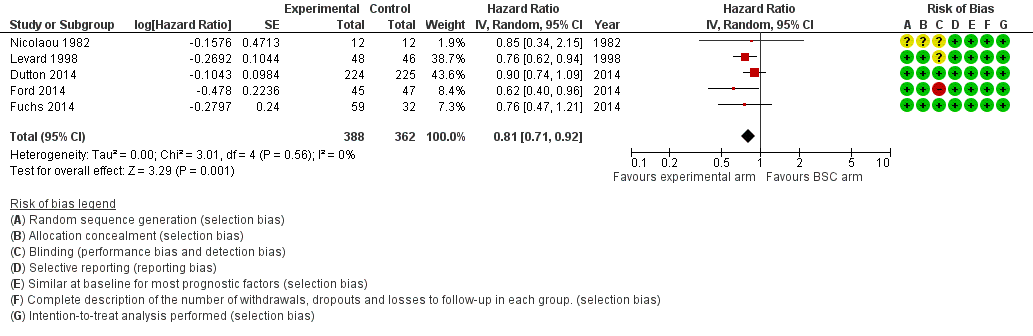
Forest plot of subcomparison 1: chemotherapy or targeted therapy agent(s) plus BSC versus BSC, outcome 4.1: overall survival.

Forest plot of subcomparison 1: chemotherapy or targeted therapy agent(s) plus BSC versus BSC, outcome 4.1: progression free survival.

Comparison 1 Main analysis: chemotherapy or targeted therapy agent(s) plus control intervention versus control intervention alone, Outcome 1 Overall survival.
Comparison 1 Main analysis: chemotherapy or targeted therapy agent(s) plus control intervention versus control intervention alone, Outcome 2 Progression‐free survival.

Comparison 2 Sensitivity analysis: studies that also included participants with gastric cancer, Outcome 1 Overall survival.

Comparison 3 Sensitivity analysis: effect of intervention on participants with GE‐junction cancer versus effect of intervention on participants with gastric cancer, Outcome 1 Overall survival, GE‐junction cancer outcomes.

Comparison 3 Sensitivity analysis: effect of intervention on participants with GE‐junction cancer versus effect of intervention on participants with gastric cancer, Outcome 2 Overall survival, gastric cancer outcomes.

Comparison 4 Subcomparison 1: chemotherapy or targeted therapy plus BSC versus BSC, Outcome 1 Overall survival.

Comparison 4 Subcomparison 1: chemotherapy or targeted therapy plus BSC versus BSC, Outcome 2 Progression‐free survival.

Comparison 5 Subcomparison 2: studies with participants receiving second‐line therapy, Outcome 1 Overall survival.

Comparison 5 Subcomparison 2: studies with participants receiving second‐line therapy, Outcome 2 Progression‐free survival.
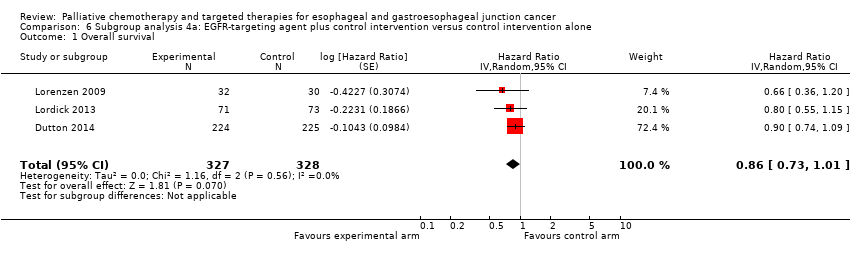
Comparison 6 Subgroup analysis 4a: EGFR‐targeting agent plus control intervention versus control intervention alone, Outcome 1 Overall survival.

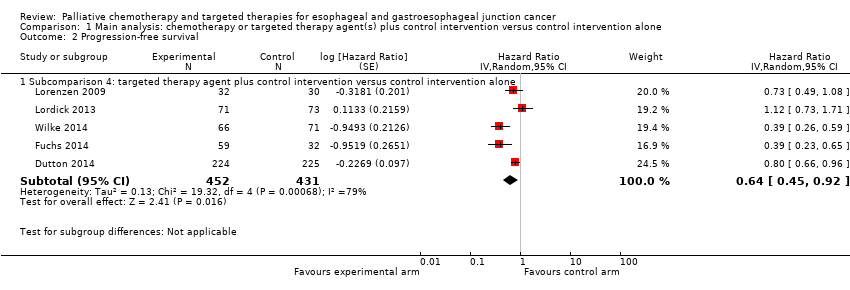
Comparison 6 Subgroup analysis 4a: EGFR‐targeting agent plus control intervention versus control intervention alone, Outcome 2 Progression‐free survival.

Comparison 7 Subgroup analysis 4b: cetuximab plus control intervention versus control intervention alone, Outcome 1 Overall survival.

Comparison 7 Subgroup analysis 4b: cetuximab plus control intervention versus control intervention alone, Outcome 2 Progression‐free survival.

Comparison 8 Subgroup analysis 4c: ramucirumab plus control intervention versus control intervention alone, Outcome 1 Overall survival.

Comparison 8 Subgroup analysis 4c: ramucirumab plus control intervention versus control intervention alone, Outcome 2 Progression‐free survival.

Comparison 9 Subcomparison 5: chemotherapy or targeted therapy agent(s) plus control intervention versus control intervention alone in participants with AC of the esophagus, Outcome 1 Overall survival.
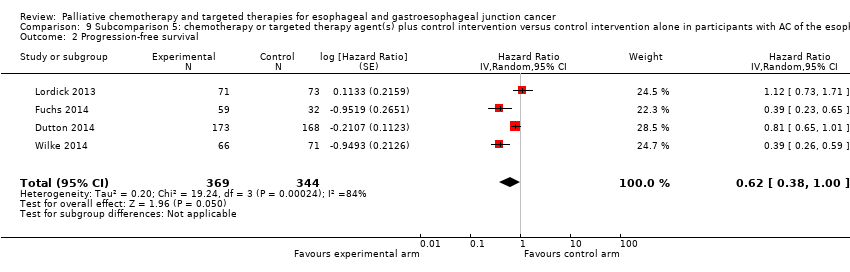
Comparison 9 Subcomparison 5: chemotherapy or targeted therapy agent(s) plus control intervention versus control intervention alone in participants with AC of the esophagus, Outcome 2 Progression‐free survival.

Comparison 10 Subcomparison 6: chemotherapy or targeted therapy agent(s) plus control arm versus control arm in participants with SCC of the esophagus, Outcome 1 Overall survival.

Comparison 10 Subcomparison 6: chemotherapy or targeted therapy agent(s) plus control arm versus control arm in participants with SCC of the esophagus, Outcome 2 Progression‐free survival.
| Chemotherapy or targeted therapy agent(s) plus control intervention versus control intervention alone for palliative treatment of esophageal and GE‐junction carcinoma | ||||
| Patient or population: palliative participants with esophageal and GE‐junction carcinoma Setting: hospital Intervention: chemotherapy or targeted therapy agent(s) plus control intervention Comparison: control intervention | ||||
| Outcome | Relative effect | No. of participants | Quality of the evidence | Comments |
| Overall survival | HR 0.75 (0.68 to 0.84) Median OS 6.7 months in the chemotherapy or targeted therapy agent(s) + control arm versus 5.7 months in the control arm | 1347 participants | ⊕⊕⊕⊕ | Quality not downgraded. Although participant populations and agents used differ between studies, there is low imprecision and low inconsistency. Cochrane's Q test for heterogeneity showed almost no heterogeneity (I2 = 5%, P = 0.50) |
| Progression‐free survival | HR 0.64 (0.45 to 0.92) | 883 participants (5 RCTs) | ⊕⊕⊕⊝ | Cochrane's Q test for heterogeneity showed considerable heterogeneity (I2 = 79%, P < 0.001) |
| Toxicity | Palliative chemotherapy and/or targeted therapy appear to increase the frequency of treatment‐related toxicity of at least grade 3. However, treatment‐related deaths did not occur more frequently. | For 3296 participants with esophageal, GE‐junction, and gastric cancer (9 RCTs) information was provided on toxicity according to WHO or NCI‐CTC guidelines. For at least 1189 participants with esophageal and GE‐junction cancer from these trials, toxicity was reported. | ⊕⊝⊝⊝ | Small sample size of studies reporting toxicity for the esophageal and GE‐junction cancer subgroup separately, for both arms, and with validated methods. Heterogeneity in the relative frequency of toxicities due to palliative chemotherapy and/or targeted therapy. |
| Quality of life | Quality of life was measured with validated methods in 5 studies included in this analysis. Although the 5 studies were not representative of all the studies in this analysis, as 4 tested a targeted agent, the quality of life reported improved in the arms with the additional agent. | For 1870 participants with esophageal, GE‐junction, and gastric cancer (5 RCTs), information was provided on quality of life. For at least 823 participants with esophageal and GE‐junction cancer, quality of life was reported. | ⊕⊝⊝⊝ | Small sample size of studies reporting data for the esophageal and GE‐junction cancer subgroup separately whilst using validated methods |
| CI: confidence interval; GE: gastroesophageal; HR: hazard ratio; NCI‐CTC: National Cancer Institute Common Toxicity Criteria; OS: overall survival; RCT: randomized controlled trial; WHO: World Health Organization. | ||||
| GRADE Working Group grades of evidence | ||||
| aDowngraded by one level due to inconsistency. | ||||
| Sensitivity analysis: chemotherapy or targeted therapy agent(s) plus control intervention versus control intervention alone for palliating esophageal and GE‐junction carcinoma versus gastric carcinoma | |||||
| Patient or population: palliative participants with esophageal and GE‐junction carcinoma or gastric carcinoma Setting: hospital Intervention: chemotherapy or targeted therapy agent(s) plus control arm Comparison: control arm | |||||
| Comparison | Outcome | Relative effect | No. of participants | Quality of the evidence | Comments |
| Studies with gastric cancer participants in addition to eligible participants | Overall survival | HR 0.94 (0.83 to 1.05) | 1755 participants (8 RCTs) | It should not be judged independently as it is not meant to be an exhaustive summary of either esophageal, GE‐junction, or gastric cancer participant data. | Cochrane's Q test for heterogeneity showed considerable heterogeneity (I2 = 54%, P = 0.03). |
| Sensitivity analysis, meta‐regression analysis, first part | Overall survival | HR 0.75 (0.68 to 0.84) versus HR 0.94 (0.83 to 1.05), P = 0.004 (treatment has a significantly different effect) | 1347 participants | ⊕⊝⊝⊝ | Cochrane's Q test for heterogeneity showed almost no heterogeneity (I2 = 5%, P = 0.50) in the arm with esophageal and GE‐junction cancer participants. Cochrane's Q test for heterogeneity showed considerable heterogeneity (I2 = 54%, P = 0.03) in the arm that included also gastric cancer participants. |
| Sensitivity analysis, only esophageal and GE‐junction cancer participants | Overall survival | HR 0.66 (0.54 to 0.81) | 538 participants (5 RCTs) | It should not be judged independently as it is not meant to be an exhaustive summary of either esophageal and GE‐junction participant data. | Cochrane's Q test for heterogeneity showed no heterogeneity (I2 = 0%, P = 0.56). This meta‐analysis was not meant to be exhaustive with regard to the effect of chemotherapy or targeted therapy in people with esophageal and GE‐junction cancer. |
| Sensitivity analysis, only gastric cancer participants | Overall survival | HR 0.89 (0.76 to 1.04) | 2093 participants (5 RCTs) | It should not be judged independently as it is not meant to be an exhaustive summary of gastric cancer participant data. | Cochrane's Q test for heterogeneity showed heterogeneity (I2 = 52%, P = 0.08). This meta‐analysis was not meant to be exhaustive with regard to the effect of chemotherapy or targeted therapy in people with gastric cancer. |
| Sensitivity analysis, meta‐regression analysis, second part | Overall survival | HR 0.66 (0.54 to 0.81) versus HR 0.89 (0.76 to 1.04), P = 0.03 (treatment has a significantly different effect) | 538 participants (5 RCTs) versus 2093 participants (5 RCTs) | ⊕⊕⊕⊝ | Cochrane's Q test for heterogeneity showed no heterogeneity (I2 = 0%, P = 0.56) in the arm with only GE‐junction cancer participants and heterogeneity (I2 = 52%, P = 0.08) in the arm with only gastric cancer participants. This result applies only to GE‐junction versus gastric cancer. |
| CI: confidence interval; GE: gastroesophageal; HR: hazard ratio; OS: overall survival; RCT: randomized controlled trial. | |||||
| GRADE Working Group grades of evidence | |||||
| aDowngraded by three levels due to inconsistency in the group of studies with gastric cancer participants besides eligible participants. Additionally, quality was downgraded because the interventions in both groups of studies were not similar, making the comparison indirect. | |||||
| Subcomparison 1: chemotherapy or targeted therapy plus best supportive care (BSC) versus BSC for palliative treatment of esophageal and GE‐junction carcinoma | ||||
| Patient or population: palliative participants with esophageal and GE‐junction carcinoma Setting: hospital Intervention: chemotherapy or targeted therapy plus BSC Comparison: BSC | ||||
| Outcomes | Relative effect | No. of participants | Quality of the evidence | Comments |
| Overall survival | HR 0.81 (0.71 to 0.92) Median OS 4.7 months in the chemotherapy or targeted therapy arm versus 4.2 months in the BSC arm | 750 (5 RCTs) | ⊕⊕⊕⊕ | Quality not downgraded. Participant populations and agents used differ between studies. However, there is low imprecision and low inconsistency. Cochrane's Q test for heterogeneity showed almost no heterogeneity (I2 = 0%, P = 0.57), indicating that results of the studies were consistent. |
| Progression‐free survival | HR 0.58 (0.28 to 1.18) | 540 (2 RCTs) | ⊕⊝⊝⊝ | 95% CI includes benefit and harm. Cochrane's Q test for heterogeneity showed considerable heterogeneity (I2 = 85%, P = 0.01). |
| Toxicity | Palliative chemotherapy and/or targeted therapy appear to increase the frequency of treatment‐related toxicity of at least grade 3. However, treatment‐related deaths did not occur more frequently. | For 972 participants with esophageal, GE‐junction, and gastric cancer (3 RCTs) information was provided on toxicity according to WHO or NCI‐CTC guidelines. For at least 632 participants with esophageal and GE‐junction cancer from these trials, toxicity was reported. | ⊕⊝⊝⊝ | 3/5 studies reported on toxicities with validated methods. 1/3 studies reporting on toxicity, reported it for the esophageal and GE‐junction cancer subgroup separately, for both arms and with validated methods. |
| Quality of life | On average, the quality of life reported improved in the arms with the additional agent. | For 1129 participants with esophageal, GE‐junction, and gastric cancer (4 RCTs) information was provided on quality of life. For at least 789 participants with esophageal and GE‐junction cancer, quality of life was reported. | ⊕⊝⊝⊝ | 4/5 studies reported on quality of life. 2/4 studies reported quality of life separately for the esophageal and GE‐junction cancer subgroup. |
| BSC: best supportive care; CI: confidence interval; GE: gastroesophageal; HR: hazard ratio; NCI‐CTC: National Cancer Institute Common Toxicity Criteria; OS: overall survival; RCT: randomized controlled trial; WHO: World Health Organization. | ||||
| GRADE Working Group grades of evidence | ||||
| aDowngraded by three levels due to very serious imprecision (small sample size, 95% CI includes appreciable benefit and harm) and serious inconsistency. | ||||
| Subcomparison 2: second‐line chemotherapy or targeted therapy agent(s) plus control intervention versus control intervention alone for palliative treatment of esophageal and GE‐junction carcinoma | ||||
| Patient or population: palliative participants with esophageal and GE‐junction carcinoma previously treated with chemotherapy Setting: hospital Intervention: chemotherapy or targeted therapy agent(s) plus control arm Comparison: control arm | ||||
| Outcomes | Relative effect | No. of participants | Quality of the evidence | Comments |
| Overall survival | HR 0.71 (0.54 to 0.94) Median OS 5.1 months in the chemotherapy or targeted therapy arm versus 4.4 months in the BSC arm | 769 participants (4 RCTs) | ⊕⊕⊕⊝ | 2 studies investigated the same agent. Cochrane's Q test for heterogeneity showed considerable heterogeneity (I2 = 57%, P = 0.07) |
| Progression‐free survival | HR 0.51 (0.29 to 0.90) | 677 participants (3 RCTs) | ⊕⊕⊝⊝ | 2 studies investigated the same agent. Cochrane's Q test for heterogeneity showed considerable heterogeneity (I2 = 86%, P < 0.001) |
| Toxicity | Palliative chemotherapy and/or targeted therapy appear to increase the frequency of treatment‐related toxicity of at least grade 3. However, treatment‐related deaths did not occur more frequently. | For 1638 participants with esophageal, GE‐junction, and gastric cancer (4 RCTs) information was provided on toxicity according to WHO or NCI‐CTC guidelines. For at least 769 participants with esophageal and GE‐junction cancer from these trials toxicity was reported. | ⊕⊝⊝⊝ | 1/4 studies reported toxicity for the esophageal and GE‐junction cancer subgroup separately, for both arms, and with validated methods. |
| Quality of life | On average, the quality of life reported improved in the arms with the additional agent. | For 1638 participants with esophageal, GE‐junction, and gastric cancer (4 RCTs) information was provided on quality of life. For at least 769 participants with esophageal and GE‐junction cancer, quality of life was reported. | ⊕⊝⊝⊝ | 1/4 studies reported quality of life separately for the esophageal and GE‐junction cancer subgroup. |
| CI: confidence interval; GE: gastroesophageal; HR: hazard ratio; NCI‐CTC: National Cancer Institute Common Toxicity Criteria; OS: overall survival; RCT: randomized controlled trial; WHO: World Health Organization. | ||||
| GRADE Working Group grades of evidence | ||||
| aDowngraded by one level due to small sample size and inconsistency. | ||||
| Subcomparison 3: chemotherapy agent(s) plus control intervention versus control intervention alone for palliative treatment of esophageal and GE‐junction carcinoma | ||||
| Patient or population: palliative participants with esophageal and GE‐junction carcinoma Setting: hospital Intervention: chemotherapy agent(s) plus control arm Comparison: control arm | ||||
| Outcome | Relative effect | No. of participants | Quality of the evidence | Comments |
| Overall survival | HR 0.73 (0.63 to 0.85) Median OS 6.9 months in the chemotherapy + control arm versus 5.8 months in the control arm. | 358 participants (5 RCTs) | ⊕⊕⊕⊝ | There is low imprecision and low inconsistency. Cochrane's Q test for heterogeneity showed low heterogeneity (I2 = 0%, P = 0.50). |
| Progression‐free survival | No data on progression‐free survival was available for this comparison. | |||
| Toxicity | Palliative chemotherapy and/or targeted therapy appear to increase the frequency of treatment‐related toxicity of at least grade 3. However, treatment‐related deaths did not occur more frequently. | For 1638 participants with esophageal, GE‐junction, and gastric cancer (4 RCTs) information was provided on toxicity according to WHO or NCI‐CTC guidelines. For at least 769 participants with esophageal and GE‐junction cancer from these trials toxicity was reported. | ⊕⊝⊝⊝ | 1/4 studies reported toxicity for the esophageal and GE‐junction cancer subgroup separately, for both arms, and with validated methods. |
| Quality of life | On average, the quality of life reported improved in the arms with the additional agent. | For 450 participants with esophageal and GE‐junction cancer, quality of life was reported. | ⊕⊝⊝⊝ | 4/5 studies reported on quality of life. 1/4 studies reported quality of life separately for the esophageal and GE‐junction cancer subgroup. |
| CI: confidence interval; GE: gastroesophageal; HR: hazard ratio; NCI‐CTC: National Cancer Institute Common Toxicity Criteria; OS: overall survival; RCT: randomized controlled trial; WHO: World Health Organization. | ||||
| GRADE Working Group grades of evidence | ||||
| aDowngraded by one level due to small sample size. | ||||
| Subcomparison 4: targeted therapy agent plus control intervention versus control intervention alone for palliative treatment of esophageal and GE‐junction carcinoma | |||||
| Patient or population: palliative participants with esophageal and GE‐junction carcinoma Setting: hospital Intervention: targeted therapy agent plus control arm Comparison: control arm | |||||
| Outcome | Comparison | Relative effect | No. of participants | Quality of the evidence | Comments |
| Overall survival | Subcomparison 4, targeted therapy | HR 0.75 (0.63 to 0.90) Median OS 6.7 months in the targeted therapy agent(s) + control arm versus 5.7 months in the control arm | 989 participants (6 RCTs) | ⊕⊕⊕⊕ | Quality not downgraded. Participant populations and agents used differ between studies. However, there is low imprecision and low inconsistency. Cochrane's Q test for heterogeneity showed low heterogeneity (I2 = 24%, P = 0.25). |
| Subcomparison 4a, EGFR‐targeting agents | HR 0.86 (95% CI 0.73 to 1.01) | 655 participants (3 RCTs) | ⊕⊕⊕⊝ | Cochrane's Q test for heterogeneity showed low heterogeneity (I2 = 0%, P = 0.56). | |
| Subcomparison 4b, cetuximab | HR 0.76 (95% CI 0.55 to 1.04) | 206 participants (2 RCTs) | ⊕⊕⊝⊝ | 95% CI includes benefit and harm. Cochrane's Q test for heterogeneity showed low heterogeneity (I2 = 0%, P = 0.58). | |
| Subcomparison 4c, ramucirumab | HR 0.62 (0.43 to 0.88) | 228 participants (2 RCTs) | ⊕⊕⊕⊝ | Cochrane's Q test for heterogeneity showed low heterogeneity (I2 = 28%, P = 0.24). | |
| Progression‐free survival | Subcomparison 4, targeted therapy | HR 0.64 (0.45 to 0.92) | 883 participants (5 RCTs) | ⊕⊕⊕⊝ | Cochrane's Q test for heterogeneity showed low heterogeneity (I2 = 79%, P < 0.001). |
| Subcomparison 4a, EGFR‐targeting agents | HR 0.85 (0.73 to 1.00) | 655 participants (3 RCTs) | ⊕⊕⊝⊝ | 95% CI includes benefit and lack of effect. Cochrane's Q test for heterogeneity showed low heterogeneity (I2 = 2%, P = 0.36). | |
| Subcomparison 4b, cetuximab | HR 0.90 (0.59 to 1.37) | 206 participants (2 RCTs) | ⊕⊝⊝⊝ | 95% CI includes benefit and harm. Cochrane's Q test for heterogeneity showed a moderate amount of heterogeneity (I2 = 53%, P = 0.14). One of the two studies was not blinded and did not use an independent review board. | |
| Subcomparison 4c, ramucirumab | HR 0.39 (0.28 to 0.54) | 228 participants (2 RCTs) | ⊕⊕⊕⊝ | Cochrane's Q test for heterogeneity showed low heterogeneity (I2 = 0%, P = 0.99). | |
| Toxicity | Subcomparison 4, targeted therapy | Palliative chemotherapy and/or targeted therapy appear to increase the frequency of treatment‐related toxicity of at least grade 3. However, treatment‐related deaths did not occur more frequently. | For 3020 participants with esophageal, GE‐junction, and gastric cancer (6 RCTs) information was provided on toxicity according to WHO or NCI‐CTC guidelines. For at least 990 participants with esophageal and GE‐junction cancer from these trials toxicity was reported. | ⊕⊝⊝⊝ | 2/6 studies reported toxicity for the esophageal and GE‐junction cancer subgroup separately, for both arms and with validated methods. |
| Quality of life | Subcomparison 4, targeted therapy | On average, the quality of life reported improved in the arms with the additional agent. | For 2054 participants with esophageal, GE‐junction, and gastric cancer (4 RCTs) information was provided on quality of life. For at least 784 participants with esophageal and GE‐junction cancer, quality of life was reported. | ⊕⊝⊝⊝ | 4/6 studies reported on quality of life. 1/4 studies reported quality of life separately for the esophageal and GE‐junction cancer subgroup. |
| CI: confidence interval; EGFR: epidermal growth factor receptor; GE: gastroesophageal; HR: hazard ratio; NCI‐CTC: National Cancer Institute Common Toxicity Criteria; OS: overall survival; RCT: randomized controlled trial; WHO: World Health Organization. | |||||
| GRADE Working Group grades of evidence | |||||
| aDowngraded by one level due to small sample size. | |||||
| Subcomparison 5: chemotherapy or targeted therapy agent(s) plus control intervention versus control intervention alone in participants with AC of the esophagus | ||||
| Patient or population: palliative participants with AC of the esophagus Setting: hospital Intervention: chemotherapy or targeted therapy plus BSC Comparison: BSC | ||||
| Outcomes | Relative effect | No. of participants | Quality of the evidence | Comments |
| Overall survival | HR 0.66 (0.54 to 0.81) Median OS 7.1 months in the chemotherapy or targeted therapy arm versus 6.0 months in the BSC arm | 538 (5 RCTs) | ⊕⊕⊕⊕ | Quality not downgraded. Participant populations and agents used differ between studies. However, there is low imprecision and low inconsistency. Cochrane's Q test for heterogeneity showed almost no heterogeneity (I2 = 0%, P = 0.55), indicating that results of the studies were consistent. |
| Progression‐free survival | HR 0.62 (0.38 to 1.00) | 713 (4 RCTs) | ⊕⊝⊝⊝ | 95% CI includes benefit and no effect. Cochrane's Q test for heterogeneity showed considerable heterogeneity (I2 = 84%, P < 0.001). |
| Toxicity | Palliative chemotherapy and/or targeted therapy appear to increase the frequency of treatment‐related toxicity of at least grade 3. However, treatment‐related deaths did not occur more frequently. | For 2676 participants with esophageal, GE‐junction, and gastric cancer (5 RCTs) information was provided on toxicity according to WHO or NCI‐CTC guidelines. For at least 570 participants with esophageal and GE‐junction cancer from these trials, toxicity was reported. | ⊕⊝⊝⊝ | 0/5 studies reported toxicity for the esophageal and GE‐junction cancer subgroup separately, for both arms, and with validated methods. |
| Quality of life | On average, the quality of life reported improved in the arms with the additional agent. | For 1772 participants with esophageal, GE‐junction, and gastric cancer (4 RCTs) information was provided on quality of life. For at least 426 participants with esophageal and GE‐junction cancer, quality of life was reported. | ⊕⊝⊝⊝ | 4/5 studies reported on quality of life. 0/4 studies reported quality of life separately for the esophageal and GE‐junction cancer subgroup. |
| AC: adenocarcinoma; BSC: best supportive care; CI: confidence interval; HR: hazard ratio; NCI‐CTC: National Cancer Institute Common Toxicity Criteria; OS: overall survival; RCT: randomized controlled trial; WHO: World Health Organization. | ||||
| GRADE Working Group grades of evidence | ||||
| a Downgraded three levels due to very serious imprecision (95% CI includes appreciable benefit and no effect) and serious inconsistency. | ||||
| Subcomparison 6: chemotherapy or targeted therapy agent(s) plus control intervention versus control intervention alone in participants with SCC of the esophagus | ||||
| Patient or population: palliative participants with SCC of the esophagus Setting: hospital Intervention: chemotherapy or targeted therapy plus BSC Comparison: BSC | ||||
| Outcomes | Relative effect | No. of participants | Quality of the evidence | Comments |
| Overall survival | HR 0.76 (95% CI 0.65 to 0.90) Median OS 8.0 months in the chemotherapy or targeted therapy arm versus 6.5 months in the BSC arm. | 268 (4 RCTs) | ⊕⊕⊕⊕ | Quality not downgraded. Participant populations and agents used differ between studies. However, there is low imprecision and low inconsistency. Cochrane's Q test for heterogeneity showed almost no heterogeneity (I2 = 0%, P = 0.95), indicating that results of the studies were consistent. |
| Progression‐free survival | HR 0.72 (95% CI 0.55 to 0.96) | 168 (2 RCTs) | ⊕⊝⊝⊝ | Cochrane's Q test for heterogeneity showed significant heterogeneity (I2 = 0%, P = 0.97), indicating that results of the 2 studies were not consistent. One of the 2 studies was not blinded and did not use an independent review board. |
| Toxicity | Palliative chemotherapy and/or targeted therapy appear to increase the frequency of treatment‐related toxicity of at least grade 3. However, treatment‐related deaths did not occur more frequently. | For 150 participants with esophageal and GE‐junction cancer (2 RCTs) information was provided on toxicity according to WHO or NCI‐CTC guidelines. | ⊕⊝⊝⊝ | 2/4 studies reported on toxicities with validated methods. 2/2 studies reporting toxicity for the esophageal and GE‐junction cancer subgroup separately, for both arms, and with validated methods. |
| Quality of life | On average, the quality of life reported improved in the arms with the additional agent. | For 156 participants with esophageal and GE‐junction cancer (1 RCT) information was provided on quality of life. | ⊕⊝⊝⊝ | 1/4 studies reported on quality of life. |
| BSC: best supportive care; CI: confidence interval; GE: gastro‐esophageal; HR: hazard ratio; NCI‐CTC: National Cancer Institute Common Toxicity Criteria; OS: overall survival; RCT: randomized controlled trial; SCC: squamous cell carcinoma; WHO: World Health Organization. | ||||
| GRADE Working Group grades of evidence | ||||
| aDowngraded by two levels due to small sample size, and one level due lack of blinding or use of an independent review board. | ||||
| Outcome or subgroup title | No. of studies | No. of participants | Statistical method | Effect size |
| 1 Overall survival Show forest plot | 11 | 1347 | Hazard Ratio (Random, 95% CI) | 0.75 [0.68, 0.84] |
| 1.1 Subcomparison 3: chemotherapeutic agent(s) plus control intervention versus control intervention alone | 5 | 358 | Hazard Ratio (Random, 95% CI) | 0.73 [0.63, 0.85] |
| 1.2 Subcomparison 4: targeted therapy agent plus control intervention versus control intervention alone | 6 | 989 | Hazard Ratio (Random, 95% CI) | 0.75 [0.63, 0.90] |
| 2 Progression‐free survival Show forest plot | 5 | Hazard Ratio (Random, 95% CI) | Subtotals only | |
| 2.1 Subcomparison 4: targeted therapy agent plus control intervention versus control intervention alone | 5 | 883 | Hazard Ratio (Random, 95% CI) | 0.64 [0.45, 0.92] |
| Outcome or subgroup title | No. of studies | No. of participants | Statistical method | Effect size |
| 1 Overall survival Show forest plot | 8 | 1755 | Hazard Ratio (Random, 95% CI) | 0.94 [0.83, 1.05] |
| Outcome or subgroup title | No. of studies | No. of participants | Statistical method | Effect size |
| 1 Overall survival, GE‐junction cancer outcomes Show forest plot | 5 | 538 | Hazard Ratio (Random, 95% CI) | 0.66 [0.54, 0.81] |
| 2 Overall survival, gastric cancer outcomes Show forest plot | 5 | 2093 | Hazard Ratio (Random, 95% CI) | 0.89 [0.76, 1.04] |
| Outcome or subgroup title | No. of studies | No. of participants | Statistical method | Effect size |
| 1 Overall survival Show forest plot | 5 | 750 | Hazard Ratio (Random, 95% CI) | 0.81 [0.71, 0.92] |
| 2 Progression‐free survival Show forest plot | 2 | 540 | Hazard Ratio (Random, 95% CI) | 0.58 [0.28, 1.18] |
| Outcome or subgroup title | No. of studies | No. of participants | Statistical method | Effect size |
| 1 Overall survival Show forest plot | 4 | 769 | Hazard Ratio (Random, 95% CI) | 0.71 [0.54, 0.94] |
| 2 Progression‐free survival Show forest plot | 3 | 677 | Hazard Ratio (Random, 95% CI) | 0.51 [0.29, 0.90] |
| Outcome or subgroup title | No. of studies | No. of participants | Statistical method | Effect size |
| 1 Overall survival Show forest plot | 3 | 655 | Hazard Ratio (Random, 95% CI) | 0.86 [0.73, 1.01] |
| 2 Progression‐free survival Show forest plot | 3 | 655 | Hazard Ratio (Random, 95% CI) | 0.85 [0.73, 1.00] |
| Outcome or subgroup title | No. of studies | No. of participants | Statistical method | Effect size |
| 1 Overall survival Show forest plot | 2 | 206 | Hazard Ratio (Random, 95% CI) | 0.76 [0.55, 1.04] |
| 2 Progression‐free survival Show forest plot | 2 | 206 | Hazard Ratio (Random, 95% CI) | 0.90 [0.59, 1.37] |
| Outcome or subgroup title | No. of studies | No. of participants | Statistical method | Effect size |
| 1 Overall survival Show forest plot | 2 | 228 | Hazard Ratio (Random, 95% CI) | 0.62 [0.43, 0.88] |
| 2 Progression‐free survival Show forest plot | 2 | 228 | Hazard Ratio (Random, 95% CI) | 0.39 [0.28, 0.54] |
| Outcome or subgroup title | No. of studies | No. of participants | Statistical method | Effect size |
| 1 Overall survival Show forest plot | 5 | 538 | Hazard Ratio (Random, 95% CI) | 0.66 [0.54, 0.81] |
| 2 Progression‐free survival Show forest plot | 4 | 713 | Hazard Ratio (Random, 95% CI) | 0.62 [0.38, 1.00] |
| Outcome or subgroup title | No. of studies | No. of participants | Statistical method | Effect size |
| 1 Overall survival Show forest plot | 4 | 268 | Hazard Ratio (Random, 95% CI) | 0.76 [0.65, 0.90] |
| 2 Progression‐free survival Show forest plot | 2 | 168 | Hazard Ratio (Random, 95% CI) | 0.72 [0.55, 0.96] |