| Subcomparison 4: targeted therapy agent plus control intervention versus control intervention alone for palliative treatment of esophageal and GE‐junction carcinoma |
| Patient or population: palliative participants with esophageal and GE‐junction carcinoma Setting: hospital Intervention: targeted therapy agent plus control arm Comparison: control arm |
| Overall survival | Subcomparison 4, targeted therapy | HR 0.75 (0.63 to 0.90) Median OS 6.7 months in the targeted therapy agent(s) + control arm versus 5.7 months in the control arm | 989 participants (6 RCTs) | ⊕⊕⊕⊕
High | Quality not downgraded. Participant populations and agents used differ between studies. However, there is low imprecision and low inconsistency. Cochrane's Q test for heterogeneity showed low heterogeneity (I2 = 24%, P = 0.25). |
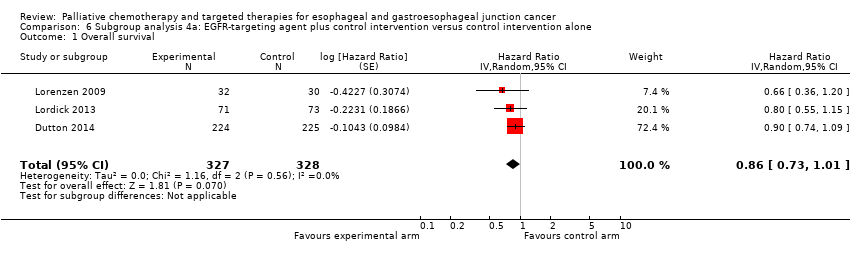
| Subcomparison 4a, EGFR‐targeting agents | HR 0.86 (95% CI 0.73 to 1.01) | 655 participants (3 RCTs) | ⊕⊕⊕⊝
Moderatea | Cochrane's Q test for heterogeneity showed low heterogeneity (I2 = 0%, P = 0.56). |
| Subcomparison 4b, cetuximab | HR 0.76 (95% CI 0.55 to 1.04) | 206 participants (2 RCTs) | ⊕⊕⊝⊝
Lowb | 95% CI includes benefit and harm. Cochrane's Q test for heterogeneity showed low heterogeneity (I2 = 0%, P = 0.58). |
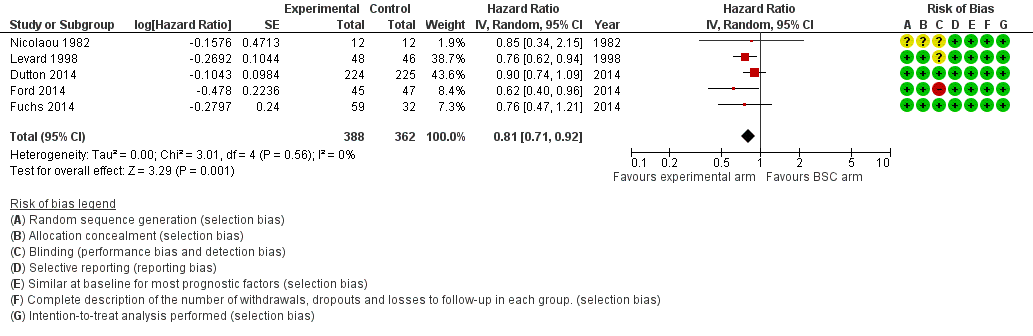
| Subcomparison 4c, ramucirumab | HR 0.62 (0.43 to 0.88) | 228 participants (2 RCTs) | ⊕⊕⊕⊝
Moderatea | Cochrane's Q test for heterogeneity showed low heterogeneity (I2 = 28%, P = 0.24). |
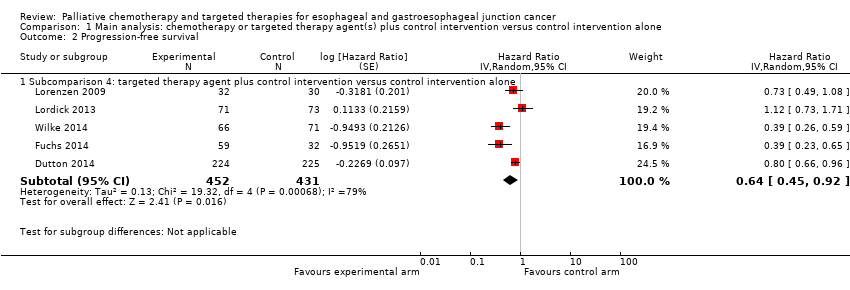
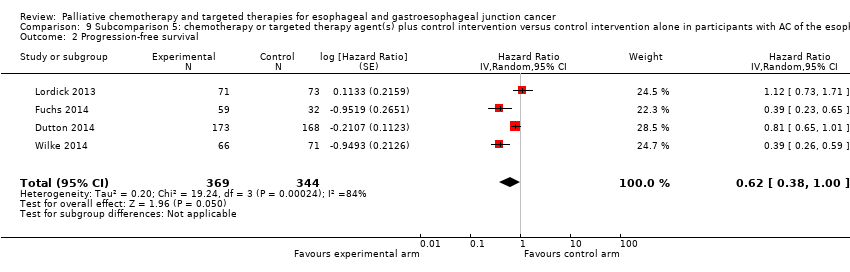
| Progression‐free survival | Subcomparison 4, targeted therapy | HR 0.64 (0.45 to 0.92) | 883 participants (5 RCTs) | ⊕⊕⊕⊝
Moderatec | Cochrane's Q test for heterogeneity showed low heterogeneity (I2 = 79%, P < 0.001). |
| Subcomparison 4a, EGFR‐targeting agents | HR 0.85 (0.73 to 1.00) | 655 participants (3 RCTs) | ⊕⊕⊝⊝
Lowb | 95% CI includes benefit and lack of effect. Cochrane's Q test for heterogeneity showed low heterogeneity (I2 = 2%, P = 0.36). |
| Subcomparison 4b, cetuximab | HR 0.90 (0.59 to 1.37) | 206 participants (2 RCTs) | ⊕⊝⊝⊝
Very lowd | 95% CI includes benefit and harm. Cochrane's Q test for heterogeneity showed a moderate amount of heterogeneity (I2 = 53%, P = 0.14). One of the two studies was not blinded and did not use an independent review board. |
| Subcomparison 4c, ramucirumab | HR 0.39 (0.28 to 0.54) | 228 participants (2 RCTs) | ⊕⊕⊕⊝
Moderatea | Cochrane's Q test for heterogeneity showed low heterogeneity (I2 = 0%, P = 0.99). |
| Toxicity | Subcomparison 4, targeted therapy | Palliative chemotherapy and/or targeted therapy appear to increase the frequency of treatment‐related toxicity of at least grade 3. However, treatment‐related deaths did not occur more frequently. | For 3020 participants with esophageal, GE‐junction, and gastric cancer (6 RCTs) information was provided on toxicity according to WHO or NCI‐CTC guidelines. For at least 990 participants with esophageal and GE‐junction cancer from these trials toxicity was reported. | ⊕⊝⊝⊝
Very lowe | 2/6 studies reported toxicity for the esophageal and GE‐junction cancer subgroup separately, for both arms and with validated methods. |
| Quality of life | Subcomparison 4, targeted therapy | On average, the quality of life reported improved in the arms with the additional agent. | For 2054 participants with esophageal, GE‐junction, and gastric cancer (4 RCTs) information was provided on quality of life. For at least 784 participants with esophageal and GE‐junction cancer, quality of life was reported. | ⊕⊝⊝⊝
Very lowf | 4/6 studies reported on quality of life. 1/4 studies reported quality of life separately for the esophageal and GE‐junction cancer subgroup. |
| CI: confidence interval; EGFR: epidermal growth factor receptor; GE: gastroesophageal; HR: hazard ratio; NCI‐CTC: National Cancer Institute Common Toxicity Criteria; OS: overall survival; RCT: randomized controlled trial; WHO: World Health Organization. |
| GRADE Working Group grades of evidence
High quality: further research is very unlikely to change our confidence in the estimate of effect.
Moderate quality: further research is likely to have an important impact on our confidence in the estimate of effect and may change the estimate.
Low quality: further research is very likely to have an important impact on our confidence in the estimate of effect and is likely to change the estimate.
Very low quality: we are very uncertain about the estimate. |