Quimioterapia paliativa y tratamientos dirigidos para el cáncer esofágico y de la unión gastroesofágica
Resumen
Antecedentes
Casi la mitad de los pacientes con cáncer esofágico o de la unión gastroesofágica presentan enfermedad metastásica al momento del diagnóstico. La quimioterapia y los tratamientos dirigidos se utilizan cada vez más con una intención paliativa para controlar el crecimiento tumoral, mejorar la calidad de vida y prolongar la supervivencia. Hasta la fecha, y con excepción del ramucirumab, falta evidencia de la eficacia de los tratamientos paliativos para el cáncer esofágico y gastroesofágico.
Objetivos
Evaluar los efectos del tratamiento citostático o dirigido para tratar el cáncer esofágico o de la unión gastroesofágica con intención paliativa.
Métodos de búsqueda
Se hicieron búsquedas en el Registro Cochrane Central de Ensayos Controlados (Cochrane Central Register of Controlled Trials) (CENTRAL), MEDLINE, Embase, Web of Science, PubMed Publisher, Google Scholar y en registros de ensayos hasta el 13 mayo 2015, y se hicieron búsquedas manuales en las listas de referencias de estudios. No se restringió la búsqueda a publicaciones en inglés. Se realizaron búsquedas adicionales en septiembre de 2017 antes de la publicación, y se enumeran en la sección "Estudios pendientes de evaluación".
Criterios de selección
Se incluyeron los ensayos controlados aleatorios (ECA) sobre quimioterapia paliativa o tratamiento dirigido versus mejor tratamiento médico de apoyo o control en pacientes con cáncer esofágico o de la unión gastroesofágica.
Obtención y análisis de los datos
Dos autores de la revisión extrajeron los datos de forma independiente. Se evaluó la calidad y el riesgo de sesgo de los estudios elegibles de acuerdo con el Manual Cochrane para Revisiones Sistemáticas de Intervenciones (Cochrane Handbook for Systematic Reviews of Interventions). Para el metanálisis se calcularon las estimaciones agrupadas del efecto mediante el modelo de efectos aleatorios de la varianza inversa.
Resultados principales
Se identificaron 41 ECA con 11 853 participantes para su inclusión en la revisión, así como 49 estudios en curso. En la comparación principal de agregar un agente citostático o dirigido a un brazo control se incluyeron 11 estudios con 1347 participantes. Este análisis demostró un aumento en la supervivencia general a favor del brazo con un agente terapéutico citostático o dirigido adicional con un cociente de riesgos instantáneos (CRI) de 0,75 (intervalo de confianza [IC] del 95%: 0,68 a 0,84; evidencia de alta calidad). La mediana del aumento del tiempo de supervivencia fue un mes. Cinco estudios con 750 participantes contribuyeron con datos a la comparación de tratamiento paliativo versus el mejor tratamiento médico de apoyo. Se encontró un efecto beneficioso en la supervivencia general a favor del grupo que recibió quimioterapia paliativa o dirigida en comparación con el mejor tratamiento médico de apoyo (CRI 0,81; IC del 95%: 0,71 a 0,92; evidencia de alta calidad). Todas las subcomparaciones que incluyeron solamente a los pacientes que recibieron tratamientos de segunda línea, quimioterapias, tratamientos dirigidos, y presentaban adenocarcinomas y carcinomas de células escamosas mostraron un efecto beneficioso similar. El único agente individual que más de un estudio encontró que mejoró la supervivencia general y la supervivencia libre de progresión fue el ramucirumab. La quimioterapia paliativa y el tratamiento dirigido aumentaron la frecuencia de toxicidad relacionada con el tratamiento de grado 3 o mayor. Sin embargo, no ocurrieron con mayor frecuencia muertes relacionadas con el tratamiento. La calidad de vida a menudo mejoró en el brazo con un agente adicional.
Conclusiones de los autores
Los pacientes que reciben más agentes quimioterapéuticos o agentes terapéuticos dirigidos tienen una mayor supervivencia general en comparación con los pacientes que reciben menos. Estos agentes, administrados como tratamientos de primera línea o de segunda línea, también dan lugar a una mejor supervivencia general que el mejor tratamiento médico de apoyo. Con la excepción de ramucirumab, todavía no está claro qué otros agentes individuales tienen un efecto beneficioso en la supervivencia. Aunque los efectos tóxicos relacionados con el tratamiento de grado 3 o mayor ocurrieron con mayor frecuencia en los brazos con un agente quimioterapéutico o de tratamiento dirigido adicional, no hay evidencia de que la quimioterapia paliativa y el tratamiento dirigido disminuyan la calidad de vida. Según este metanálisis, la quimioterapia paliativa y el tratamiento dirigido se pueden considerar la atención estándar para el carcinoma esofágico y de la unión gastroesofágica.
PICO
Resumen en términos sencillos
Quimioterapia paliativa y tratamientos dirigidos (sin intención de curación) para el cáncer en el esófago o de la unión gastroesofágica
Pregunta de la revisión
Esta revisión intentó investigar la efectividad de agregar tratamiento citostático o dirigido al tratamiento médico de apoyo en pacientes con cáncer esofágico o de la unión gastroesofágica.
Antecedentes
El cáncer esofágico es el octavo cáncer más frecuente en el mundo. Muchas personas se diagnostican solo después que la enfermedad se ha diseminado a otras partes del cuerpo, cuando la curación rara vez es posible. Estos pacientes pueden ser tratados con quimioterapia paliativa o tratamiento dirigido (un fármaco dirigido contra un componente específico del tumor). El objetivo de este tratamiento es controlar el crecimiento tumoral y aumentar la supervivencia, sin disminuir significativamente la calidad de vida.
Características de los estudios
Se buscó en listas de referencias, bases de datos biomédicas (Registro Cochrane Central de Ensayos Controlados (CENTRAL), MEDLINE, Embase, Web of Science, PubMed Publsiher y Google Scholar), y en registros de ensayos hasta el 13 de mayo de 2015. Se realizaron búsquedas adicionales en septiembre de 2017 antes de la publicación, y se enumeran en la sección "Estudios pendientes de evaluación".
Resultados clave
Se identificaron 41 ensayos controlados aleatorios (ECA) que cumplieron los criterios de inclusión para su inclusión en la revisión, así como 49 estudios en curso. Esta revisión y metanálisis muestran que los pacientes que reciben más agentes quimioterapéuticos o agentes terapéuticos dirigidos viven más tiempo y con menos progresión de la enfermedad que los pacientes que reciben el mejor tratamiento médico de apoyo o menos tratamiento. El único agente individual que más de un estudio encontró que mejora la supervivencia fue ramucirumab. Se encontraron efectos tóxicos graves relacionados con el tratamiento (de grado 3 o mayor) con mayor frecuencia en los brazos con un agente quimioterapéutico o de tratamiento dirigido adicional. Sin embargo, no existe evidencia de que la quimioterapia paliativa y el tratamiento dirigido reduzcan la calidad de vida. El metanálisis de esta revisión indica que la quimioterapia y el tratamiento dirigido son tratamientos paliativos efectivos en los pacientes con cáncer esofágico y de la unión gastroesofágica.
Calidad de la evidencia
La evidencia de que más agentes quimioterapéuticos o agentes terapéuticos dirigidos aumentan la supervivencia es de alta calidad, así como la evidencia de una mejoría en la supervivencia en comparación con el mejor tratamiento médico de apoyo. La evidencia de un aumento en la aparición de efectos tóxicos graves relacionados con el tratamiento es de muy baja calidad, mientras que la evidencia que muestra ninguna disminución en la calidad de vida también es de baja calidad.
Conclusiones de los autores
Summary of findings
| Chemotherapy or targeted therapy agent(s) plus control intervention versus control intervention alone for palliative treatment of esophageal and GE‐junction carcinoma | ||||
| Patient or population: palliative participants with esophageal and GE‐junction carcinoma Setting: hospital Intervention: chemotherapy or targeted therapy agent(s) plus control intervention Comparison: control intervention | ||||
| Outcome | Relative effect | No. of participants | Quality of the evidence | Comments |
| Overall survival | HR 0.75 (0.68 to 0.84) Median OS 6.7 months in the chemotherapy or targeted therapy agent(s) + control arm versus 5.7 months in the control arm | 1347 participants | ⊕⊕⊕⊕ | Quality not downgraded. Although participant populations and agents used differ between studies, there is low imprecision and low inconsistency. Cochrane's Q test for heterogeneity showed almost no heterogeneity (I2 = 5%, P = 0.50) |
| Progression‐free survival | HR 0.64 (0.45 to 0.92) | 883 participants (5 RCTs) | ⊕⊕⊕⊝ | Cochrane's Q test for heterogeneity showed considerable heterogeneity (I2 = 79%, P < 0.001) |
| Toxicity | Palliative chemotherapy and/or targeted therapy appear to increase the frequency of treatment‐related toxicity of at least grade 3. However, treatment‐related deaths did not occur more frequently. | For 3296 participants with esophageal, GE‐junction, and gastric cancer (9 RCTs) information was provided on toxicity according to WHO or NCI‐CTC guidelines. For at least 1189 participants with esophageal and GE‐junction cancer from these trials, toxicity was reported. | ⊕⊝⊝⊝ | Small sample size of studies reporting toxicity for the esophageal and GE‐junction cancer subgroup separately, for both arms, and with validated methods. Heterogeneity in the relative frequency of toxicities due to palliative chemotherapy and/or targeted therapy. |
| Quality of life | Quality of life was measured with validated methods in 5 studies included in this analysis. Although the 5 studies were not representative of all the studies in this analysis, as 4 tested a targeted agent, the quality of life reported improved in the arms with the additional agent. | For 1870 participants with esophageal, GE‐junction, and gastric cancer (5 RCTs), information was provided on quality of life. For at least 823 participants with esophageal and GE‐junction cancer, quality of life was reported. | ⊕⊝⊝⊝ | Small sample size of studies reporting data for the esophageal and GE‐junction cancer subgroup separately whilst using validated methods |
| CI: confidence interval; GE: gastroesophageal; HR: hazard ratio; NCI‐CTC: National Cancer Institute Common Toxicity Criteria; OS: overall survival; RCT: randomized controlled trial; WHO: World Health Organization. | ||||
| GRADE Working Group grades of evidence | ||||
| aDowngraded by one level due to inconsistency. | ||||
| Sensitivity analysis: chemotherapy or targeted therapy agent(s) plus control intervention versus control intervention alone for palliating esophageal and GE‐junction carcinoma versus gastric carcinoma | |||||
| Patient or population: palliative participants with esophageal and GE‐junction carcinoma or gastric carcinoma Setting: hospital Intervention: chemotherapy or targeted therapy agent(s) plus control arm Comparison: control arm | |||||
| Comparison | Outcome | Relative effect | No. of participants | Quality of the evidence | Comments |
| Studies with gastric cancer participants in addition to eligible participants | Overall survival | HR 0.94 (0.83 to 1.05) | 1755 participants (8 RCTs) | It should not be judged independently as it is not meant to be an exhaustive summary of either esophageal, GE‐junction, or gastric cancer participant data. | Cochrane's Q test for heterogeneity showed considerable heterogeneity (I2 = 54%, P = 0.03). |
| Sensitivity analysis, meta‐regression analysis, first part | Overall survival | HR 0.75 (0.68 to 0.84) versus HR 0.94 (0.83 to 1.05), P = 0.004 (treatment has a significantly different effect) | 1347 participants | ⊕⊝⊝⊝ | Cochrane's Q test for heterogeneity showed almost no heterogeneity (I2 = 5%, P = 0.50) in the arm with esophageal and GE‐junction cancer participants. Cochrane's Q test for heterogeneity showed considerable heterogeneity (I2 = 54%, P = 0.03) in the arm that included also gastric cancer participants. |
| Sensitivity analysis, only esophageal and GE‐junction cancer participants | Overall survival | HR 0.66 (0.54 to 0.81) | 538 participants (5 RCTs) | It should not be judged independently as it is not meant to be an exhaustive summary of either esophageal and GE‐junction participant data. | Cochrane's Q test for heterogeneity showed no heterogeneity (I2 = 0%, P = 0.56). This meta‐analysis was not meant to be exhaustive with regard to the effect of chemotherapy or targeted therapy in people with esophageal and GE‐junction cancer. |
| Sensitivity analysis, only gastric cancer participants | Overall survival | HR 0.89 (0.76 to 1.04) | 2093 participants (5 RCTs) | It should not be judged independently as it is not meant to be an exhaustive summary of gastric cancer participant data. | Cochrane's Q test for heterogeneity showed heterogeneity (I2 = 52%, P = 0.08). This meta‐analysis was not meant to be exhaustive with regard to the effect of chemotherapy or targeted therapy in people with gastric cancer. |
| Sensitivity analysis, meta‐regression analysis, second part | Overall survival | HR 0.66 (0.54 to 0.81) versus HR 0.89 (0.76 to 1.04), P = 0.03 (treatment has a significantly different effect) | 538 participants (5 RCTs) versus 2093 participants (5 RCTs) | ⊕⊕⊕⊝ | Cochrane's Q test for heterogeneity showed no heterogeneity (I2 = 0%, P = 0.56) in the arm with only GE‐junction cancer participants and heterogeneity (I2 = 52%, P = 0.08) in the arm with only gastric cancer participants. This result applies only to GE‐junction versus gastric cancer. |
| CI: confidence interval; GE: gastroesophageal; HR: hazard ratio; OS: overall survival; RCT: randomized controlled trial. | |||||
| GRADE Working Group grades of evidence | |||||
| aDowngraded by three levels due to inconsistency in the group of studies with gastric cancer participants besides eligible participants. Additionally, quality was downgraded because the interventions in both groups of studies were not similar, making the comparison indirect. | |||||
| Subcomparison 1: chemotherapy or targeted therapy plus best supportive care (BSC) versus BSC for palliative treatment of esophageal and GE‐junction carcinoma | ||||
| Patient or population: palliative participants with esophageal and GE‐junction carcinoma Setting: hospital Intervention: chemotherapy or targeted therapy plus BSC Comparison: BSC | ||||
| Outcomes | Relative effect | No. of participants | Quality of the evidence | Comments |
| Overall survival | HR 0.81 (0.71 to 0.92) Median OS 4.7 months in the chemotherapy or targeted therapy arm versus 4.2 months in the BSC arm | 750 (5 RCTs) | ⊕⊕⊕⊕ | Quality not downgraded. Participant populations and agents used differ between studies. However, there is low imprecision and low inconsistency. Cochrane's Q test for heterogeneity showed almost no heterogeneity (I2 = 0%, P = 0.57), indicating that results of the studies were consistent. |
| Progression‐free survival | HR 0.58 (0.28 to 1.18) | 540 (2 RCTs) | ⊕⊝⊝⊝ | 95% CI includes benefit and harm. Cochrane's Q test for heterogeneity showed considerable heterogeneity (I2 = 85%, P = 0.01). |
| Toxicity | Palliative chemotherapy and/or targeted therapy appear to increase the frequency of treatment‐related toxicity of at least grade 3. However, treatment‐related deaths did not occur more frequently. | For 972 participants with esophageal, GE‐junction, and gastric cancer (3 RCTs) information was provided on toxicity according to WHO or NCI‐CTC guidelines. For at least 632 participants with esophageal and GE‐junction cancer from these trials, toxicity was reported. | ⊕⊝⊝⊝ | 3/5 studies reported on toxicities with validated methods. 1/3 studies reporting on toxicity, reported it for the esophageal and GE‐junction cancer subgroup separately, for both arms and with validated methods. |
| Quality of life | On average, the quality of life reported improved in the arms with the additional agent. | For 1129 participants with esophageal, GE‐junction, and gastric cancer (4 RCTs) information was provided on quality of life. For at least 789 participants with esophageal and GE‐junction cancer, quality of life was reported. | ⊕⊝⊝⊝ | 4/5 studies reported on quality of life. 2/4 studies reported quality of life separately for the esophageal and GE‐junction cancer subgroup. |
| BSC: best supportive care; CI: confidence interval; GE: gastroesophageal; HR: hazard ratio; NCI‐CTC: National Cancer Institute Common Toxicity Criteria; OS: overall survival; RCT: randomized controlled trial; WHO: World Health Organization. | ||||
| GRADE Working Group grades of evidence | ||||
| aDowngraded by three levels due to very serious imprecision (small sample size, 95% CI includes appreciable benefit and harm) and serious inconsistency. | ||||
| Subcomparison 2: second‐line chemotherapy or targeted therapy agent(s) plus control intervention versus control intervention alone for palliative treatment of esophageal and GE‐junction carcinoma | ||||
| Patient or population: palliative participants with esophageal and GE‐junction carcinoma previously treated with chemotherapy Setting: hospital Intervention: chemotherapy or targeted therapy agent(s) plus control arm Comparison: control arm | ||||
| Outcomes | Relative effect | No. of participants | Quality of the evidence | Comments |
| Overall survival | HR 0.71 (0.54 to 0.94) Median OS 5.1 months in the chemotherapy or targeted therapy arm versus 4.4 months in the BSC arm | 769 participants (4 RCTs) | ⊕⊕⊕⊝ | 2 studies investigated the same agent. Cochrane's Q test for heterogeneity showed considerable heterogeneity (I2 = 57%, P = 0.07) |
| Progression‐free survival | HR 0.51 (0.29 to 0.90) | 677 participants (3 RCTs) | ⊕⊕⊝⊝ | 2 studies investigated the same agent. Cochrane's Q test for heterogeneity showed considerable heterogeneity (I2 = 86%, P < 0.001) |
| Toxicity | Palliative chemotherapy and/or targeted therapy appear to increase the frequency of treatment‐related toxicity of at least grade 3. However, treatment‐related deaths did not occur more frequently. | For 1638 participants with esophageal, GE‐junction, and gastric cancer (4 RCTs) information was provided on toxicity according to WHO or NCI‐CTC guidelines. For at least 769 participants with esophageal and GE‐junction cancer from these trials toxicity was reported. | ⊕⊝⊝⊝ | 1/4 studies reported toxicity for the esophageal and GE‐junction cancer subgroup separately, for both arms, and with validated methods. |
| Quality of life | On average, the quality of life reported improved in the arms with the additional agent. | For 1638 participants with esophageal, GE‐junction, and gastric cancer (4 RCTs) information was provided on quality of life. For at least 769 participants with esophageal and GE‐junction cancer, quality of life was reported. | ⊕⊝⊝⊝ | 1/4 studies reported quality of life separately for the esophageal and GE‐junction cancer subgroup. |
| CI: confidence interval; GE: gastroesophageal; HR: hazard ratio; NCI‐CTC: National Cancer Institute Common Toxicity Criteria; OS: overall survival; RCT: randomized controlled trial; WHO: World Health Organization. | ||||
| GRADE Working Group grades of evidence | ||||
| aDowngraded by one level due to small sample size and inconsistency. | ||||
| Subcomparison 3: chemotherapy agent(s) plus control intervention versus control intervention alone for palliative treatment of esophageal and GE‐junction carcinoma | ||||
| Patient or population: palliative participants with esophageal and GE‐junction carcinoma Setting: hospital Intervention: chemotherapy agent(s) plus control arm Comparison: control arm | ||||
| Outcome | Relative effect | No. of participants | Quality of the evidence | Comments |
| Overall survival | HR 0.73 (0.63 to 0.85) Median OS 6.9 months in the chemotherapy + control arm versus 5.8 months in the control arm. | 358 participants (5 RCTs) | ⊕⊕⊕⊝ | There is low imprecision and low inconsistency. Cochrane's Q test for heterogeneity showed low heterogeneity (I2 = 0%, P = 0.50). |
| Progression‐free survival | No data on progression‐free survival was available for this comparison. | |||
| Toxicity | Palliative chemotherapy and/or targeted therapy appear to increase the frequency of treatment‐related toxicity of at least grade 3. However, treatment‐related deaths did not occur more frequently. | For 1638 participants with esophageal, GE‐junction, and gastric cancer (4 RCTs) information was provided on toxicity according to WHO or NCI‐CTC guidelines. For at least 769 participants with esophageal and GE‐junction cancer from these trials toxicity was reported. | ⊕⊝⊝⊝ | 1/4 studies reported toxicity for the esophageal and GE‐junction cancer subgroup separately, for both arms, and with validated methods. |
| Quality of life | On average, the quality of life reported improved in the arms with the additional agent. | For 450 participants with esophageal and GE‐junction cancer, quality of life was reported. | ⊕⊝⊝⊝ | 4/5 studies reported on quality of life. 1/4 studies reported quality of life separately for the esophageal and GE‐junction cancer subgroup. |
| CI: confidence interval; GE: gastroesophageal; HR: hazard ratio; NCI‐CTC: National Cancer Institute Common Toxicity Criteria; OS: overall survival; RCT: randomized controlled trial; WHO: World Health Organization. | ||||
| GRADE Working Group grades of evidence | ||||
| aDowngraded by one level due to small sample size. | ||||
| Subcomparison 4: targeted therapy agent plus control intervention versus control intervention alone for palliative treatment of esophageal and GE‐junction carcinoma | |||||
| Patient or population: palliative participants with esophageal and GE‐junction carcinoma Setting: hospital Intervention: targeted therapy agent plus control arm Comparison: control arm | |||||
| Outcome | Comparison | Relative effect | No. of participants | Quality of the evidence | Comments |
| Overall survival | Subcomparison 4, targeted therapy | HR 0.75 (0.63 to 0.90) Median OS 6.7 months in the targeted therapy agent(s) + control arm versus 5.7 months in the control arm | 989 participants (6 RCTs) | ⊕⊕⊕⊕ | Quality not downgraded. Participant populations and agents used differ between studies. However, there is low imprecision and low inconsistency. Cochrane's Q test for heterogeneity showed low heterogeneity (I2 = 24%, P = 0.25). |
| Subcomparison 4a, EGFR‐targeting agents | HR 0.86 (95% CI 0.73 to 1.01) | 655 participants (3 RCTs) | ⊕⊕⊕⊝ | Cochrane's Q test for heterogeneity showed low heterogeneity (I2 = 0%, P = 0.56). | |
| Subcomparison 4b, cetuximab | HR 0.76 (95% CI 0.55 to 1.04) | 206 participants (2 RCTs) | ⊕⊕⊝⊝ | 95% CI includes benefit and harm. Cochrane's Q test for heterogeneity showed low heterogeneity (I2 = 0%, P = 0.58). | |
| Subcomparison 4c, ramucirumab | HR 0.62 (0.43 to 0.88) | 228 participants (2 RCTs) | ⊕⊕⊕⊝ | Cochrane's Q test for heterogeneity showed low heterogeneity (I2 = 28%, P = 0.24). | |
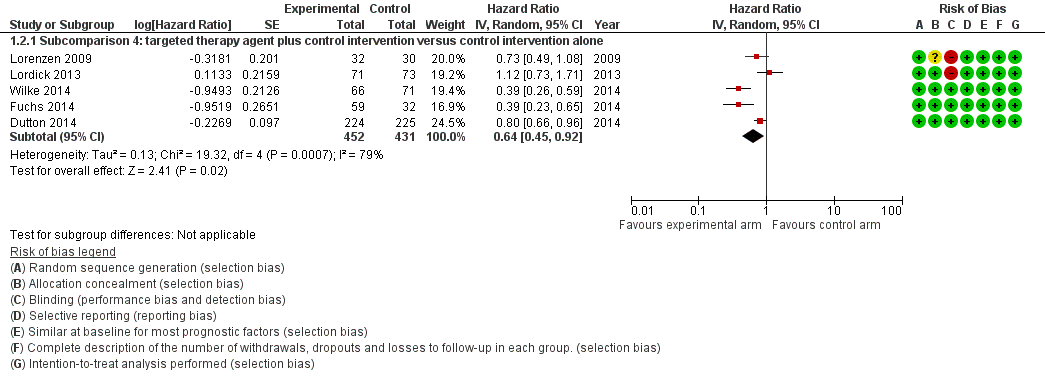
| Progression‐free survival | Subcomparison 4, targeted therapy | HR 0.64 (0.45 to 0.92) | 883 participants (5 RCTs) | ⊕⊕⊕⊝ | Cochrane's Q test for heterogeneity showed low heterogeneity (I2 = 79%, P < 0.001). |
| Subcomparison 4a, EGFR‐targeting agents | HR 0.85 (0.73 to 1.00) | 655 participants (3 RCTs) | ⊕⊕⊝⊝ | 95% CI includes benefit and lack of effect. Cochrane's Q test for heterogeneity showed low heterogeneity (I2 = 2%, P = 0.36). | |
| Subcomparison 4b, cetuximab | HR 0.90 (0.59 to 1.37) | 206 participants (2 RCTs) | ⊕⊝⊝⊝ | 95% CI includes benefit and harm. Cochrane's Q test for heterogeneity showed a moderate amount of heterogeneity (I2 = 53%, P = 0.14). One of the two studies was not blinded and did not use an independent review board. | |
| Subcomparison 4c, ramucirumab | HR 0.39 (0.28 to 0.54) | 228 participants (2 RCTs) | ⊕⊕⊕⊝ | Cochrane's Q test for heterogeneity showed low heterogeneity (I2 = 0%, P = 0.99). | |
| Toxicity | Subcomparison 4, targeted therapy | Palliative chemotherapy and/or targeted therapy appear to increase the frequency of treatment‐related toxicity of at least grade 3. However, treatment‐related deaths did not occur more frequently. | For 3020 participants with esophageal, GE‐junction, and gastric cancer (6 RCTs) information was provided on toxicity according to WHO or NCI‐CTC guidelines. For at least 990 participants with esophageal and GE‐junction cancer from these trials toxicity was reported. | ⊕⊝⊝⊝ | 2/6 studies reported toxicity for the esophageal and GE‐junction cancer subgroup separately, for both arms and with validated methods. |
| Quality of life | Subcomparison 4, targeted therapy | On average, the quality of life reported improved in the arms with the additional agent. | For 2054 participants with esophageal, GE‐junction, and gastric cancer (4 RCTs) information was provided on quality of life. For at least 784 participants with esophageal and GE‐junction cancer, quality of life was reported. | ⊕⊝⊝⊝ | 4/6 studies reported on quality of life. 1/4 studies reported quality of life separately for the esophageal and GE‐junction cancer subgroup. |
| CI: confidence interval; EGFR: epidermal growth factor receptor; GE: gastroesophageal; HR: hazard ratio; NCI‐CTC: National Cancer Institute Common Toxicity Criteria; OS: overall survival; RCT: randomized controlled trial; WHO: World Health Organization. | |||||
| GRADE Working Group grades of evidence | |||||
| aDowngraded by one level due to small sample size. | |||||
| Subcomparison 5: chemotherapy or targeted therapy agent(s) plus control intervention versus control intervention alone in participants with AC of the esophagus | ||||
| Patient or population: palliative participants with AC of the esophagus Setting: hospital Intervention: chemotherapy or targeted therapy plus BSC Comparison: BSC | ||||
| Outcomes | Relative effect | No. of participants | Quality of the evidence | Comments |
| Overall survival | HR 0.66 (0.54 to 0.81) Median OS 7.1 months in the chemotherapy or targeted therapy arm versus 6.0 months in the BSC arm | 538 (5 RCTs) | ⊕⊕⊕⊕ | Quality not downgraded. Participant populations and agents used differ between studies. However, there is low imprecision and low inconsistency. Cochrane's Q test for heterogeneity showed almost no heterogeneity (I2 = 0%, P = 0.55), indicating that results of the studies were consistent. |
| Progression‐free survival | HR 0.62 (0.38 to 1.00) | 713 (4 RCTs) | ⊕⊝⊝⊝ | 95% CI includes benefit and no effect. Cochrane's Q test for heterogeneity showed considerable heterogeneity (I2 = 84%, P < 0.001). |
| Toxicity | Palliative chemotherapy and/or targeted therapy appear to increase the frequency of treatment‐related toxicity of at least grade 3. However, treatment‐related deaths did not occur more frequently. | For 2676 participants with esophageal, GE‐junction, and gastric cancer (5 RCTs) information was provided on toxicity according to WHO or NCI‐CTC guidelines. For at least 570 participants with esophageal and GE‐junction cancer from these trials, toxicity was reported. | ⊕⊝⊝⊝ | 0/5 studies reported toxicity for the esophageal and GE‐junction cancer subgroup separately, for both arms, and with validated methods. |
| Quality of life | On average, the quality of life reported improved in the arms with the additional agent. | For 1772 participants with esophageal, GE‐junction, and gastric cancer (4 RCTs) information was provided on quality of life. For at least 426 participants with esophageal and GE‐junction cancer, quality of life was reported. | ⊕⊝⊝⊝ | 4/5 studies reported on quality of life. 0/4 studies reported quality of life separately for the esophageal and GE‐junction cancer subgroup. |
| AC: adenocarcinoma; BSC: best supportive care; CI: confidence interval; HR: hazard ratio; NCI‐CTC: National Cancer Institute Common Toxicity Criteria; OS: overall survival; RCT: randomized controlled trial; WHO: World Health Organization. | ||||
| GRADE Working Group grades of evidence | ||||
| a Downgraded three levels due to very serious imprecision (95% CI includes appreciable benefit and no effect) and serious inconsistency. | ||||
| Subcomparison 6: chemotherapy or targeted therapy agent(s) plus control intervention versus control intervention alone in participants with SCC of the esophagus | ||||
| Patient or population: palliative participants with SCC of the esophagus Setting: hospital Intervention: chemotherapy or targeted therapy plus BSC Comparison: BSC | ||||
| Outcomes | Relative effect | No. of participants | Quality of the evidence | Comments |
| Overall survival | HR 0.76 (95% CI 0.65 to 0.90) Median OS 8.0 months in the chemotherapy or targeted therapy arm versus 6.5 months in the BSC arm. | 268 (4 RCTs) | ⊕⊕⊕⊕ | Quality not downgraded. Participant populations and agents used differ between studies. However, there is low imprecision and low inconsistency. Cochrane's Q test for heterogeneity showed almost no heterogeneity (I2 = 0%, P = 0.95), indicating that results of the studies were consistent. |
| Progression‐free survival | HR 0.72 (95% CI 0.55 to 0.96) | 168 (2 RCTs) | ⊕⊝⊝⊝ | Cochrane's Q test for heterogeneity showed significant heterogeneity (I2 = 0%, P = 0.97), indicating that results of the 2 studies were not consistent. One of the 2 studies was not blinded and did not use an independent review board. |
| Toxicity | Palliative chemotherapy and/or targeted therapy appear to increase the frequency of treatment‐related toxicity of at least grade 3. However, treatment‐related deaths did not occur more frequently. | For 150 participants with esophageal and GE‐junction cancer (2 RCTs) information was provided on toxicity according to WHO or NCI‐CTC guidelines. | ⊕⊝⊝⊝ | 2/4 studies reported on toxicities with validated methods. 2/2 studies reporting toxicity for the esophageal and GE‐junction cancer subgroup separately, for both arms, and with validated methods. |
| Quality of life | On average, the quality of life reported improved in the arms with the additional agent. | For 156 participants with esophageal and GE‐junction cancer (1 RCT) information was provided on quality of life. | ⊕⊝⊝⊝ | 1/4 studies reported on quality of life. |
| BSC: best supportive care; CI: confidence interval; GE: gastro‐esophageal; HR: hazard ratio; NCI‐CTC: National Cancer Institute Common Toxicity Criteria; OS: overall survival; RCT: randomized controlled trial; SCC: squamous cell carcinoma; WHO: World Health Organization. | ||||
| GRADE Working Group grades of evidence | ||||
| aDowngraded by two levels due to small sample size, and one level due lack of blinding or use of an independent review board. | ||||
Antecedentes
Ver Apéndice 1 para el glosario de términos.
Descripción de la afección
Epidemiology
El cáncer esofágico es el octavo cáncer más frecuente en todo el mundo (Arnold 2015), con aproximadamente 398 000 personas diagnosticadas con carcinoma de células escamosas (CCE) y 52 000 con adenocarcinoma en 2012. Lo anterior se corresponde con tasas de incidencia de 5,2 y 0,7 por 100 000 habitantes, respectivamente. Los adenocarcinomas se presentan a partir de la mucosa metaplásica de Barrett localizada en el esófago inferior, mientras que el CCE se desarrolla a partir del epitelio escamoso (Enzinger 2003). En ambos tipos histológicos la displasia es el precursor. Datos epidemiológicos recientes indican que el 79% de los CCE en todo el mundo ocurren en el sureste asiático y en Asia central, mientras que el 46% de los pacientes con adenocarcinomas se diagnostican en Europa del norte y occidental, Norteamérica y Oceanía. En general, la incidencia de cáncer esofágico es mayor en los hombres que en las mujeres, especialmente el adenocarcinoma, en el que la proporción hombre‐mujer es 4,4:1, en comparación con 2,7:1 para el CCE (Arnold 2015). En las últimas décadas, los países desarrollados han observado un aumento en la incidencia de adenocarcinoma (Edgren 2013), atribuido a la mayor prevalencia de obesidad. Por otro lado, la disminución en la incidencia de CCE en estos contextos se correlaciona con la disminución del tabaquismo (Cook 2009). El CCE todavía es más frecuente en los países de ingresos bajos y medios, que incluyen África y Asia oriental (Lin 2013; Ocama 2008; Somdyala 2010; White 2009). Casi la mitad de los pacientes con carcinoma esofágico tienen enfermedad distante al momento del diagnóstico (Howlader 2014).
Pronóstico y opciones de tratamiento
El tratamiento endoscópico puede ser una opción para los cánceres esofágicos en estadios iniciales, pero una revisión Cochrane no encontró ensayos controlados aleatorios (ECA) que compararan las opciones de tratamiento en este estadio inicial (Bennett 2012). La resección quirúrgica es el tratamiento potencialmente curativo para el cáncer esofágico, pero solo es factible en los pacientes que están en buen estado físico para la cirugía, tienen una enfermedad localmente resecable y no muestran signos de metástasis distantes. Desafortunadamente, la mayoría de los pacientes desarrollan crecimiento tumoral recurrente en los primeros años después de la cirugía. Los cuidados paliativos son la única opción para la enfermedad metastásica, con una tasa de supervivencia a los cinco años menor del 3% (Hur 2013). El tratamiento paliativo intenta controlar el crecimiento tumoral y aumentar la supervivencia sin reducir significativamente la calidad de vida.
Descripción de la intervención
En la práctica diaria, los médicos a menudo ofrecen quimioterapia paliativa para controlar el crecimiento tumoral y aumentar la calidad de vida, así como la esperanza de vida. Los médicos tienen la opción de elegir el tratamiento citostático, que se dirige a las células que se dividen rápidamente en general, o los tratamientos dirigidos orientados contra moléculas específicas necesarias para la carcinogénesis y el crecimiento tumoral. Los agentes administrados más ampliamente para esta enfermedad son 5‐fluorouracilo (5‐FU) y cisplatino, que están incluidos en la mayoría de los regímenes de quimioterapia combinada. Sin embargo, los agentes quimioterapéuticos utilizados en los ECA son muy heterogéneos. Los investigadores han examinado los tratamientos dirigidos como tratamiento paliativo durante una década (Lorenzen 2009). Los pacientes tratados con estos agentes antineoplásicos presentan menos efectos secundarios en comparación con los pacientes tratados con las quimioterapias citotóxicas clásicas. Los objetivos más frecuentes estudiados son el receptor del factor de crecimiento epidérmico (EGFR) y el receptor 2 del factor de crecimiento endotelial vascular (VEGFR2). La mayoría de los tratamientos dirigidos estudiados son los anticuerpos monoclonales, excepto el inhibidor de la tirosin quinasa, gefitinib (Dutton 2014).
Por qué es importante realizar esta revisión
La quimioterapia paliativa y los tratamientos dirigidos son opciones de tratamiento ampliamente aceptadas. Sin embargo, excepto del ramucirumab, falta evidencia de la eficacia del tratamiento paliativo para el cáncer esofágico y gastroesofágico. Para evaluar si existe un efecto beneficioso se necesitan estudios aleatorios grandes que evalúen los efectos de la quimioterapia o del tratamiento dirigido para tratar a los pacientes con cáncer esofágico y de la unión gastroesofágica con intención paliativa. En un estudio aleatorio de cáncer gástrico, Thuss‐Patience 2011 informó que reunir estudios de tratamiento de primera línea es muy difícil porque la mayoría de los pacientes rechazan la asignación al azar, por lo que es probable que no estarán disponibles datos nuevos de estudios aleatorios grandes que investiguen la quimioterapia o el tratamiento dirigido de primera línea versus el mejor tratamiento médico de apoyo (MTMA). Por otro lado, hay datos nuevos interesantes disponibles con respecto a los tratamientos dirigidos y los tratamientos de segunda línea. Debido a la disponibilidad limitada de datos relevantes, resumir la evidencia disponible podría aumentar la comprensión sobre si la quimioterapia y los tratamientos dirigidos se prescriben de forma justificada a los pacientes con cáncer esofágico o de la unión gastroesofágica avanzado o metastásico.
Se ha decidido elaborar el metanálisis principal de una manera que resuma el mayor número de estudios. La desventaja de este enfoque es la heterogeneidad de los estudios incluidos en cuanto a la intervención y los grupos de participantes. Debido a que este enfoque complica la traducción directa de los resultados a los individuos, se realizaron análisis de subgrupos cuando fue posible para investigar si el resultado general fue consistente a través de los subgrupos de tratamientos y participantes.
Objetivos
Evaluar los efectos del tratamiento citostático o dirigido para tratar el cáncer esofágico o de la unión gastroesofágica con intención paliativa.
Métodos
Criterios de inclusión de estudios para esta revisión
Tipos de estudios
Se incluyeron ECA con o sin cegamiento. Los resúmenes que cumplieron con los criterios de inclusión e informaron datos sobre los resultados de la revisión se incluyeron como estudios en espera de clasificación. Si el resumen fue un protocolo de estudio, se incluyó como un estudio en curso.
Se excluyeron todos los estudios no aleatorios y cuasialeatorios, ya que se consideró que no aportaron evidencia de calidad suficientemente alta.
Tipos de participantes
Pacientes con carcinoma esofágico y de la unión gastroesofágica avanzado (T3‐T4NxM0 no resecable; y todos los TxNxM1), recurrente o metastásico. Se incluyeron solamente los estudios con pacientes con enfermedad avanzada o no resecable que recibieron quimioterapia con intención paliativa. No se consideraron los estudios que incluyeron pacientes que recibieron quimioterapia para el cáncer localmente avanzado con el objetivo de evaluar la resecabilidad. Se incluyeron pacientes con CCE y adenocarcinoma, así como pacientes que habían recibido quimioterapia previa.
En la síntesis cualitativa se incluyeron los estudios que incluyeron solo a un subgrupo de pacientes elegibles, por ejemplo, estudios que incluyeron a pacientes con cáncer de la unión gastroesofágica y cáncer gástrico, si describieron los resultados del cáncer de la unión gastroesofágica de forma separada e incluyeron al menos 15 pacientes elegibles. En ciertas circunstancias estos estudios se evaluaron para inclusión en la síntesis cuantitativa (ver Análisis de sensibilidad).
Tipos de intervenciones
Se incluyeron los tratamientos con quimioterapia o tratamiento dirigido intravenoso sistémico y oral único, así como los regímenes de combinación en todas las dosis y esquemas. El "brazo control" se definió como el MTMA o el tratamiento con al menos un agente quimioterapéutico con composición, dosis y régimen iguales en ambos brazos. Los ECA para definir dosis no fueron elegibles para esta revisión. La quimioterapia incluyó todos los tratamientos citotóxicos y antineoplásicos, y el tratamiento dirigido incluyó todos los tratamientos antineoplásicos dirigidos a una proteína específica o a un grupo pequeño de proteínas. En esta revisión no se consideraron las intervenciones de radioquimioterapia combinada ni las intervenciones de radioterapia dirigida.
La comparación principal de esta revisión fue agente/s quimioterapéutico/s o de tratamiento dirigido más cualquier intervención control versus intervención control sola. También se realizó un análisis de sensibilidad para evaluar el efecto de la intervención en los pacientes con cáncer esofágico y de la unión gastroesofágica versus cáncer gástrico.
Finalmente, se realizaron varios análisis de subgrupos.
-
-
Quimioterapia o tratamiento dirigido más MTMA versus MTMA.
-
Efecto de la intervención en los participantes que habían recibido quimioterapia anterior (versus intervención control sola).
-
Agente quimioterapéutico más intervención control versus intervención control sola.
-
Agente terapéutico dirigido más intervención control versus intervención control sola.
-
Agente dirigido al receptor del factor de crecimiento epidérmico (EGFR) más intervención control versus intervención control sola.
-
Cetuximab más intervención control versus intervención control sola.
-
Ramucirumab más intervención control versus intervención control sola.
-
-
Agente/s quimioterapéutico/s o de tratamiento dirigido más intervención control versus intervención control sola en pacientes con adenocarcinoma de esófago.
-
Agente/s quimioterapéutico/s o de tratamiento dirigido más intervención control versus intervención control sola en pacientes con CCE de esófago.
-
Tipos de medida de resultado
Las medidas de resultado mencionadas a continuación no se utilizaron como criterios de inclusión, sino como una lista de medidas de resultado de interés para esta revisión.
Resultados primarios
Mediana de la supervivencia general (SG) (tiempo hasta la muerte) y cociente de riesgos instantáneos (CRI) con los intervalos de confianza (IC) del 95%.
Resultados secundarios
-
Mediana de la supervivencia libre de progresión (SLP) (tiempo hasta la progresión de la enfermedad o la muerte) y CRI con los IC del 95%.
-
Toxicidad (tipo, gravedad y porcentaje de efectos tóxicos agudos y crónicos, que incluye la muerte por toxicidad), clasificada según la Organización Mundial de la Salud (OMS) o los National Cancer Institute Common Toxicity Criteria (NCI‐CTC). El interés se centró en los efectos tóxicos de grado 3 o mayor. Los efectos tóxicos de grado 3 se describen en los Common Terminology Criteria for Adverse Events (CTCAE), Versión 4.0, como "graves o médicamente significativos pero no potencialmente mortales de inmediato; hospitalización o prolongación de la hospitalización indicada; discapacitante; limitantes de las actividades de autocuidado cotidianas" (Common Toxicity Criteria 4.0).
-
Calidad de vida (que incluye todas las medidas de resultado validadas).
Results
Description of studies
See: Characteristics of included studies; Characteristics of excluded studies; Characteristics of studies awaiting classification; Characteristics of ongoing studies.
Results of the search
We retrieved 5786 unique records and excluded 5571 after screening title and abstract. We excluded 69 (see Excluded studies and Figure 1). The quantitative synthesis includes 41 studies. We added a total of 46 and 49 potential new studies of interest to a list of 'Studies awaiting classifications' and 'Ongoing studies', respectively. We will assess these and incorporate as appropriate in the next version of this review.
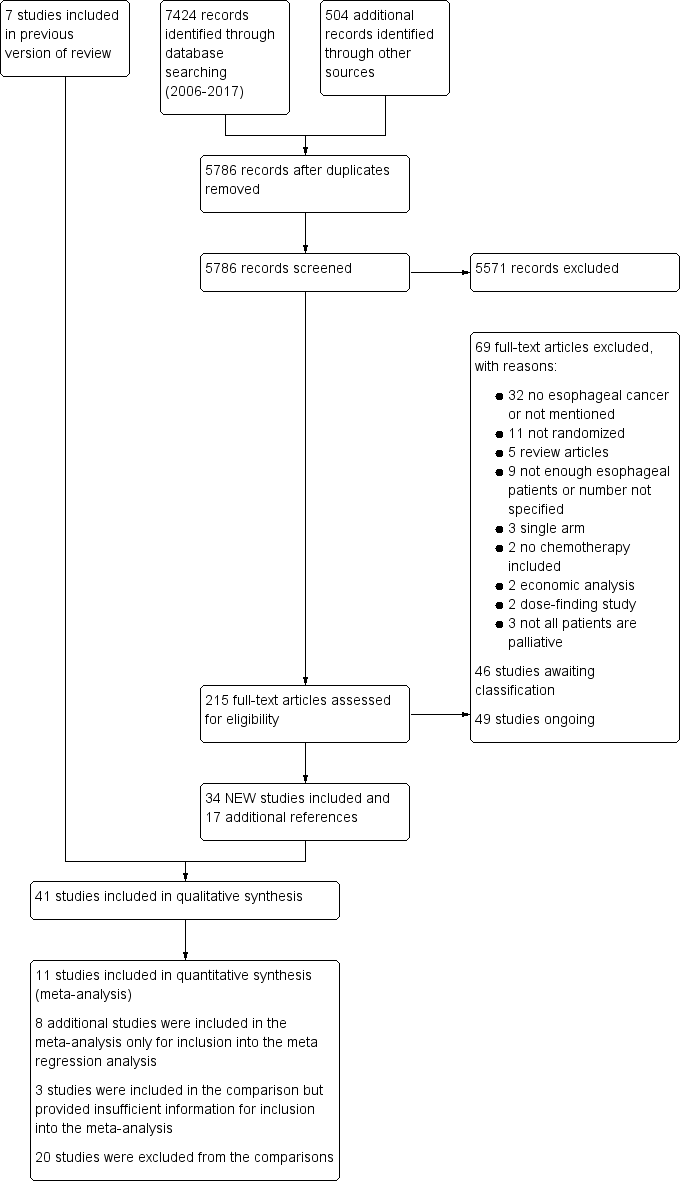
Study flow diagram: review update
Included studies
Eleven studies in 1347 participants contributed data to the meta‐analysis of the main comparison: chemotherapy or targeted therapy agent(s) plus control intervention versus control intervention alone. For more details about the included studies, see Characteristics of included studies. We performed six subcomparisons, described below.
Participants
The median age of participants in the population included in the meta‐analyses was 60 years (range 53 to 72 years). The proportion of participants reported as having metastatic disease ranged from 69% in Al‐Batran 2013 to 100% in Nicolaou 1982. We could not extract the percentage of people with metastasis in 5 out of 19 studies included in the meta‐regression analyses. For information on individual studies, see Characteristics of included studies.
With regard to baseline differences, we saw a five‐year difference in median age between the study arms in one trial (Rao 2010). In another, the proportion of the metastatic sites involved per participant was not similar at baseline: 29% of participants in the intervention group had one site involved, compared to 58% in the BSC group (Thuss‐Patience 2011). Performance status was well balanced in all studies, with no differences greater than 15% between study arms. The percentage of participants with ECOG‐2 or ‐3 was in the range of 0% to 35%.
Seven studies included in the meta‐analyses took place completely or partially in Asia (Bang 2010; Fuchs 2014; Huang 2009; Lordick 2013; Ohtsu 2011; Shen 2014; Wilke 2014; Xu 2013a). One study was translated from Chinese (Huang 2009).
Two studies selected participants based on biomarker expression. The effect of a targeted therapeutic can be expected to depend on the presence of the target in the tumor. The first included only EGFR‐positive participants (Lorenzen 2009). The second included only participants that were eligible if their tumor samples, stained with HER2, were scored as 3 or more on immunohistochemistry or if they tested positive using fluorescent in situ hybridization (FISH) analysis (HER2:CEP17 ratio ≥ 2) (Bang 2010). The results of these studies cannot be extrapolated to people that do not have biomarker expression as defined by these studies.
Comparisons
Main comparison
Eleven studies contributed data to the meta‐analysis for the main comparison: chemotherapy or targeted therapy agent(s) plus control intervention versus control intervention alone in people with esophageal and GE‐junction cancer. Trials used the following agents: 5‐FU (Bleiberg 1997), 5‐FU and cisplatin (Levard 1998), cetuximab (Lordick 2013; Lorenzen 2009), cyclophosphamide and doxorubicin (Nicolaou 1982), docetaxel (Ford 2014), gefitinib (Dutton 2014), ramucirumab (Fuchs 2014; Wilke 2014), Shenyi Capsule (Huang 2009), and trastuzumab (Bang 2010). Six studies were first‐line therapy regimens (Bang 2010; Bleiberg 1997; Levard 1998; Lordick 2013; Lorenzen 2009; Nicolaou 1982), one was a mixed therapy (Huang 2009), and the others were second‐line treatments. Three studies were included in the main comparison but did not provide enough detail for inclusion in the meta‐analysis (Eatock 2013; Wilkes 2011; Xu 2013a).
Sensitivity analysis
We compared the effect of the intervention in the studies of the main comparison to the effect of intervention in the studies that also included gastric cancer participants. These studies investigated: bevacizumab (Ohtsu 2011; Shen 2014), cetuximab (Richards 2013), docetaxel (Al‐Batran 2013), irinotecan (Thuss‐Patience 2011), matuzumab (Rao 2010), mitomycin (Tebbutt 2002), and rilotumumab (Iveson 2014). Six studies were first‐line therapies (Al‐Batran 2013; Iveson 2014; Ohtsu 2011; Rao 2010; Shen 2014; Tebbutt 2002), and two were mixed or unclear (Richards 2013; Thuss‐Patience 2011). The subsequent meta‐regression analysis focused on studies that reported the effectiveness of the intervention for GE‐junction and gastric cancer participants separately. We made a direct comparison with regard to the effectiveness of treatment on these two subgroups in five studies: Bang 2010 (trastuzumab), Ford 2014 (docetaxel), Fuchs 2014 (ramucirumab), Lordick 2013 (cetuximab), and Wilke 2014 (ramucirumab). Two studies focused on first‐line therapy regimens (Bang 2010; Lordick 2013), and three used second‐line therapies (Ford 2014; Fuchs 2014; Wilke 2014). SCCs were not included in any of these studies.
Subcomparison 1
Five studies investigated chemotherapy or targeted therapy plus BSC versus BSC, using the following agents: cyclophosphamide plus doxorubicin (Nicolaou 1982), 5‐FU plus cisplatin (Levard 1998), docetaxel (Ford 2014), ramucirumab (Fuchs 2014), and gefitinib (Dutton 2014). Two studies were first‐line therapy regimens (Nicolaou 1982; Levard 1998), and the others were second‐line regimens.
Subcomparison 2
Four studies investigated second‐line therapy regimens. Dutton 2014 investigated gefitinib in participants with progression after chemotherapy and excluded participants receiving either cytotoxic chemotherapy, immunotherapy, hormonal therapy, or radiotherapy to the site of measurable or evaluable disease within the four weeks prior to inclusion. Ford 2014 investigated docetaxel in a participant population with documented disease progression during or within six months of treatment with platinum and fluoropyrimidine‐based treatment. These participants were not allowed to have had previous chemotherapy with a taxane. Fuchs 2014 investigated ramucirumab in a participant population with disease progression either within four months of the last dose of first‐line platinum‐containing or fluoropyrimidine‐containing chemotherapy for metastatic disease, or within six months of the last dose of platinum‐containing or fluoropyrimidine‐containing adjuvant treatment. Wilke 2014 investigated ramucirumab with participants that had disease progression during or within four months of the last dose of first‐line platinum and fluoropyrimidine doublet.
Subcomparison 3
Five studies compared a chemotherapy agent(s) plus control intervention versus control intervention, using the following agents: 5‐FU (Bleiberg 1997), 5‐FU plus cisplatin (Levard 1998), docetaxel (Ford 2014), cyclophosphamide plus doxorubicin (Nicolaou 1982), and Shenyi Capsule (Huang 2009). Three studies were first‐line therapy regimens (Bleiberg 1997; Levard 1998; Nicolaou 1982), one used mixed therapies (Huang 2009), and one a second‐line regimen (Ford 2014). One study included in the subcomparison did not provide enough detail for inclusion in the meta‐analysis (Wilkes 2011).
Subcomparison 4
Six studies compared a targeted therapeutic agent plus control intervention versus control intervention alone, testing the following agents: cetuximab (EGFR) (Lordick 2013; Lorenzen 2009), gefitinib (tyrosine kinase inhibitor for EGFR) (Dutton 2014), ramucirumab (VEGFR2) (Fuchs 2014; Wilke 2014), and trastuzumab (HER2) (Bang 2010). Three studies focused on first‐line regimens (Bang 2010; Lordick 2013; Lorenzen 2009), and the others used second‐line therapies. One study was included in the subcomparison but did not provide enough detail for inclusion in the meta‐analysis (Xu 2013a).
Subgroup 4a. Three studies investigated EGFR‐targeting agents plus control intervention versus control intervention alone (Dutton 2014; Lordick 2013; Lorenzen 2009). Two studies were first‐line therapies (Lordick 2013; Lorenzen 2009), and one was a second‐line regimen (Dutton 2014). One study was included in the subgroup but did not provide enough detail for inclusion in the meta‐analysis (Xu 2013a).
Subgroup 4b. Two studies investigated the EGFR‐targeting agent cetuximab plus control intervention versus control intervention alone, both with first‐line therapy regimens (Lordick 2013; Lorenzen 2009).
Subgroup 4c. Two studies compared VEGFR2‐targeting agent ramucirumab plus control intervention versus control intervention alone, both with second‐line therapies (Fuchs 2014; Wilke 2014).
Subcomparison 5
Five studies investigated chemotherapy or targeted therapy agent(s) plus control intervention versus control intervention alone in participants with adenocarcinoma of the esophagus, using the following agents: trastuzumab (Bang 2010), docetaxel (Ford 2014), ramucirumab (Fuchs 2014), cetuximab (Lordick 2013), and ramucirumab (Wilke 2014). Two studies were first‐line therapy regimens (Bang 2010; Lordick 2013), and three were second‐line therapies (Ford 2014; Fuchs 2014; Wilke 2014). One study was included in the subcomparison but did not provide enough detail for inclusion in the meta‐analysis (Eatock 2013).
Subcomparison 6
Five studies investigated chemotherapy or targeted therapy agent(s) plus control intervention versus control intervention alone in participants with SCC of the esophagus, using 5‐FU (Bleiberg 1997), 5‐FU and cisplatin (Levard 1998), cetuximab (Lorenzen 2009), doxorubicin (Nicolaou 1982), and gefitinib (Dutton 2014). Four studies were first‐line therapy regimens (Bleiberg 1997; Levard 1998; Lorenzen 2009; Nicolaou 1982), and one was a second‐line therapy (Dutton 2014). One study was included in the subcomparison but did not provide enough detail for inclusion in the meta‐analysis (Xu 2013a).
We describe all interventions in detail, along with the type and location of the tumors, in the Characteristics of included studies. We defined second‐line therapy studies as including only participants that had received previous chemotherapy or targeted therapy within six months of starting the study regimen, including adjuvant therapy.
Studies excluded from the comparisons
Five studies included only eligible participants, however, these studies were not eligible for inclusion in any of our comparisons. Waddell 2013 studied panitumumab and adjusted the control regimen of epirubicin, oxaliplatin, and capecitabine in the experimental arm. One study was not eligible because it compared leucovorin and 5‐FU versus S‐1 on a background of cisplatin (Pang 2014). Three studies used an equal number of agents in each arm. These studies compared: atofluding versus ftorafur on a background of either mitomycin C plus etoposide, cisplatin plus hydroxycamptothecin, cisplatin plus vindesine, or mitomycin C plus adriamycin (Li 2002), epirubicin versus mitomycin on a background of cisplatin plus 5‐FU (Ross 2002), and adriamycin versus methotrexate or 5‐FU (Ezdinli 1980).
There were 15 studies that also included participants with gastric cancer that we excluded from the comparisons because they did not compare the addition of an agent to an unaltered control regimen. These studies compared: S1 versus 5‐FU on a background of cisplatin (Ajani 2010); oxaliplatin versus cisplatin on a background of 5‐FU plus leucovorin (Al‐Batran 2008); cisplatin versus oxaliplatin on a background of epirubicin plus 5‐FU or capecitabine, and 5‐FU versus capecitabine on a background of epirubicin plus cisplatin or oxaliplatin (Cunningham 2008); irinotecan plus folinic acid versus cisplatin on a background of 5‐FU (Dank 2008); continuous 5‐FU plus cisplatin versus bolus 5‐FU plus leucovorin (Duffour 2006); irinotecan versus cisplatin on a background of capecitabine (Moehler 2010); 5‐FU versus cisplatin on a background of irinotecan (Pozzo 2004); irinotecan versus 5‐FU on a background of docetaxel (Roy 2012); and epirubicin plus cisplatin versus doxorubicin plus methotrexate on a background of 5‐FU (Waters 1999). Five studies did add an agent to a control regimen but adjusted their control regimens in the experimental arm. They investigated docetaxel plus cisplatin (Ajani 2005); docetaxel plus oxaliplatin, either with or without 5‐FU (Van Cutsem 2015); lapatinib (Lorenzen 2015); docetaxel plus oxaliplatin with or without capecitabine (Van Cutsem 2015); or cisplatin and 5‐FU with or without docetaxel (Van Cutsem 2006). One study was not eligible for inclusion because it tested two agents (cisplatin, 5‐FU) versus one agent (capecitabine) (Tebbutt 2010).
In order to analyze the data from studies with a mixed participant population, including both eligible and ineligible participants, we requested individual participant data from authors of studies that we included after the search round of 3 October 2013. Only one author responded and provided individual participant data. Subsequently, we decided to investigate the information from the studies that included both esophageal and/or GE‐junction, mixed with gastric cancer participants, in a sensitivity analysis to assess the influence of gastric cancer participants on the outcome of the individual studies.
Outcomes
OS and toxicity were the most commonly described outcomes, followed by PFS, time to progression (TTP), and objective response rate. Studies did not always classify toxicity according to NCI‐CTC or WHO. Studies published before 2010 did not report quality of life with validated methods, and where reported, authors did not always report this outcome separately for esophageal and GE‐junction cancer subgroups.
Excluded studies
See Characteristics of excluded studies. We updated and revised the search for this version of the review. We excluded 5571 records based on their title and abstract as well as another 69 articles after reading the full text. The most frequent reason for exclusion was because the study turned out not to involve esophageal of GE‐junction cancer participants. The reasons for exclusion are further specified in Figure 1 according to the recommendations of the PRISMA statement (Moher 2009). We included studies that contained non‐eligible participants as well as eligible participants. However, we excluded two studies that contained only nine and four eligible participants (Cascinu 2011 and Li 2011, respectively), as they did not provide sufficient data. We also excluded Koizumi 2010 because authors did not specify the number of participants with GE‐junction cancer. Additionally, we excluded several studies currently published as abstracts only, because full information on risk of bias and/or data on the esophageal and GE‐junction cancer subgroup were unavailable. We classified these as 'Studies awaiting classification'.
Risk of bias in included studies
For details on the included studies see Characteristics of included studies and the summary figure of the quality assessment (Figure 2). Investigators performed and described blinding in 8 out of 41 studies. This poses a certain risk of bias in many of the included studies.
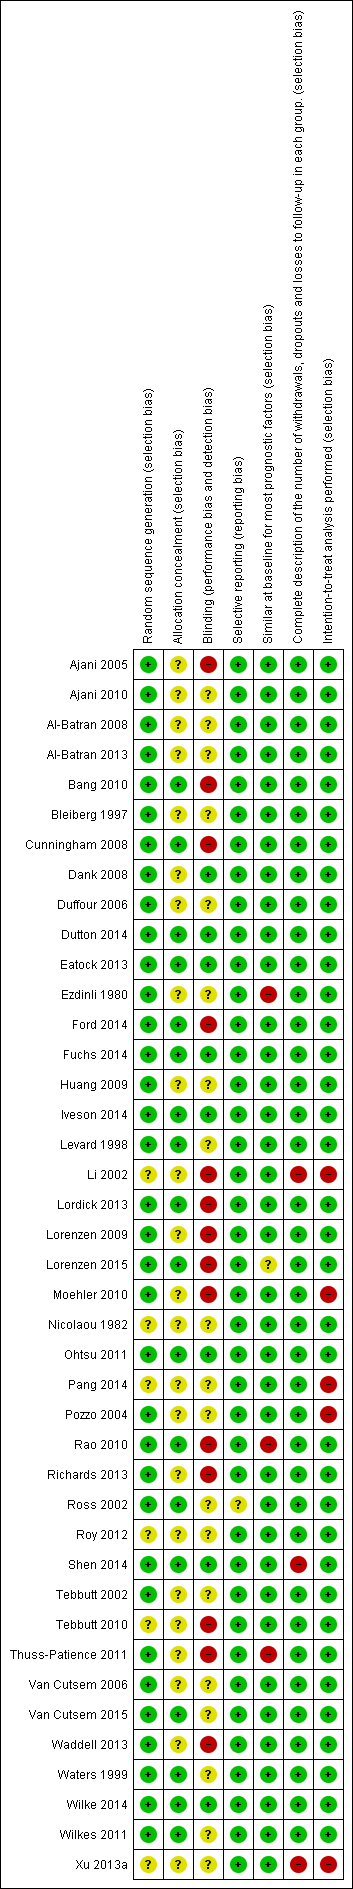
Risk of bias summary: review authors' judgements about each risk of bias item for each included study.
Allocation
Studies frequently failed to describe allocation concealment, and six studies did not describe the method of random sequence generation.
Blinding
Two studies evaluated progression using a blinded independent review board (Lordick 2013; Rao 2010). We did not downgrade the GRADE level of evidence for the primary outcome, OS, due to lack of binding or mentioning of blinding in the study report. This because we assume knowledge of allocation has limited effect on survival and the detection of survival and would, thus, not induce performance or detection bias. Seven studies described use of an external review board but did not describe blinding (Ajani 2005; Ajani 2010; Duffour 2006; Pozzo 2004; Roy 2012; Tebbutt 2010; Van Cutsem 2006).
Incomplete outcome data
Incomplete outcome data with risk of attrition bias was present in a few included studies, either because there was no intention‐to‐treat analysis (Li 2002; Moehler 2010; Pang 2014; Pozzo 2004; Van Cutsem 2006; Xu 2013a), or because authors did not describe dropouts (Li 2002; Xu 2013a).
Selective reporting
Risk of reporting bias was present in one study (Ross 2002), where authors reported the data in esophageal participants separately for overall response rate but not for other outcomes. We did not consider studies that reported overall survival for esophageal participants separately and did not report on other outcome measures to be at high risk of reporting bias, as overall survival was the primary endpoint of analysis in this review.
Other potential sources of bias
We considered that four studies had groups that were not similar at baseline. This was due to age difference (Rao 2010), number of organs involved in metastatic disease (Lorenzen 2015; Thuss‐Patience 2011), or both (Ezdinli 1980). We assessed small study effects, such as publication bias, in a qualitative manner using a funnel plot for the main analysis, but we found no evidence that these effects were present.
Effects of interventions
See: Summary of findings for the main comparison Summary of findings table: chemotherapy or targeted therapy agent(s) plus control intervention versus control intervention alone for palliative treatment of esophageal and GE‐junction carcinoma; Summary of findings 2 Summary of findings table (sensitivity analysis): interventions esophageal and GE‐junction carcinoma versus gastric carcinoma; Summary of findings 3 Summary of findings table (subcomparison 1): chemotherapy or targeted therapy plus best supportive care (BSC) versus BSC for palliative treatment of esophageal and GE‐junction carcinoma; Summary of findings 4 Summary of findings table (subcomparison 2): second‐line chemotherapy or targeted therapy agent(s) plus control intervention versus control intervention alone for palliative treatment of esophageal and GE‐junction carcinoma; Summary of findings 5 Summary of findings table (subcomparison 3): chemotherapy agent(s) plus control intervention versus control intervention alone for palliative treatment of esophageal and GE‐junction carcinoma; Summary of findings 6 Summary of findings table (subcomparison 4): targeted therapy agent plus control intervention versus control intervention alone for palliative treatment of esophageal and GE‐junction carcinoma; Summary of findings 7 Summary of findings table (subcomparison 5): chemotherapy or targeted therapy agent(s) plus control intervention versus control intervention alone in participants with AC of the esophagus; Summary of findings 8 Summary of findings table (subcomparison 6): chemotherapy or targeted therapy agent(s) plus control intervention versus control intervention alone in participants with SCC of the esophagus
Main analysis: chemotherapy or targeted therapy agent(s) plus control intervention versus control intervention alone
Overall survival
Eleven studies in 1347 participants contributed data to this meta‐analysis (Bang 2010; Bleiberg 1997; Dutton 2014; Ford 2014; Fuchs 2014; Huang 2009; Levard 1998; Lordick 2013; Lorenzen 2009; Nicolaou 1982; Wilke 2014). These studies included only people with esophageal and/or GE‐junction cancer, or they reported reported the results separately for this group. The overall HR in favor of the arm with the additional agent was 0.75 (95% CI 0.68 to 0.84, high‐quality evidence), showing an OS benefit (Analysis 1.1; Figure 3). On average, participants in the arm with the additional chemotherapy or targeted therapy agent received 2.1 chemotherapy or targeted therapy agents, versus an average of 1.0 agents in the control arms. Median OS, weighted for study size, in the arm with the additional agent was 6.7 months versus 5.7 months in the control arm. We could not include two studies because they did not report median overall survival data (Bang 2010; Huang 2009). Cochrane's Q test for heterogeneity showed a non‐significant amount of heterogeneity (I2 = 5%, P = 0.40), which indicated that results of the different studies were consistent in their findings. We did not note any small study effects such as publication bias (Figure 4).
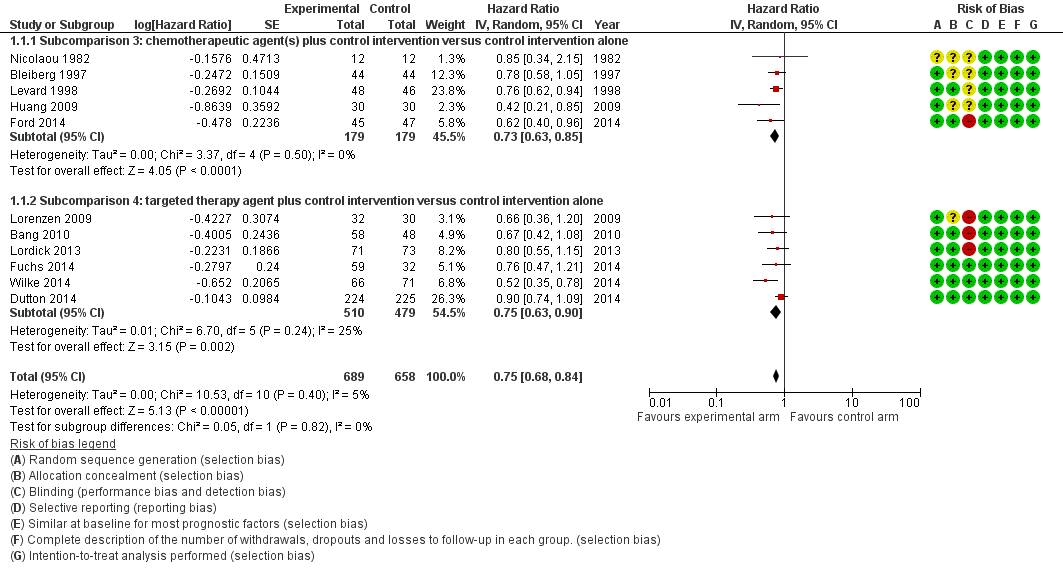
Forest plot of the main analysis: chemotherapy or targeted therapy agent(s) plus control arm versus control arm, outcome: 1.1 Overall survival.
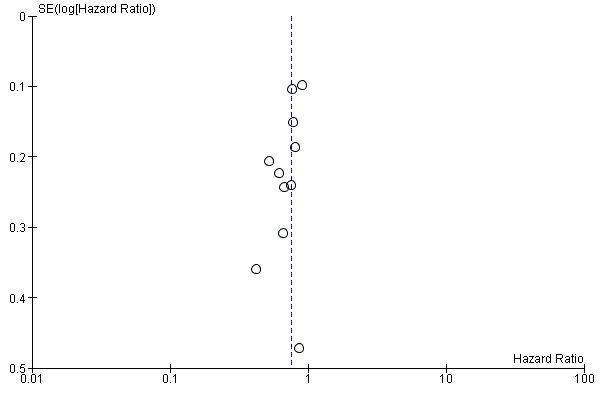
Funnel plot of the main comparison: chemotherapy or targeted therapy agent(s) plus control arm versus control arm, outcome: 1.1 Overall survival.
Two studies included in the meta‐analysis selected participants based on biomarker expression (Bang 2010; Lorenzen 2009). We could not include three studies under this comparison in the meta‐analysis because of insufficient information. Eatock 2013 investigated trebananib. Median OS times at the time of analysis were 9.1 months, 9.4 months, and 12.8 months for the 10.0 mg/kg, 3.0 mg/kg, and control arms, respectively. Wilkes 2011 studied thalidomide and reported that survival was not affected by group allocation. Xu 2013a found higher, statistically significant (P < 0.05) OS in the nimotuzumab group relative to the control group.
Progression‐free survival
Of all studies included in this comparison, only studies that investigated a targeted therapy agent reported PFS. Therefore, we describe the results of this analysis in more detail under subcomparison 4, 'Progression‐free survival'. The analysis contained five studies in 883 participants. The addition of a targeted therapeutic agent probably leads to an HR of 0.64 (95% CI 0.45 to 0.92, moderate‐quality evidence; Analysis 1.2; Figure 5). Eatock 2013 investigated trebananib in esophageal adenocarcinoma participants but did not provide enough detail for inclusion in the meta‐analysis. Median PFS times at the time of analysis were 4.2 months, 4.9 months, and 5.2 months for the 10.0 mg/kg, 3.0 mg/kg, and control arms, respectively.
Forest plot of the main analysis: chemotherapy or targeted therapy agent(s) plus control arm versus control arm, outcome: 1.2 Progression free survival.
Toxicity
All 11 studies included in the main analysis reported on toxicity. All studies reported the frequency of toxic effects, although not all used WHO or NCI‐CTC guidelines. Five studies did not report toxicity for the esophageal and GE‐junction cancer subgroup separately (Bang 2010; Ford 2014; Fuchs 2014; Lordick 2013; Wilke 2014). Therefore, in this review, we only compared toxicity between study arms, not between studies. Nicolaou 1982 and Levard 1998 did not use WHO or NCI‐CTC guidelines. All other studies used NCI‐CTC, except for two that used WHO guidelines (Bleiberg 1997; Huang 2009).
In Bang 2010, the most common grade 3 and 4 adverse events reported with trastuzumab plus chemotherapy versus chemotherapy alone were neutropenia (27% versus 30%), anemia (12% versus 10%), and diarrhea (9% versus 4%). Treatment‐related mortality was 3% in the trastuzumab plus chemotherapy arm, versus 1% in the chemotherapy alone arm. Bleiberg 1997 reported that grade 3 and 4 adverse events occurred most frequently in the 5‐FU cisplatin arm versus the cisplatin alone arm. These were nausea or vomiting (27% versus 11%) and leukocytopenia and thrombocytopenia (both 12% versus 0%). Seven (16%) treatment‐related deaths occurred in the treatment arm. Dutton 2014 reported that any grade 3, 4, or 5 toxicities occurred in 45% of participants in the gefitinib plus control arm versus 39% of participants in the control arm. Two treatment‐related deaths occurred in the placebo group and one in the gefitinib group. Ford 2014 found that grade 4 toxicities occurred more frequently in participants treated with docetaxel compared to participants in the control arm (21% versus 4%). Neutropenia, infections, and febrile neutropenia were the toxicities that differed most between the study arms. None of the deaths were attributed to the treatment. In both arms of Fuchs 2014, 2% of the participants died due to drug‐related toxicity. Ramucirumab was not associated with increased rates of fatigue, decreased appetite, vomiting, anemia, or other notable toxic effects. Huang 2009 used WHO guideline classifications but did not specify the grade of the side effects that occurred. In Lordick 2013, any grade 3 or 4 adverse events occurred in 83% of participants in the cetuximab plus control arm versus 77% in the control arm. Nine per cent of participants in the chemotherapy plus cetuximab arm and eight per cent of participants in the control arm had an adverse event leading to death. Lorenzen 2009 reported that grade 3 and 4 adverse events, which occurred more frequently in the cetuximab group, were diarrhea (16% versus 0%), neutropenia (22% versus 13%), and rash (6% versus 0%). Additionally, they reported one (3%) treatment‐related death in the control arm and none in the experimental arm. Wilke 2014 found that the most frequently occurring grade 3, 4, and 5 adverse events in the ramucirumab arm versus the control arm were neutropenia (41% versus 19%), leukopenia (18% versus 7%), and hypertension (15% versus 3%). In both arms, 2% of participants had adverse events leading to death with a causal relation to the study drugs.
Overall, palliative chemotherapy and/or targeted therapy appears to increase the frequency of treatment‐related toxicity of at least grade 3. Treatment‐related deaths were rare in most studies, and there is no clear evidence that treatment‐related deaths occur more frequently in the study arms with an additional chemotherapy or targeted therapy agent.
Quality of life
Five studies included in the main analysis did not report on quality of life (Bleiberg 1997; Lordick 2013; Lorenzen 2009; Nicolaou 1982; Wilkes 2011). Four studies did not report quality of life separately for the esophageal and GE‐junction cancer subgroup (Bang 2010; Ford 2014; Fuchs 2014; Wilke 2014). Two studies reported on quality of life but did not use validated methods (Huang 2009; Levard 1998). Huang 2009 used improvement after treatment in the treatment arm versus the control arm for the Karnofsky score (33% versus 10%) and body weight (27% versus 6.7%). Levard 1998 studied dysphagia in order to judge the quality of life during the survival of their participants. Bang 2010 (see Satoh 2014) reported that trastuzumab plus chemotherapy versus chemotherapy alone prolonged time to 10% definitive deterioration in all QLQ‐C30 and QLQ‐STO22 scores (Aaronson 1993; Blazeby 2004), including QLQ‐C30 global quality of life score, from 6.4 months to 10.2 months. Dutton 2014 reported no differences between the gefitinib and placebo groups in global quality of life measured with QLQ‐C30. However, odynophagia worsened for participants on placebo and improved significantly for participants on gefitinib. Ford 2014 reported that the mean quality‐adjusted life weeks (QLQ‐C30) were 12.1 weeks (standard deviation (SD) 0.84) for the docetaxel group and 9.3 weeks (SD 0.73) for the control group. Fuchs 2014 reported a trend toward better quality of life (QLQ‐C30) at six weeks for participants in the ramucirumab group compared to those in the placebo group (P = 0.23). Median time of deterioration to a score of 2 or worse in ECOG performance status was 2.4 months (95% CI 1.3 to not reached) in the placebo group and 5.1 months (95% CI 1.9 to 16.8) in the ramucirumab group. Wilke 2014 reported that baseline and end‐of‐treatment results for global quality of life from the QLQ‐C30 and index scores from the EQ‐5D‐3L were similar in the treatment groups (EuroQol 1990). Overall, the studies reporting quality of life did so in different ways. Although recent studies often use the QLQ‐C30, the outcomes were reported in the form of either mean values with SD, change from the baseline, proportions improved, or mean area under the curve. This prohibited a meta‐analysis of quality of life outcomes. The five studies were not representative for all the studies in this analysis, as four of them tested a targeted agent, and four did not report data separately for the esophageal and GE‐junction cancer subgroup. However, the quality of life improved in the arms with the additional agent.
Sensitivity analysis: effect of the intervention in participants with esophageal and GE‐junction cancer versus gastric cancer
We conducted this sensitivity analysis to investigate whether there was a significant difference in the effect of the intervention between both the participants with esophageal and GE‐junction cancer and the participants with gastric cancer. The sensitivity analysis consisted of two parts, both regarding OS. Firstly, we compared the group of studies that included participants with both esophageal/GE‐junction and gastric cancer to the group of studies that included only participants with esophageal and GE‐junction cancer through a meta‐regression analysis. In this meta‐regression analysis, the interventions between groups of studies were not similar, making the comparison indirect. Therefore, we performed a second sensitivity analysis, also by meta‐regression, that focused on five studies that reported the effect of the intervention on OS for participant groups with both GE‐junction and gastric cancer separately.
For the first part of the sensitivity analysis, we meta‐analyzed the group of studies that included participants with both esophageal/GE‐junction and gastric cancer. This group contained eight studies and 1755 participants, 459 of whom had esophageal or GE‐junction cancer (Al‐Batran 2013; Iveson 2014; Ohtsu 2011; Rao 2010; Richards 2013; Shen 2014; Tebbutt 2002; Thuss‐Patience 2011). Iveson 2014 investigated rilotumumab at two concentrations, 7.5 mg/kg and 15 mg/kg. The HR that we used in the meta‐analysis was derived from both groups versus the control arm. In this analysis, the overall HR, in favor of the arm with the additional agent was 0.94 (95% CI 0.83 to 1.05), showing a trend toward a survival benefit in the arm with the additional agent versus the control arm (Analysis 2.1). Cochrane's Q test for heterogeneity showed a considerable amount of heterogeneity (I2 = 54%, P = 0.03), which indicated that results of the different studies were somewhat inconsistent in their findings.
We performed a meta‐regression analysis to compare the effect of the intervention in studies involving participants with esophageal and GE‐junction cancer (main analysis group, HR 0.75, 95% CI 0.68 to 0.84, high‐quality evidence), versus studies in participants with both gastric and esophageal/GE‐junction cancer (HR 0.94, 95% CI 0.83 to 1.05). This meta‐regression analysis showed that there was a difference in the effect of intervention between the two groups of studies (P = 0.004).
For the second part of the sensitivity analysis, we assessed the group of studies reporting the effect of the intervention on OS for participants with both GE‐junction and gastric cancer separately in two meta‐analyses, each containing five studies (Bang 2010; Ford 2014; Fuchs 2014; Lordick 2013; Wilke 2014). The meta‐analysis of the participant subgroups with GE‐junction cancer contained 538 participants. The meta‐analysis of the participant subgroups with gastric cancer contained 2093 participants. The effect of adding a chemotherapeutic or targeted therapeutic agent in the participant subgroups with GE‐junction cancer on OS in these studies was HR 0.66 (95% CI 0.54 to 0.81; Analysis 3.1). The effect of adding a chemotherapeutic or targeted therapeutic agent to the participant subgroups with gastric cancer in these studies was HR 0.89 (95% CI 0.76 to 1.04; Analysis 3.2). That said, this was a selected group of participants with gastric cancer, so this meta‐analysis might not accurately reflect the effect of adding a chemotherapeutic or targeted agent to the control regimen of participants with gastric cancer in general. This meta‐analysis was not meant to be exhaustive with regard to the effect of chemotherapy or targeted therapy in people with gastric cancer. For more information, see Wagner 2010. We performed a meta‐regression analysis between these groups, which indicated that both participant subgroups responded significantly differently to the investigated interventions (P = 0.03), in line with the first part of the sensitivity analysis. This meta‐regression analysis indicated that the studied interventions appeared to result in an increased beneficial effect on OS in participants with GE‐junction cancer compared to participants with gastric cancer. Therefore, we excluded the studies that also included participants with gastric cancer and did not report outcomes separately from the meta‐analyses of this review.
Subcomparison 1: chemotherapy or targeted therapy plus BSC versus BSC
Overall survival
Five studies in 750 participants contributed data to this meta‐analysis (Dutton 2014; Ford 2014; Fuchs 2014; Levard 1998; Nicolaou 1982). For overall survival, we found an HR of 0.81 (95% CI 0.71 to 0.92, high‐quality evidence; Analysis 4.1;Figure 6) in favor of the chemotherapy or targeted therapy arm. Median OS, weighted for study size, in the chemotherapy arm was 4.7 months versus 4.2 months in the BSC arm. Only two studies used first‐line therapies (Levard 1998; Nicolaou 1982), while the others used second‐line. Cochrane's Q test for heterogeneity was non‐significant (I2 = 0%, P = 0.56), which indicated that results of the five studies were consistent in their findings.

Forest plot of subcomparison 1: chemotherapy or targeted therapy agent(s) plus BSC versus BSC, outcome 4.1: overall survival.
Progression‐free survival
Two studies in 540 participants contributed data to this meta‐analysis (Dutton 2014; Fuchs 2014). Both studies assessed a targeted therapeutic agent. The other three studies did not report on PFS. The overall HR of 0.58 (95% CI 0.28 to 1.18, very low‐quality evidence; Analysis 4.2; Figure 7) in favor of targeted therapy demonstrated that there was a larger, non‐significant effect estimate toward a PFS benefit when participants received targeted therapy; however, we are uncertain of these findings due to the very low quality of evidence. Median progression‐free survival was only available from Dutton 2014 and was 1.6 months in the targeted therapy arm versus 1.2 months in the BSC arm. Cochrane's Q test for heterogeneity showed significant heterogeneity (I2 = 85%, P = 0.01), which indicated that results of the two studies were not consistent.
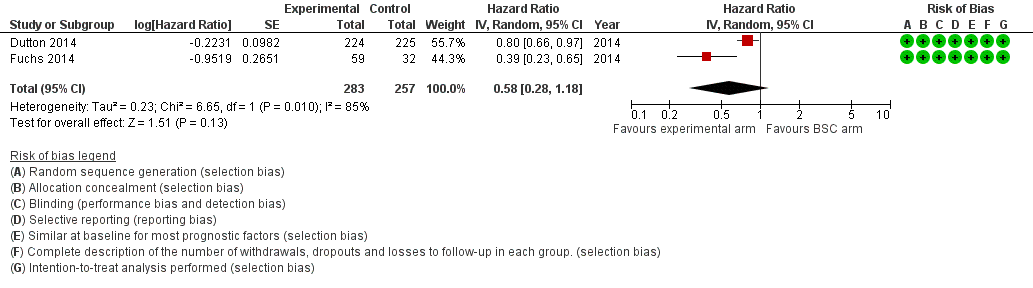
Forest plot of subcomparison 1: chemotherapy or targeted therapy agent(s) plus BSC versus BSC, outcome 4.1: progression free survival.
Subcomparison 2: participants who had received previous chemotherapy
We intended for this subcomparison to investigate whether chemotherapy or targeted therapy for participants that had previously received chemotherapy resulted in a benefit for overall survival, progression‐free survival, or both. We did not include studies if only some of the participants had received previous chemotherapy. For a description of criteria used for including studies with regard to previous chemotherapy, see Characteristics of included studies, 'Partipants' section.
Overall survival
This meta‐analysis included four studies in 769 participants (Dutton 2014; Ford 2014; Fuchs 2014; Wilke 2014). Three studies included participants with GE‐junction cancer only. In Dutton 2014, 24% of the esophageal cancers were SCC. Two studies investigated ramucirumab (Fuchs 2014; Wilke 2014), which we analyzed separately in subgroup analysis 4b. The overall HR of 0.71 (95% CI 0.54 to 0.94, moderate‐quality evidence; Analysis 5.1) in favor of the arm with the additional agent demonstrated that an additional chemotherapeutic or targeted agent leads to a survival benefit. Median OS, weighted for study size, was 5.1 months in the chemotherapy arm versus 4.4 months in the BSC arm. Cochrane's Q test for heterogeneity showed significant heterogeneity (I2 = 57%, P = 0.07), indicating that results of the three included studies were quite inconsistent in their findings.
Progression‐free survival
Three studies in 677 participants contributed data to this meta‐analysis (Dutton 2014; Fuchs 2014; Wilke 2014). All three studies investigated targeted agents. Two studies (both of ramucirumab) included participants with GE‐junction cancer only. In the third study, 24% of the esophageal cancers were SCC. The overall HR of 0.51 (95% CI 0.29 to 0.90, low‐quality evidence; Analysis 5.2) in favor of the targeted therapy arms demonstrated that there may be a PFS benefit for people receiving targeted therapy agents. Cochrane's Q test for heterogeneity showed substantial heterogeneity (I2 = 83%, P < 0.001), which indicated that results of the three studies were inconsistent in their findings.
Subcomparison 3: chemotherapy agent(s) plus control intervention versus control intervention alone
Overall survival
Five studies in 358 participants contributed data to this meta‐analysis (Bleiberg 1997; Ford 2014; Huang 2009; Levard 1998; Nicolaou 1982). The overall HR of 0.73 (95% CI 0.63 to 0.85, moderate‐quality evidence; Analysis 1.1; Figure 3, subcomparison 3) in favor of the arm with the additional chemotherapy agent demonstrates that there is probably a significant survival benefit in people receiving an additional chemotherapy agent. Median survival time, weighted for study size, was 6.9 months in the chemotherapy arm versus 5.8 months in the control arm. We could not include Huang 2009 in the median OS analysis because it did not report this outcome. Cochrane's Q test for heterogeneity showed non‐significant heterogeneity (I2 = 0%, P = 0.50), which indicated that results of the five studies were consistent in their findings. Considering the limited number of studies and the low heterogeneity in the model, we consider that the quality of evidence is moderate.
One study included in the comparison did not contribute to the meta‐analysis for subcomparison 3 for OS because the publication did not provide enough information. Wilkes 2011 only reported that survival was not affected by group allocation or whether the participant was able to complete the protocol.
Progression‐free survival
None of the four studies reported on PFS.
Subcomparison 4: targeted agent plus control intervention versus control intervention alone.
Overall survival
Six studies with 989 participants contributed to this meta‐analysis (Bang 2010; Dutton 2014; Fuchs 2014; Lordick 2013; Lorenzen 2009; Wilke 2014). The overall HR in favor of the arm containing a targeted agent was 0.75 (95% CI 0.63 to 0.90, high‐quality evidence). This analysis demonstrated a survival benefit for participants randomized to the arm with the additional targeted agents (Analysis 1.1; Figure 3, subcomparison 4). Median OS in the arm with the additional targeted agent, weighted for study size, was 6.7 months versus 5.7 months in the control arm. We could not include Bang 2010 because it did not report median OS data. Cochrane's Q test for heterogeneity showed low heterogeneity (I2 = 24%, P = 0.25), indicating that results of the different studies were quite consistent in their findings.
Two studies included in the meta‐analysis selected participants based on biomarker expression (Bang 2010; Lorenzen 2009). Xu 2013a found higher PFS and OS in the nimotuzumab group. However, the study did not provide enough information to extract HRs, so we could not include it in the analyses.
Subgroup analysis 4a: EGFR‐targeting agent plus control intervention versus control intervention alone
Three studies in 655 participants contributed data to this meta‐analysis (Dutton 2014; Lordick 2013; Lorenzen 2009). The overall HR of 0.86 (95% CI 0.73 to 1.01, moderate‐quality evidence; Analysis 6.1) in favor of the arms that contained an EGFR‐targeting agent showed that there is probably a survival benefit in the arm with the additional EGFR‐targeting agent. Cochrane's Q test for heterogeneity showed no significant heterogeneity (I2 = 0%, P = 0.56), which indicated that results of the four studies were very consistent in their findings. Median OS, weighted for study size, was 6.4 months in the treatment arm containing an EGFR‐targeting agent versus 5.5 months in the control arm.
One study included in the meta‐analysis selected participants based on biomarker expression (Lorenzen 2009). Xu 2013a found higher PFS and the OS in the nimotuzumab group. However, the study did not provide enough information to extract HRs, so we could not include it in the meta‐analysis.
Waddell 2013 investigated panitumumab. We could not formally include this study in the comparison because the control regimen was adjusted in the arm with the additional EGFR‐targeting agent. This study found that the addition of panitumumab resulted in an HR for OS of 1.37 (95% CI 1.07 to 1.76), but readers should interpret these results with caution.
Subgroup analysis 4b: cetuximab plus control intervention versus control intervention alone
Two studies in 206 participants contributed data to this meta‐analysis (Lordick 2013; Lorenzen 2009). Lordick 2013 investigated the addition of cetuximab to a control arm of capecitabine plus cisplatin; Lorenzen 2009 used cisplatin plus 5‐FU as a control regimen. The overall HR of 0.76 (95% CI 0.55 to 1.04, low‐quality evidence; Analysis 7.1) in favor of the cetuximab arm showed that there may be a non‐significant survival benefit for participants randomized to receive cetuximab. Median OS, weighted for study size, was 12.2 months in the cetuximab arm versus 9.4 months in the control arm. Cochrane's Q test for heterogeneity showed non‐significant heterogeneity (I2 = 0%, P = 0.58), which indicated that results of the two studies were consistent in their findings. One study included in the meta‐analysis selected participants based on biomarker expression (Lorenzen 2009).
Subgroup analysis 4c: ramucirumab plus control intervention versus control intervention alone
Two studies in 228 participants contributed data to this meta‐analysis (Fuchs 2014; Wilke 2014). Fuchs 2014 investigated ramucirumab versus BSC, while Wilke 2014 added ramucirumab to paclitaxe. The two studies included only people with GE‐junction cancer who had previously received chemotherapy, so the results of this meta‐analysis are not generalizable to other patient populations. The overall HR of 0.62 (95% CI 0.43 to 0.88, moderate‐quality evidence; Analysis 8.1) in favor of the ramucirumab arm showed that there is probably an overall survival benefit. Median OS, weighted for study size, was 7.5 months in the ramucirumab arm versus 6.3 months in the control arm. Cochrane's Q test for heterogeneity showed non‐significant heterogeneity (I2 = 28%, P = 0.24), which indicated that results of the two studies were consistent in their findings.
Progression‐free survival
Five studies in 883 participants contributed data to this meta‐analysis (Dutton 2014; Fuchs 2014; Lordick 2013; Lorenzen 2009; Wilke 2014). The five studies investigated targeted therapies. In this analysis, the overall HR, in favor of the treatment arm that contained a targeted therapy agent, was 0.64 (95% CI 0.45 to 0.92, moderate‐quality evidence). This showed that there is probably a PFS benefit for people treated with the targeted therapy agent (Analysis 1.2;Figure 5). Median progression‐free survival, weighted for study size, was 2.9 months in the arm with the additional targeted therapy agent versus 2.4 months in the control arm. We could not include two studies in the analysis because they did not report median PFS data (Fuchs 2014; Wilke 2014). Cochrane's Q test for heterogeneity showed substantial heterogeneity (I2 = 79%, P < 0.001), which indicated that results of the individual studies were quite inconsistent in their findings. One study included in the meta‐analysis selected participants based on biomarker expression (Lorenzen 2009).
Subgroup analysis 4a: EGFR‐targeting agent plus control intervention versus control intervention alone
Three studies in 655 participants contributed data to this meta‐analysis (Dutton 2014; Lordick 2013; Lorenzen 2009). The overall HR of 0.85 (95% CI 0.73 to 1.00, low‐quality evidence; Analysis 6.2) in favor of the arm with the EGFR‐targeting agent demonstrated that there may be a non‐significant PFS benefit in the arms with the EGFR‐targeting agents. Cochrane's Q test for heterogeneity showed non‐significant results (I2 = 2%, P = 0.36), which indicated that results of the three studies were consistent in their findings. Median progression‐free survival, weighted for study size, was 2.9 months in the treatment arm that contained an EGFR‐targeting agent versus 2.4 months in the control arm.
One study included in the meta‐analysis selected participants based on biomarker expression (Lorenzen 2009). Waddell 2013 investigated panitumumab, but we could not formally include it in the comparison because the control regimen was adjusted in the panitumumab arm. The addition of panitumumab resulted in an HR for PFS of 1.22 (95% CI 0.98 to 1.52), but readers should interpret these results with caution.
Subgroup analysis 4b: cetuximab plus control intervention versus control intervention alone
Two studies in 206 participants contributed data to this meta‐analysis (Lordick 2013; Lorenzen 2009). The overall HR of 0.90 (95% CI 0.59 to 1.37, very low‐quality evidence; Analysis 7.2) shows a small and very uncertain PFS benefit in favor of the cetuximab arm. Median progression‐free survival, weighted for study size, was 5.7 months in the cetuximab arms versus 5.0 months in the control arms. Cochrane's Q test for heterogeneity showed a considerable amount of heterogeneity (I2 = 53%, P = 0.14), which indicated that results of the two studies were not very consistent in their findings. One study included in the meta‐analysis selected participants based on biomarker expression (Lorenzen 2009).
Subgroup analysis 4c: ramucirumab plus control intervention versus control intervention alone
Two studies in 228 participants contributed data to this meta‐analysis (Fuchs 2014; Wilke 2014). This meta‐analysis only applies to GE‐junction participants, the only participants included. The overall HR of 0.39 (95% CI 0.28 to 0.54, moderate‐quality evidence; Analysis 8.2) in favor of the ramucirumab arm demonstrated that there was probably a PFS benefit in the ramucirumab group. We could not determine median PFS, as neither study reported this outcome. Cochrane's Q test for heterogeneity showed non‐significant heterogeneity (I2 = 0%, P = 0.99), which indicated that results of the two studies were very consistent in their findings.
Subcomparison 5: chemotherapy or targeted therapy agent(s) plus control intervention versus control intervention alone in participants with adenocarcinoma of the esophagus
Overall survival
Five studies in 538 participants contributed data to this meta‐analysis (Bang 2010; Ford 2014; Fuchs 2014; Lordick 2013; Wilke 2014). For overall survival, we found an HR of 0.66 (95% CI 0.54 to 0.81, high‐quality evidence; Analysis 9.1) in favor of the experimental arm. Median OS, weighted for study size, was 7.1 months in the added agent arm versus 6.0 months in the control arm. We could not include Bang 2010 because it did not report median overall survival data. Two studies were first‐line therapy regimens (Bang 2010; Lordick 2013), and three were second‐line therapies (Ford 2014; Fuchs 2014; Wilke 2014). Cochrane's Q test for heterogeneity was non‐significant (I2 = 0%, P = 0.55), which indicated that results from the five studies were consistent in their findings. Eatock 2013 investigated trebananib in participants with esophageal adenocarcinoma but did not provide enough detail for inclusion in the meta‐analysis. Median OS at the time of analysis were 9.1 months, 9.4 months, and 12.8 months for the 10.0 mg/kg, 3.0 mg/kg, and control arms, respectively.
Progression‐free survival
Four studies in 713 participants contributed data to this meta‐analysis (Dutton 2014; Fuchs 2014; Lordick 2013; Wilke 2014). For progression‐free survival, we found an HR of 0.62 (95% CI 0.38 to 1.00, very low‐quality evidence; Analysis 9.2) in favor of the experimental arm; however, we are uncertain of these results due to the low‐quality evidence. Median OS, weighted for study size, was 1.8 months in the added agent arm versus 1.7 months in the control arm. We could not include two studies in the analysis because they did not report median PFS data (Fuchs 2014; Wilke 2014). One study was on first‐line therapy regimens (Lordick 2013), and three were second‐line therapies (Dutton 2014; Fuchs 2014; Wilke 2014). Cochrane's Q test for heterogeneity was non‐significant (I2 = 84%, P < 0.001), which indicated that results of the four studies were very inconsistent in their findings. Eatock 2013 investigated trebananib in participants with esophageal adenocarcinoma but did not provide enough detail for inclusion in the meta‐analysis. Median PFS times at the time of analysis were 4.2 months, 4.9 months, and 5.2 months for the 10.0 mg/kg, 3.0 mg/kg, and control arms, respectively.
Subcomparison 6: chemotherapy or targeted therapy agent(s) plus control intervention versus control intervention alone in participants with SCC of the esophagus
Overall survival
Four studies in 268 participants contributed data to this meta‐analysis (Bleiberg 1997; Levard 1998; Lorenzen 2009; Nicolaou 1982). For overall survival, we found an HR of 0.76 (95% CI 0.65 to 0.90, high‐quality evidence; Analysis 10.1) in favor of the experimental arm. Median OS, weighted for study size, was 8.0 months in the added agent arm versus 6.5 months in the control arm. All studies were first‐line therapy regimens. Cochrane's Q test for heterogeneity was non‐significant (I2 = 0%, P = 0.95), which indicated that results of the four studies were consistent in their findings. Xu 2013a found that the OS of the nimotuzumab group was increased relative to the control group.
Progression‐free survival
Two studies in 168 participants contributed data to this meta‐analysis (Dutton 2014; Lorenzen 2009). For overall survival, an HR of 0.72 (95% CI 0.55 to 0.96, low‐quality evidence; Analysis 10.2) showed that there may be a benefit in favor of the experimental arm. Median OS, weighted for study size, was 1.7 months in the added agent arm versus 1.2 months in the control arm. All studies were first‐line therapy regimens. Cochrane's Q test for heterogeneity was non‐significant (I2 = 0%, P = 0.97), which indicated that results of the four studies were consistent in their findings. Xu 2013a found that the PFS of the nimotuzumab group was higher than in the control group.
Studies excluded from the meta‐analysis
Li 2002 did not detect a difference between the response rates of participants with esophageal cancer who received atofluding (20.0%) versus ftorafur (24.6%). Ross 2002 reported that the overall response rate with epirubicin, cisplatin, and 5‐FU was 37.5% for participants with esophageal cancer and 54.8% for participants with GE‐junction cancer versus an overall response rate with mitomycin, cisplatin, and 5‐FU of 49.5% for participants with esophageal cancer and 41.5% for participants with GE‐junction cancer. Ezdinli 1980 reported median overall survival of 8.1 months for the adriamycin arm, 13.7 months for the methotrexate arm, and 15.4 months for the 5‐FU arm. Pang 2014 reported that the median OS of the intervention (leucovorin, 5‐FU, and cisplatin) was 12 months versus 9 months in the control group (cisplatin and S‐1) (P = 0.045). Waddell 2013 found that the addition of panitumumab resulted in an HR for OS of 1.37 (95% CI 1.07 to 1.76) and an HR for PFS of 1.22 (95% CI 0.98 to 1.52). This study adjusted the dose of the control regimen in the experimental arm. Our analysis did not include the information from studies that contain participants with esophageal and/or GE‐junction cancer alongside that from participants with gastric cancer. A meaningful sensitivity analysis was not possible, and we could not quantify the influence of the participants with gastric cancer on the outcome of the individual studies.
Discusión
Resumen de los resultados principales
La presente revisión y metanálisis solo incluyeron ECA. Ocho de los estudios incluidos informaron detalles sobre el cegamiento adecuado. Aparte del cegamiento, la debilidad metodológica más frecuente en los estudios incluidos fue la falta de descripción con respecto a la ocultación de la asignación. La quimioterapia paliativa o el tratamiento dirigido aumentaron significativamente la SG en comparación con el MTMA en los participantes con carcinoma esofágico o de la unión gastroesofágica. Además, los participantes que recibieron múltiples agentes terapéuticos dirigidos o agentes quimioterapéuticos tuvieron mayor SG y SLP. Aunque los efectos tóxicos relacionados con el tratamiento de al menos grado 3 ocurrieron con mayor frecuencia en los brazos con un agente quimioterapéutico o de tratamiento dirigido adicional, no hubo evidencia de que la quimioterapia paliativa ni el tratamiento dirigido disminuyeran la calidad de vida.
Comparación principal: Agente/s quimioterapéutico/s o de tratamiento dirigido más intervención control versus intervención control sola
El metanálisis se centró en el agregado de un agente quimioterapéutico o dirigido al régimen o al MTMA proporcionado en el brazo control. Este metanálisis aportó evidencia de un efecto beneficioso sobre la SG en los participantes tratados con un agente quimioterapéutico o de tratamiento dirigido adicional (Análisis 1.1; Figura 3). Los resultados de los diferentes estudios fueron consistentes en sus hallazgos. La mediana de la SG, ponderada por el tamaño del estudio, fue mayor en el brazo con el agente adicional versus el brazo control y no se encontraron efectos de estudios pequeños.
El metanálisis de la SLP proporcionó evidencia de un efecto beneficioso en los participantes que habían recibido un agente dirigido adicional (Análisis 1.2; Figura 5). La mediana de la supervivencia libre de progresión, ponderada por el tamaño del estudio, fue mayor en el brazo con el agente adicional versus el brazo control. La quimioterapia paliativa o el tratamiento dirigido parecen aumentar la frecuencia de la toxicidad relacionada con el tratamiento de al menos grado 3. Sin embargo, no parecieron ocurrir con mayor frecuencia muertes relacionadas con el tratamiento. Cinco estudios incluidos en este análisis midieron la calidad de vida con métodos validados. Aunque los cinco estudios no fueron representativos de todos los estudios en este análisis, ya que cuatro de cinco evaluaron un agente dirigido y cuatro no informaron los datos por separado para el subgrupo con cáncer esofágico y de la unión gastroesofágica, la calidad de vida mejoró en los brazos con el agente adicional.
Análisis de sensibilidad: efecto de la intervención en pacientes con cáncer esofágico y de la unión gastroesofágica versus cáncer gástrico
El grupo de estudios que también incluyó pacientes con cáncer gástrico se incluyó en otro metanálisis. Posteriormente se realizó un análisis de metarregresión entre estos estudios y los que incluyeron solamente pacientes con cáncer esofágico y de la unión gastroesofágica. Este análisis mostró heterogeneidad significativa entre los grupos de estudio. Los estudios que incluyeron pacientes con cáncer esofágico o de la unión gastroesofágica solamente mostraron una reducción del riesgo mayor en la SG en comparación con los estudios que también incluyeron pacientes con cáncer gástrico. En este análisis de sensibilidad, las intervenciones entre los grupos de estudios no fueron similares, lo que complicó realizar una comparación directa. Por lo tanto, se realizó un segundo análisis de sensibilidad que se centró en cinco estudios que informaron el efecto de la intervención sobre la SG en los participantes con cáncer de la unión gastroesofágica y gástrico por separado. Este análisis de metarregresión indicó que las intervenciones estudiadas parecieron dar lugar a un mayor efecto beneficioso sobre la SG en los participantes con cáncer de la unión gastroesofágica en comparación con los participantes con cáncer gástrico. Por lo tanto, los estudios que incluyeron pacientes con cáncer gástrico se excluyeron de los metanálisis de la presente revisión. No se realizaron análisis adicionales de metarregresión porque no fue posible una comparación entre los grupos de participantes expuestos a la misma intervención. Además, el tamaño de la muestra fue demasiado pequeño para realizar análisis de metarregresión de las respuestas en diferentes grupos de pacientes a través de las intervenciones.
Subcomparación 1: quimioterapia o tratamiento dirigido más MTMA versus MTMA
Este análisis mostró que la quimioterapia paliativa o el tratamiento dirigido en los participantes con cáncer esofágico o de la unión gastroesofágica en el contexto paliativo aumentaron la SG (Análisis 4.1; Figura 6). No existe seguridad acerca de si la SLP aumenta cuando los participantes con cáncer esofágico o de la unión gastroesofágica recibieron quimioterapia o tratamiento dirigido en el contexto paliativo (Análisis 4.2; Figura 7). Cuando se consideran los datos disponibles, los niveles de toxicidad fueron similares en ambos brazos de los estudios, excepto en Levard 1998. Solamente Dutton 2014 describió la calidad de vida, y mostró una tendencia hacia la mejoría en el brazo de quimioterapia en un dominio.
Subcomparación 2: pacientes que habían recibido quimioterapia anterior
En el análisis principal se analizaron la quimioterapia paliativa de primera y segunda línea juntas. En la subcomparación 2 se investigó el efecto de la intervención en pacientes que habían recibido quimioterapia anterior, es decir, los estudios de tratamiento paliativo de segunda línea. Este subanálisis mostró un probable efecto beneficioso sobre la SG incluso en los participantes con quimioterapia previa que recibieron quimioterapia o tratamiento dirigido adicionales (es decir, tratamiento de segunda línea). Con respecto a la SLP, puede haber un efecto beneficioso en los participantes tratados con un agente dirigido adicional.
Subcomparación 3: agente/s de quimioterapia más intervención control versus intervención control sola
Los metanálisis de la subcomparación 3 para la SG demostraron que probablemente hay un efecto con respecto a la SG a favor del brazo con el agente quimioterapéutico adicional, (Análisis 1.1; Figura 3, subcomparación 3). La mediana de la SG en el brazo con el agente quimioterapéutico adicional, ponderada por el tamaño del estudio, fue mayor que en el brazo control.
Subcomparación 4: agente de tratamiento dirigido más intervención control versus intervención control sola
Los metanálisis de la subcomparación 4 con respecto a la SG demostraron la presencia de un efecto con respecto a la SG a favor del brazo con el agente dirigido adicional (Análisis 1.1; Figura 3, subcomparación 4). La mediana de la supervivencia general en el brazo con el agente dirigido adicional, ponderada por el tamaño del estudio, fue mayor que en el brazo control. Se realizó un análisis de subgrupos con tres estudios que investigaron los agentes dirigidos a la señalización del EGFR, que encontraron que estos agentes probablemente prolongan la SG. Por lo tanto, cetuximab, un agente dirigido al EGFR, puede reducir el riesgo de muerte. Se realizó otro análisis de subgrupos que se centró en los estudios que investigaron ramucirumab y encontró que este agente también es probable que reduzca el riesgo de muerte. Los dos estudios incluyeron solamente pacientes con cáncer de la unión gastroesofágica. Los metanálisis de la subcomparación 4 con respecto a la SLP fueron idénticos al metanálisis de la comparación 1 para la SLP, como se describe anteriormente. Se realizó un análisis de subgrupos que investigó los agentes dirigidos al EGFR más intervención control versus intervención control sola, que encontró una posible reducción del CRI de la SLP. Posteriormente se analizó cetuximab más intervención control versus intervención control sola; los resultados mostraron incertidumbre con respecto a si este agente reduce el CRI de la SLP. Se realizó un tercer análisis de subgrupos que se centró en los estudios que investigaron ramucirumab más intervención control versus intervención control sola. Lo anterior dio lugar a una probable reducción del CRI a favor del brazo ramucirumab, lo que indica un efecto beneficioso sobre la SLP en el grupo ramucirumab. Este metanálisis solo se aplica a los participantes con cáncer de la unión gastroesofágica. Con respecto a la calidad de vida, Wilke 2014 y Dutton 2014 no informaron diferencias entre los grupos. Además, Fuchs 2014 informó una tendencia hacia una mejor calidad de vida en el brazo con el agregado del tratamiento dirigido, en este caso ramucirumab.
Subcomparación 5: agente/s quimioterapéutico/s o de tratamiento dirigido más intervención control versus intervención control sola en pacientes con adenocarcinoma de esófago
Los metanálisis de la subcomparación 5 con respecto a la SG demostraron la presencia de un efecto a favor del brazo con un agente quimioterapéutico o de tratamiento dirigido adicional (Análisis 9.1). La mediana de la SG en el brazo con el agente quimioterapéutico adicional, ponderada por el tamaño del estudio, fue mayor que en el brazo control.
Subcomparación 6: agente/s quimioterapéutico/s o de tratamiento dirigido más intervención control versus intervención control sola en pacientes con CCE de esófago
Los metanálisis de la subcomparación 6 con respecto a la SG demostraron la presencia de un efecto con respecto a la SG a favor del brazo con un agente quimioterapéutico o de tratamiento dirigido adicional (Análisis 10.1). La mediana de la SG en el brazo con el agente quimioterapéutico adicional, ponderada por el tamaño del estudio, fue mayor que en el brazo control.
Compleción y aplicabilidad general de las pruebas
En la mayoría de los estudios incluidos, los participantes fueron solo parcialmente representativos de todos los pacientes con cáncer esofágico y de la unión gastroesofágica. Por ejemplo, generalmente fueron más jóvenes, con una mediana de edad de 60 años, en comparación con la población general de pacientes con cáncer esofágico y de la unión gastroesofágica. La proporción de participantes con enfermedad metastásica fue del 69% al 100%, que es aproximadamente equivalente a la población que se atiende habitualmente en el consultorio. El porcentaje de participantes con ECOG‐2 o ‐3 varió del 0% al 35% en los estudios incluidos. Dos estudios seleccionaron a los participantes según la expresión de los marcadores biológicos tumorales y sus resultados no se pueden extrapolar a los pacientes que no tienen expresión de los marcadores biológicos como se definió en estos estudios. Es de esperar que el efecto de un tratamiento dirigido dependa de la presencia del objetivo en el tumor. Lorenzen 2009 solamente incluyó pacientes con cáncer EGFR‐positivo y Bang 2010 solamente incluyó pacientes con cáncer HER2‐positivo. Por lo tanto, no es posible aplicar los resultados de estos estudios a todos los pacientes, y no está claro si son igualmente generalizables a todos los pacientes con cáncer esofágico y de la unión gastroesofágica. Además, no fue factible diferenciar entre los participantes con CCE esofágico y adenocarcinoma, ni investigar su respuesta a diversos tratamientos de manera individual debido a que no hubo suficientes datos disponibles.
La aplicabilidad de un tratamiento paliativo que muestra un aumento en la supervivencia pero no muestra evidencia de efecto sobre la calidad de vida es poco clara. Por lo tanto, la preservación de la calidad de vida es una meta importante y debe ser una medida de resultado en los estudios clínicos de las modalidades de tratamiento paliativo (Blazeby 2001). Debido a que no todos los estudios incluidos informaron la calidad de vida de una manera validada, solamente es posible establecer la conclusión de que no existe evidencia de que la quimioterapia paliativa ni el tratamiento dirigido reduzcan la calidad de vida. Hay diversas medidas validadas disponibles para evaluar la calidad de vida genérica y la específica de la enfermedad. La medida utilizada con mayor frecuencia para el cáncer esofágico es el EORTC QLQ‐C30 (Aaronson 1993). Esta medida está diseñada específicamente para medir la calidad de vida en las personas diagnosticadas con cáncer. Un agregado valioso a este cuestionario es el EORTC QLQ‐OES18, una medida diseñada específicamente para los pacientes con cáncer esofágico que contiene preguntas más específicas sobre la disfagia, el dolor torácico y los síntomas de reflujo (Blazeby 2003). Solamente Rao 2010 utilizó esta última medida. Estudios más recientes a menudo utilizan el QLQ‐C30 para medir la calidad de vida.
La ganancia en la mediana de la supervivencia absoluta encontrada en los análisis descritos anteriormente, ponderada por el tamaño del estudio, es limitada. Para el análisis principal, esta ganancia en la supervivencia se aplica al agregado de 1,1 agentes como promedio. El agregado de tres agentes al MTMA, por ejemplo, probablemente aumentará la ganancia en la supervivencia absoluta. Además, este análisis también incluyó estudios de segunda línea en los cuales la posible ganancia en la supervivencia es probablemente menor en términos absolutos en comparación con los regímenes de atención paliativa de primera línea. Excepto por estas limitaciones, los lectores pueden considerar la evidencia citada anteriormente como completa y aplicable.
Calidad de la evidencia
En general se consideró que los ECA analizados tuvieron bajo riesgo de sesgo en la mayoría de los dominios. Sin embargo, con frecuencia los estudios tuvieron riesgo de sesgo incierto o alto con respecto al cegamiento y la ocultación de la asignación. Los ECA más recientes a menudo contenían información más útil para determinar el riesgo de sesgo en sus descripciones de la metodología, en comparación con los ECA más antiguos. Para más detalles acerca del riesgo de sesgo, ver "Riesgo de sesgo en los estudios incluidos".
Se han aplicado varios regímenes de quimioterapia y de tratamiento dirigido para el cáncer esofágico y de la unión gastroesofágica en un contexto paliativo. Debido a que los regímenes en los ECA incluidos en esta revisión son muy heterogéneos, a menudo no fue factible hacer una comparación directa entre los diversos agentes quimioterapéuticos. Los únicos agentes que se investigaron en más de un ensayo al agregarlos de manera individual a un régimen control fueron cetuximab y ramucirumab. Debido a la heterogeneidad de los agentes utilizados, la mayoría de la información se puede extraer de un análisis en la forma de la comparación principal. Sin embargo, en gran parte todavía no está claro qué agentes dan lugar a un efecto beneficioso en la supervivencia. Evidencia de calidad moderada apoya la efectividad de ramucirumab, y el tratamiento dirigido a la señalización del EGFR parece alentador. La misma heterogeneidad está presente en los agentes que constituyen los brazos control de los estudios. Actualmente algunos de estos agentes ya no se utilizan o se utilizan con muy poca frecuencia. Los estudios que prueban agentes sobre la base de los regímenes más populares, por ejemplo, que contienen agentes con platino y 5‐FU, podrían influir en el efecto agregado del agente evaluado sobre la supervivencia.
Sesgos potenciales en el proceso de revisión
Una amenaza significativa para la validez de la revisión fue la posibilidad de sesgo de publicación, es decir, que pueden no haberse publicado estudios que no encontraron que los tratamientos fueron efectivos. Los efectos de estudios pequeños como sesgo de publicación se investigaron de una manera cualitativa mediante un gráfico en embudo (Figura 4), pero no se encontró evidencia de su presencia.
Acuerdos y desacuerdos con otros estudios o revisiones
Mohammad 2015 investigó si un régimen triple fue superior a un régimen doble en cuanto a la supervivencia general, la supervivencia libre de progresión y la tasa de respuesta objetiva en participantes que recibieron quimioterapia de primera línea para el carcinoma gastroesofágico avanzado o metastásico. Encontró una mejoría significativa en la SG a favor de un régimen triple (CRI 0,90; IC del 95%: 0,83 a 0,97). Además, encontró que la toxicidad grado 3 y 4 fue significativamente mayor con los regímenes triples. Ambas conclusiones coinciden con los resultados de la presente revisión.
Amdal 2013 investigó el efecto de la radioterapia y la quimioterapia paliativas sobre los síntomas y la calidad de vida, evaluados mediante los resultados informados por el paciente y las mediciones de la toxicidad en pacientes con cáncer esofágico. Tuvo poblaciones mixtas que incluyeron pacientes con cáncer gástrico, esofágico o de la unión gastroesofágica. No encontró una asociación clara entre la calidad de vida y la toxicidad del tratamiento. Es interesante señalar que dos de los ECA incluidos en la presente revisión, que investigaron la quimioterapia, informaron mejor calidad de vida a pesar de haber más toxicidad del tratamiento en el brazo experimental versus el brazo estándar (Van Cutsem 2006; Waters 1999).
Existen diferencias en los factores de riesgo, la expresión de los genes y la biología tumoral entre el adenocarcinoma de estómago, de la unión gastroesofágica y del esófago (Marsman 2005; Shah 2011). En esta revisión se encontraron diferencias en la eficacia de la quimioterapia y el tratamiento dirigido entre el adenocarcinoma de la unión gastroesofágica y el adenocarcinoma gástrico. Se encontró una tendencia similar en un estudio realizado por Chau 2009 que utilizó datos individuales de participantes de cuatro estudios (Cunningham 2008; Ross 2002; Tebbutt 2002; Waters 1999). Los autores concluyeron que las tasas de respuesta de los participantes fueron 44,1% en el cáncer esofágico, 41,1% en el cáncer de la unión gastroesofágica y 35,6% en el cáncer gástrico. Con respecto al tratamiento quimioterapéutico del carcinoma gástrico avanzado, se publicó una revisión Cochrane (Wagner 2010).

Study flow diagram: review update

Risk of bias summary: review authors' judgements about each risk of bias item for each included study.

Forest plot of the main analysis: chemotherapy or targeted therapy agent(s) plus control arm versus control arm, outcome: 1.1 Overall survival.

Funnel plot of the main comparison: chemotherapy or targeted therapy agent(s) plus control arm versus control arm, outcome: 1.1 Overall survival.

Forest plot of the main analysis: chemotherapy or targeted therapy agent(s) plus control arm versus control arm, outcome: 1.2 Progression free survival.
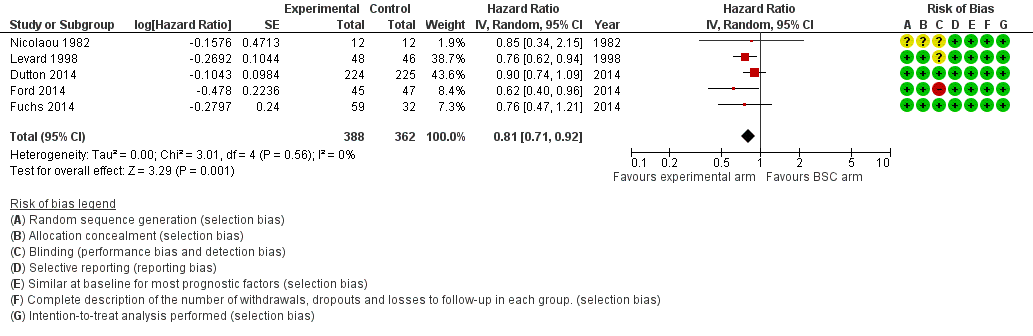
Forest plot of subcomparison 1: chemotherapy or targeted therapy agent(s) plus BSC versus BSC, outcome 4.1: overall survival.

Forest plot of subcomparison 1: chemotherapy or targeted therapy agent(s) plus BSC versus BSC, outcome 4.1: progression free survival.

Comparison 1 Main analysis: chemotherapy or targeted therapy agent(s) plus control intervention versus control intervention alone, Outcome 1 Overall survival.
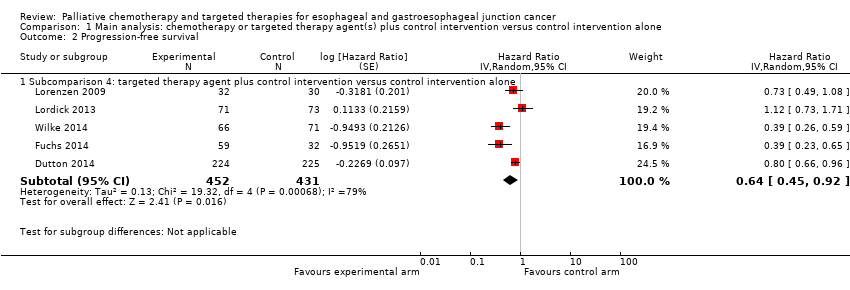
Comparison 1 Main analysis: chemotherapy or targeted therapy agent(s) plus control intervention versus control intervention alone, Outcome 2 Progression‐free survival.

Comparison 2 Sensitivity analysis: studies that also included participants with gastric cancer, Outcome 1 Overall survival.

Comparison 3 Sensitivity analysis: effect of intervention on participants with GE‐junction cancer versus effect of intervention on participants with gastric cancer, Outcome 1 Overall survival, GE‐junction cancer outcomes.

Comparison 3 Sensitivity analysis: effect of intervention on participants with GE‐junction cancer versus effect of intervention on participants with gastric cancer, Outcome 2 Overall survival, gastric cancer outcomes.

Comparison 4 Subcomparison 1: chemotherapy or targeted therapy plus BSC versus BSC, Outcome 1 Overall survival.

Comparison 4 Subcomparison 1: chemotherapy or targeted therapy plus BSC versus BSC, Outcome 2 Progression‐free survival.

Comparison 5 Subcomparison 2: studies with participants receiving second‐line therapy, Outcome 1 Overall survival.

Comparison 5 Subcomparison 2: studies with participants receiving second‐line therapy, Outcome 2 Progression‐free survival.
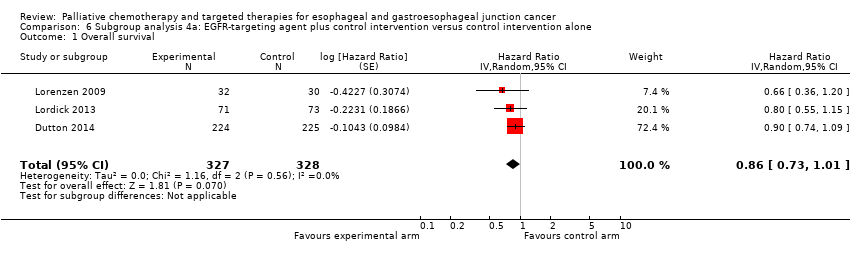
Comparison 6 Subgroup analysis 4a: EGFR‐targeting agent plus control intervention versus control intervention alone, Outcome 1 Overall survival.

Comparison 6 Subgroup analysis 4a: EGFR‐targeting agent plus control intervention versus control intervention alone, Outcome 2 Progression‐free survival.

Comparison 7 Subgroup analysis 4b: cetuximab plus control intervention versus control intervention alone, Outcome 1 Overall survival.

Comparison 7 Subgroup analysis 4b: cetuximab plus control intervention versus control intervention alone, Outcome 2 Progression‐free survival.

Comparison 8 Subgroup analysis 4c: ramucirumab plus control intervention versus control intervention alone, Outcome 1 Overall survival.

Comparison 8 Subgroup analysis 4c: ramucirumab plus control intervention versus control intervention alone, Outcome 2 Progression‐free survival.

Comparison 9 Subcomparison 5: chemotherapy or targeted therapy agent(s) plus control intervention versus control intervention alone in participants with AC of the esophagus, Outcome 1 Overall survival.
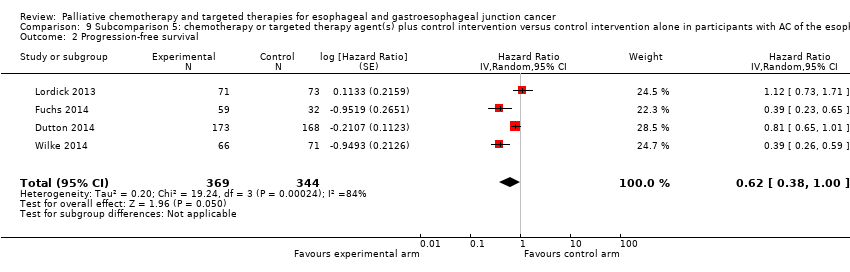
Comparison 9 Subcomparison 5: chemotherapy or targeted therapy agent(s) plus control intervention versus control intervention alone in participants with AC of the esophagus, Outcome 2 Progression‐free survival.

Comparison 10 Subcomparison 6: chemotherapy or targeted therapy agent(s) plus control arm versus control arm in participants with SCC of the esophagus, Outcome 1 Overall survival.

Comparison 10 Subcomparison 6: chemotherapy or targeted therapy agent(s) plus control arm versus control arm in participants with SCC of the esophagus, Outcome 2 Progression‐free survival.
| Chemotherapy or targeted therapy agent(s) plus control intervention versus control intervention alone for palliative treatment of esophageal and GE‐junction carcinoma | ||||
| Patient or population: palliative participants with esophageal and GE‐junction carcinoma Setting: hospital Intervention: chemotherapy or targeted therapy agent(s) plus control intervention Comparison: control intervention | ||||
| Outcome | Relative effect | No. of participants | Quality of the evidence | Comments |
| Overall survival | HR 0.75 (0.68 to 0.84) Median OS 6.7 months in the chemotherapy or targeted therapy agent(s) + control arm versus 5.7 months in the control arm | 1347 participants | ⊕⊕⊕⊕ | Quality not downgraded. Although participant populations and agents used differ between studies, there is low imprecision and low inconsistency. Cochrane's Q test for heterogeneity showed almost no heterogeneity (I2 = 5%, P = 0.50) |
| Progression‐free survival | HR 0.64 (0.45 to 0.92) | 883 participants (5 RCTs) | ⊕⊕⊕⊝ | Cochrane's Q test for heterogeneity showed considerable heterogeneity (I2 = 79%, P < 0.001) |
| Toxicity | Palliative chemotherapy and/or targeted therapy appear to increase the frequency of treatment‐related toxicity of at least grade 3. However, treatment‐related deaths did not occur more frequently. | For 3296 participants with esophageal, GE‐junction, and gastric cancer (9 RCTs) information was provided on toxicity according to WHO or NCI‐CTC guidelines. For at least 1189 participants with esophageal and GE‐junction cancer from these trials, toxicity was reported. | ⊕⊝⊝⊝ | Small sample size of studies reporting toxicity for the esophageal and GE‐junction cancer subgroup separately, for both arms, and with validated methods. Heterogeneity in the relative frequency of toxicities due to palliative chemotherapy and/or targeted therapy. |
| Quality of life | Quality of life was measured with validated methods in 5 studies included in this analysis. Although the 5 studies were not representative of all the studies in this analysis, as 4 tested a targeted agent, the quality of life reported improved in the arms with the additional agent. | For 1870 participants with esophageal, GE‐junction, and gastric cancer (5 RCTs), information was provided on quality of life. For at least 823 participants with esophageal and GE‐junction cancer, quality of life was reported. | ⊕⊝⊝⊝ | Small sample size of studies reporting data for the esophageal and GE‐junction cancer subgroup separately whilst using validated methods |
| CI: confidence interval; GE: gastroesophageal; HR: hazard ratio; NCI‐CTC: National Cancer Institute Common Toxicity Criteria; OS: overall survival; RCT: randomized controlled trial; WHO: World Health Organization. | ||||
| GRADE Working Group grades of evidence | ||||
| aDowngraded by one level due to inconsistency. | ||||
| Sensitivity analysis: chemotherapy or targeted therapy agent(s) plus control intervention versus control intervention alone for palliating esophageal and GE‐junction carcinoma versus gastric carcinoma | |||||
| Patient or population: palliative participants with esophageal and GE‐junction carcinoma or gastric carcinoma Setting: hospital Intervention: chemotherapy or targeted therapy agent(s) plus control arm Comparison: control arm | |||||
| Comparison | Outcome | Relative effect | No. of participants | Quality of the evidence | Comments |
| Studies with gastric cancer participants in addition to eligible participants | Overall survival | HR 0.94 (0.83 to 1.05) | 1755 participants (8 RCTs) | It should not be judged independently as it is not meant to be an exhaustive summary of either esophageal, GE‐junction, or gastric cancer participant data. | Cochrane's Q test for heterogeneity showed considerable heterogeneity (I2 = 54%, P = 0.03). |
| Sensitivity analysis, meta‐regression analysis, first part | Overall survival | HR 0.75 (0.68 to 0.84) versus HR 0.94 (0.83 to 1.05), P = 0.004 (treatment has a significantly different effect) | 1347 participants | ⊕⊝⊝⊝ | Cochrane's Q test for heterogeneity showed almost no heterogeneity (I2 = 5%, P = 0.50) in the arm with esophageal and GE‐junction cancer participants. Cochrane's Q test for heterogeneity showed considerable heterogeneity (I2 = 54%, P = 0.03) in the arm that included also gastric cancer participants. |
| Sensitivity analysis, only esophageal and GE‐junction cancer participants | Overall survival | HR 0.66 (0.54 to 0.81) | 538 participants (5 RCTs) | It should not be judged independently as it is not meant to be an exhaustive summary of either esophageal and GE‐junction participant data. | Cochrane's Q test for heterogeneity showed no heterogeneity (I2 = 0%, P = 0.56). This meta‐analysis was not meant to be exhaustive with regard to the effect of chemotherapy or targeted therapy in people with esophageal and GE‐junction cancer. |
| Sensitivity analysis, only gastric cancer participants | Overall survival | HR 0.89 (0.76 to 1.04) | 2093 participants (5 RCTs) | It should not be judged independently as it is not meant to be an exhaustive summary of gastric cancer participant data. | Cochrane's Q test for heterogeneity showed heterogeneity (I2 = 52%, P = 0.08). This meta‐analysis was not meant to be exhaustive with regard to the effect of chemotherapy or targeted therapy in people with gastric cancer. |
| Sensitivity analysis, meta‐regression analysis, second part | Overall survival | HR 0.66 (0.54 to 0.81) versus HR 0.89 (0.76 to 1.04), P = 0.03 (treatment has a significantly different effect) | 538 participants (5 RCTs) versus 2093 participants (5 RCTs) | ⊕⊕⊕⊝ | Cochrane's Q test for heterogeneity showed no heterogeneity (I2 = 0%, P = 0.56) in the arm with only GE‐junction cancer participants and heterogeneity (I2 = 52%, P = 0.08) in the arm with only gastric cancer participants. This result applies only to GE‐junction versus gastric cancer. |
| CI: confidence interval; GE: gastroesophageal; HR: hazard ratio; OS: overall survival; RCT: randomized controlled trial. | |||||
| GRADE Working Group grades of evidence | |||||
| aDowngraded by three levels due to inconsistency in the group of studies with gastric cancer participants besides eligible participants. Additionally, quality was downgraded because the interventions in both groups of studies were not similar, making the comparison indirect. | |||||
| Subcomparison 1: chemotherapy or targeted therapy plus best supportive care (BSC) versus BSC for palliative treatment of esophageal and GE‐junction carcinoma | ||||
| Patient or population: palliative participants with esophageal and GE‐junction carcinoma Setting: hospital Intervention: chemotherapy or targeted therapy plus BSC Comparison: BSC | ||||
| Outcomes | Relative effect | No. of participants | Quality of the evidence | Comments |
| Overall survival | HR 0.81 (0.71 to 0.92) Median OS 4.7 months in the chemotherapy or targeted therapy arm versus 4.2 months in the BSC arm | 750 (5 RCTs) | ⊕⊕⊕⊕ | Quality not downgraded. Participant populations and agents used differ between studies. However, there is low imprecision and low inconsistency. Cochrane's Q test for heterogeneity showed almost no heterogeneity (I2 = 0%, P = 0.57), indicating that results of the studies were consistent. |
| Progression‐free survival | HR 0.58 (0.28 to 1.18) | 540 (2 RCTs) | ⊕⊝⊝⊝ | 95% CI includes benefit and harm. Cochrane's Q test for heterogeneity showed considerable heterogeneity (I2 = 85%, P = 0.01). |
| Toxicity | Palliative chemotherapy and/or targeted therapy appear to increase the frequency of treatment‐related toxicity of at least grade 3. However, treatment‐related deaths did not occur more frequently. | For 972 participants with esophageal, GE‐junction, and gastric cancer (3 RCTs) information was provided on toxicity according to WHO or NCI‐CTC guidelines. For at least 632 participants with esophageal and GE‐junction cancer from these trials, toxicity was reported. | ⊕⊝⊝⊝ | 3/5 studies reported on toxicities with validated methods. 1/3 studies reporting on toxicity, reported it for the esophageal and GE‐junction cancer subgroup separately, for both arms and with validated methods. |
| Quality of life | On average, the quality of life reported improved in the arms with the additional agent. | For 1129 participants with esophageal, GE‐junction, and gastric cancer (4 RCTs) information was provided on quality of life. For at least 789 participants with esophageal and GE‐junction cancer, quality of life was reported. | ⊕⊝⊝⊝ | 4/5 studies reported on quality of life. 2/4 studies reported quality of life separately for the esophageal and GE‐junction cancer subgroup. |
| BSC: best supportive care; CI: confidence interval; GE: gastroesophageal; HR: hazard ratio; NCI‐CTC: National Cancer Institute Common Toxicity Criteria; OS: overall survival; RCT: randomized controlled trial; WHO: World Health Organization. | ||||
| GRADE Working Group grades of evidence | ||||
| aDowngraded by three levels due to very serious imprecision (small sample size, 95% CI includes appreciable benefit and harm) and serious inconsistency. | ||||
| Subcomparison 2: second‐line chemotherapy or targeted therapy agent(s) plus control intervention versus control intervention alone for palliative treatment of esophageal and GE‐junction carcinoma | ||||
| Patient or population: palliative participants with esophageal and GE‐junction carcinoma previously treated with chemotherapy Setting: hospital Intervention: chemotherapy or targeted therapy agent(s) plus control arm Comparison: control arm | ||||
| Outcomes | Relative effect | No. of participants | Quality of the evidence | Comments |
| Overall survival | HR 0.71 (0.54 to 0.94) Median OS 5.1 months in the chemotherapy or targeted therapy arm versus 4.4 months in the BSC arm | 769 participants (4 RCTs) | ⊕⊕⊕⊝ | 2 studies investigated the same agent. Cochrane's Q test for heterogeneity showed considerable heterogeneity (I2 = 57%, P = 0.07) |
| Progression‐free survival | HR 0.51 (0.29 to 0.90) | 677 participants (3 RCTs) | ⊕⊕⊝⊝ | 2 studies investigated the same agent. Cochrane's Q test for heterogeneity showed considerable heterogeneity (I2 = 86%, P < 0.001) |
| Toxicity | Palliative chemotherapy and/or targeted therapy appear to increase the frequency of treatment‐related toxicity of at least grade 3. However, treatment‐related deaths did not occur more frequently. | For 1638 participants with esophageal, GE‐junction, and gastric cancer (4 RCTs) information was provided on toxicity according to WHO or NCI‐CTC guidelines. For at least 769 participants with esophageal and GE‐junction cancer from these trials toxicity was reported. | ⊕⊝⊝⊝ | 1/4 studies reported toxicity for the esophageal and GE‐junction cancer subgroup separately, for both arms, and with validated methods. |
| Quality of life | On average, the quality of life reported improved in the arms with the additional agent. | For 1638 participants with esophageal, GE‐junction, and gastric cancer (4 RCTs) information was provided on quality of life. For at least 769 participants with esophageal and GE‐junction cancer, quality of life was reported. | ⊕⊝⊝⊝ | 1/4 studies reported quality of life separately for the esophageal and GE‐junction cancer subgroup. |
| CI: confidence interval; GE: gastroesophageal; HR: hazard ratio; NCI‐CTC: National Cancer Institute Common Toxicity Criteria; OS: overall survival; RCT: randomized controlled trial; WHO: World Health Organization. | ||||
| GRADE Working Group grades of evidence | ||||
| aDowngraded by one level due to small sample size and inconsistency. | ||||
| Subcomparison 3: chemotherapy agent(s) plus control intervention versus control intervention alone for palliative treatment of esophageal and GE‐junction carcinoma | ||||
| Patient or population: palliative participants with esophageal and GE‐junction carcinoma Setting: hospital Intervention: chemotherapy agent(s) plus control arm Comparison: control arm | ||||
| Outcome | Relative effect | No. of participants | Quality of the evidence | Comments |
| Overall survival | HR 0.73 (0.63 to 0.85) Median OS 6.9 months in the chemotherapy + control arm versus 5.8 months in the control arm. | 358 participants (5 RCTs) | ⊕⊕⊕⊝ | There is low imprecision and low inconsistency. Cochrane's Q test for heterogeneity showed low heterogeneity (I2 = 0%, P = 0.50). |
| Progression‐free survival | No data on progression‐free survival was available for this comparison. | |||
| Toxicity | Palliative chemotherapy and/or targeted therapy appear to increase the frequency of treatment‐related toxicity of at least grade 3. However, treatment‐related deaths did not occur more frequently. | For 1638 participants with esophageal, GE‐junction, and gastric cancer (4 RCTs) information was provided on toxicity according to WHO or NCI‐CTC guidelines. For at least 769 participants with esophageal and GE‐junction cancer from these trials toxicity was reported. | ⊕⊝⊝⊝ | 1/4 studies reported toxicity for the esophageal and GE‐junction cancer subgroup separately, for both arms, and with validated methods. |
| Quality of life | On average, the quality of life reported improved in the arms with the additional agent. | For 450 participants with esophageal and GE‐junction cancer, quality of life was reported. | ⊕⊝⊝⊝ | 4/5 studies reported on quality of life. 1/4 studies reported quality of life separately for the esophageal and GE‐junction cancer subgroup. |
| CI: confidence interval; GE: gastroesophageal; HR: hazard ratio; NCI‐CTC: National Cancer Institute Common Toxicity Criteria; OS: overall survival; RCT: randomized controlled trial; WHO: World Health Organization. | ||||
| GRADE Working Group grades of evidence | ||||
| aDowngraded by one level due to small sample size. | ||||
| Subcomparison 4: targeted therapy agent plus control intervention versus control intervention alone for palliative treatment of esophageal and GE‐junction carcinoma | |||||
| Patient or population: palliative participants with esophageal and GE‐junction carcinoma Setting: hospital Intervention: targeted therapy agent plus control arm Comparison: control arm | |||||
| Outcome | Comparison | Relative effect | No. of participants | Quality of the evidence | Comments |
| Overall survival | Subcomparison 4, targeted therapy | HR 0.75 (0.63 to 0.90) Median OS 6.7 months in the targeted therapy agent(s) + control arm versus 5.7 months in the control arm | 989 participants (6 RCTs) | ⊕⊕⊕⊕ | Quality not downgraded. Participant populations and agents used differ between studies. However, there is low imprecision and low inconsistency. Cochrane's Q test for heterogeneity showed low heterogeneity (I2 = 24%, P = 0.25). |
| Subcomparison 4a, EGFR‐targeting agents | HR 0.86 (95% CI 0.73 to 1.01) | 655 participants (3 RCTs) | ⊕⊕⊕⊝ | Cochrane's Q test for heterogeneity showed low heterogeneity (I2 = 0%, P = 0.56). | |
| Subcomparison 4b, cetuximab | HR 0.76 (95% CI 0.55 to 1.04) | 206 participants (2 RCTs) | ⊕⊕⊝⊝ | 95% CI includes benefit and harm. Cochrane's Q test for heterogeneity showed low heterogeneity (I2 = 0%, P = 0.58). | |
| Subcomparison 4c, ramucirumab | HR 0.62 (0.43 to 0.88) | 228 participants (2 RCTs) | ⊕⊕⊕⊝ | Cochrane's Q test for heterogeneity showed low heterogeneity (I2 = 28%, P = 0.24). | |
| Progression‐free survival | Subcomparison 4, targeted therapy | HR 0.64 (0.45 to 0.92) | 883 participants (5 RCTs) | ⊕⊕⊕⊝ | Cochrane's Q test for heterogeneity showed low heterogeneity (I2 = 79%, P < 0.001). |
| Subcomparison 4a, EGFR‐targeting agents | HR 0.85 (0.73 to 1.00) | 655 participants (3 RCTs) | ⊕⊕⊝⊝ | 95% CI includes benefit and lack of effect. Cochrane's Q test for heterogeneity showed low heterogeneity (I2 = 2%, P = 0.36). | |
| Subcomparison 4b, cetuximab | HR 0.90 (0.59 to 1.37) | 206 participants (2 RCTs) | ⊕⊝⊝⊝ | 95% CI includes benefit and harm. Cochrane's Q test for heterogeneity showed a moderate amount of heterogeneity (I2 = 53%, P = 0.14). One of the two studies was not blinded and did not use an independent review board. | |
| Subcomparison 4c, ramucirumab | HR 0.39 (0.28 to 0.54) | 228 participants (2 RCTs) | ⊕⊕⊕⊝ | Cochrane's Q test for heterogeneity showed low heterogeneity (I2 = 0%, P = 0.99). | |
| Toxicity | Subcomparison 4, targeted therapy | Palliative chemotherapy and/or targeted therapy appear to increase the frequency of treatment‐related toxicity of at least grade 3. However, treatment‐related deaths did not occur more frequently. | For 3020 participants with esophageal, GE‐junction, and gastric cancer (6 RCTs) information was provided on toxicity according to WHO or NCI‐CTC guidelines. For at least 990 participants with esophageal and GE‐junction cancer from these trials toxicity was reported. | ⊕⊝⊝⊝ | 2/6 studies reported toxicity for the esophageal and GE‐junction cancer subgroup separately, for both arms and with validated methods. |
| Quality of life | Subcomparison 4, targeted therapy | On average, the quality of life reported improved in the arms with the additional agent. | For 2054 participants with esophageal, GE‐junction, and gastric cancer (4 RCTs) information was provided on quality of life. For at least 784 participants with esophageal and GE‐junction cancer, quality of life was reported. | ⊕⊝⊝⊝ | 4/6 studies reported on quality of life. 1/4 studies reported quality of life separately for the esophageal and GE‐junction cancer subgroup. |
| CI: confidence interval; EGFR: epidermal growth factor receptor; GE: gastroesophageal; HR: hazard ratio; NCI‐CTC: National Cancer Institute Common Toxicity Criteria; OS: overall survival; RCT: randomized controlled trial; WHO: World Health Organization. | |||||
| GRADE Working Group grades of evidence | |||||
| aDowngraded by one level due to small sample size. | |||||
| Subcomparison 5: chemotherapy or targeted therapy agent(s) plus control intervention versus control intervention alone in participants with AC of the esophagus | ||||
| Patient or population: palliative participants with AC of the esophagus Setting: hospital Intervention: chemotherapy or targeted therapy plus BSC Comparison: BSC | ||||
| Outcomes | Relative effect | No. of participants | Quality of the evidence | Comments |
| Overall survival | HR 0.66 (0.54 to 0.81) Median OS 7.1 months in the chemotherapy or targeted therapy arm versus 6.0 months in the BSC arm | 538 (5 RCTs) | ⊕⊕⊕⊕ | Quality not downgraded. Participant populations and agents used differ between studies. However, there is low imprecision and low inconsistency. Cochrane's Q test for heterogeneity showed almost no heterogeneity (I2 = 0%, P = 0.55), indicating that results of the studies were consistent. |
| Progression‐free survival | HR 0.62 (0.38 to 1.00) | 713 (4 RCTs) | ⊕⊝⊝⊝ | 95% CI includes benefit and no effect. Cochrane's Q test for heterogeneity showed considerable heterogeneity (I2 = 84%, P < 0.001). |
| Toxicity | Palliative chemotherapy and/or targeted therapy appear to increase the frequency of treatment‐related toxicity of at least grade 3. However, treatment‐related deaths did not occur more frequently. | For 2676 participants with esophageal, GE‐junction, and gastric cancer (5 RCTs) information was provided on toxicity according to WHO or NCI‐CTC guidelines. For at least 570 participants with esophageal and GE‐junction cancer from these trials, toxicity was reported. | ⊕⊝⊝⊝ | 0/5 studies reported toxicity for the esophageal and GE‐junction cancer subgroup separately, for both arms, and with validated methods. |
| Quality of life | On average, the quality of life reported improved in the arms with the additional agent. | For 1772 participants with esophageal, GE‐junction, and gastric cancer (4 RCTs) information was provided on quality of life. For at least 426 participants with esophageal and GE‐junction cancer, quality of life was reported. | ⊕⊝⊝⊝ | 4/5 studies reported on quality of life. 0/4 studies reported quality of life separately for the esophageal and GE‐junction cancer subgroup. |
| AC: adenocarcinoma; BSC: best supportive care; CI: confidence interval; HR: hazard ratio; NCI‐CTC: National Cancer Institute Common Toxicity Criteria; OS: overall survival; RCT: randomized controlled trial; WHO: World Health Organization. | ||||
| GRADE Working Group grades of evidence | ||||
| a Downgraded three levels due to very serious imprecision (95% CI includes appreciable benefit and no effect) and serious inconsistency. | ||||
| Subcomparison 6: chemotherapy or targeted therapy agent(s) plus control intervention versus control intervention alone in participants with SCC of the esophagus | ||||
| Patient or population: palliative participants with SCC of the esophagus Setting: hospital Intervention: chemotherapy or targeted therapy plus BSC Comparison: BSC | ||||
| Outcomes | Relative effect | No. of participants | Quality of the evidence | Comments |
| Overall survival | HR 0.76 (95% CI 0.65 to 0.90) Median OS 8.0 months in the chemotherapy or targeted therapy arm versus 6.5 months in the BSC arm. | 268 (4 RCTs) | ⊕⊕⊕⊕ | Quality not downgraded. Participant populations and agents used differ between studies. However, there is low imprecision and low inconsistency. Cochrane's Q test for heterogeneity showed almost no heterogeneity (I2 = 0%, P = 0.95), indicating that results of the studies were consistent. |
| Progression‐free survival | HR 0.72 (95% CI 0.55 to 0.96) | 168 (2 RCTs) | ⊕⊝⊝⊝ | Cochrane's Q test for heterogeneity showed significant heterogeneity (I2 = 0%, P = 0.97), indicating that results of the 2 studies were not consistent. One of the 2 studies was not blinded and did not use an independent review board. |
| Toxicity | Palliative chemotherapy and/or targeted therapy appear to increase the frequency of treatment‐related toxicity of at least grade 3. However, treatment‐related deaths did not occur more frequently. | For 150 participants with esophageal and GE‐junction cancer (2 RCTs) information was provided on toxicity according to WHO or NCI‐CTC guidelines. | ⊕⊝⊝⊝ | 2/4 studies reported on toxicities with validated methods. 2/2 studies reporting toxicity for the esophageal and GE‐junction cancer subgroup separately, for both arms, and with validated methods. |
| Quality of life | On average, the quality of life reported improved in the arms with the additional agent. | For 156 participants with esophageal and GE‐junction cancer (1 RCT) information was provided on quality of life. | ⊕⊝⊝⊝ | 1/4 studies reported on quality of life. |
| BSC: best supportive care; CI: confidence interval; GE: gastro‐esophageal; HR: hazard ratio; NCI‐CTC: National Cancer Institute Common Toxicity Criteria; OS: overall survival; RCT: randomized controlled trial; SCC: squamous cell carcinoma; WHO: World Health Organization. | ||||
| GRADE Working Group grades of evidence | ||||
| aDowngraded by two levels due to small sample size, and one level due lack of blinding or use of an independent review board. | ||||
| Outcome or subgroup title | No. of studies | No. of participants | Statistical method | Effect size |
| 1 Overall survival Show forest plot | 11 | 1347 | Hazard Ratio (Random, 95% CI) | 0.75 [0.68, 0.84] |
| 1.1 Subcomparison 3: chemotherapeutic agent(s) plus control intervention versus control intervention alone | 5 | 358 | Hazard Ratio (Random, 95% CI) | 0.73 [0.63, 0.85] |
| 1.2 Subcomparison 4: targeted therapy agent plus control intervention versus control intervention alone | 6 | 989 | Hazard Ratio (Random, 95% CI) | 0.75 [0.63, 0.90] |
| 2 Progression‐free survival Show forest plot | 5 | Hazard Ratio (Random, 95% CI) | Subtotals only | |
| 2.1 Subcomparison 4: targeted therapy agent plus control intervention versus control intervention alone | 5 | 883 | Hazard Ratio (Random, 95% CI) | 0.64 [0.45, 0.92] |
| Outcome or subgroup title | No. of studies | No. of participants | Statistical method | Effect size |
| 1 Overall survival Show forest plot | 8 | 1755 | Hazard Ratio (Random, 95% CI) | 0.94 [0.83, 1.05] |
| Outcome or subgroup title | No. of studies | No. of participants | Statistical method | Effect size |
| 1 Overall survival, GE‐junction cancer outcomes Show forest plot | 5 | 538 | Hazard Ratio (Random, 95% CI) | 0.66 [0.54, 0.81] |
| 2 Overall survival, gastric cancer outcomes Show forest plot | 5 | 2093 | Hazard Ratio (Random, 95% CI) | 0.89 [0.76, 1.04] |
| Outcome or subgroup title | No. of studies | No. of participants | Statistical method | Effect size |
| 1 Overall survival Show forest plot | 5 | 750 | Hazard Ratio (Random, 95% CI) | 0.81 [0.71, 0.92] |
| 2 Progression‐free survival Show forest plot | 2 | 540 | Hazard Ratio (Random, 95% CI) | 0.58 [0.28, 1.18] |
| Outcome or subgroup title | No. of studies | No. of participants | Statistical method | Effect size |
| 1 Overall survival Show forest plot | 4 | 769 | Hazard Ratio (Random, 95% CI) | 0.71 [0.54, 0.94] |
| 2 Progression‐free survival Show forest plot | 3 | 677 | Hazard Ratio (Random, 95% CI) | 0.51 [0.29, 0.90] |
| Outcome or subgroup title | No. of studies | No. of participants | Statistical method | Effect size |
| 1 Overall survival Show forest plot | 3 | 655 | Hazard Ratio (Random, 95% CI) | 0.86 [0.73, 1.01] |
| 2 Progression‐free survival Show forest plot | 3 | 655 | Hazard Ratio (Random, 95% CI) | 0.85 [0.73, 1.00] |
| Outcome or subgroup title | No. of studies | No. of participants | Statistical method | Effect size |
| 1 Overall survival Show forest plot | 2 | 206 | Hazard Ratio (Random, 95% CI) | 0.76 [0.55, 1.04] |
| 2 Progression‐free survival Show forest plot | 2 | 206 | Hazard Ratio (Random, 95% CI) | 0.90 [0.59, 1.37] |
| Outcome or subgroup title | No. of studies | No. of participants | Statistical method | Effect size |
| 1 Overall survival Show forest plot | 2 | 228 | Hazard Ratio (Random, 95% CI) | 0.62 [0.43, 0.88] |
| 2 Progression‐free survival Show forest plot | 2 | 228 | Hazard Ratio (Random, 95% CI) | 0.39 [0.28, 0.54] |
| Outcome or subgroup title | No. of studies | No. of participants | Statistical method | Effect size |
| 1 Overall survival Show forest plot | 5 | 538 | Hazard Ratio (Random, 95% CI) | 0.66 [0.54, 0.81] |
| 2 Progression‐free survival Show forest plot | 4 | 713 | Hazard Ratio (Random, 95% CI) | 0.62 [0.38, 1.00] |
| Outcome or subgroup title | No. of studies | No. of participants | Statistical method | Effect size |
| 1 Overall survival Show forest plot | 4 | 268 | Hazard Ratio (Random, 95% CI) | 0.76 [0.65, 0.90] |
| 2 Progression‐free survival Show forest plot | 2 | 168 | Hazard Ratio (Random, 95% CI) | 0.72 [0.55, 0.96] |