Akupunktur untuk kemurungan
Appendices
Appendix 1. Update search CCMD‐CTR ‐ June 2016
The CCMD‐CTR was searches (to 17 June 2016) using the following terms:
((acupunct* or acupress* or acupoints* or electroacupunct* or electro‐acupunct* or auriculotherap* or auriculoacupunct* or moxibust*) and (depress* or "affective disorder*" or "affective symptoms" or mood)):ti,ab,kw,ky,emt,mh,mc
An additional search of PubMed was also conducted at this time and new studies incorporated into the CCMD‐CTR.
#1 “Acupuncture”[MeSH] OR “Acupuncture Therapy”[MeSH]
#2 (acupunct*[tw] or acupress*[tw] or acupoint*[tw] or electroacupunct*[tw] or electro‐acupunct*[tw] or auriculotherap*[tw] or auriculoacupunct*[tw] or moxibust*[tw])
#3 depress*[ti]
#4 ("Depression"[Majr] OR "Depressive Disorder"[Majr:NoExp]) OR "Depressive Disorder, Major"[Majr])
#5 “Randomized Controlled Trials as Topic”[MeSH]
#6 “Randomized Controlled Trial”[pt]
#7 (randomized[tiab] OR randomised[tiab])
#8 (RCT[tiab] OR (random*[tiab] AND allocat*[tiab]) OR (random*[tiab] AND assign*[tiab]))
#9 trial[ti]
#10 placebo*[tiab] OR sham[tiab]
#11 (#1 OR #2) AND (#3 OR #4) AND (#5 OR #6 OR #7 OR #8 OR #9 OR #10)
Appendix 2. Appendix 1 Risk of bias
Criteria for judging risk of bias in the Risk of bias assessment tool.
SEQUENCE GENERATION
Was the allocation sequence adequately generated?
Criteria for a judgement of ‘YES’ (i.e. low risk of bias)
The investigators describe a random component in the sequence generation process such as:
-
referring to a random number table;
-
using a computer random number generator;
-
coin tossing;
-
shuffling cards or envelopes;
-
throwing dice; and
-
drawing lots.
*Minimisation may be implemented without a random element, and this is considered equivalent to being random.
Criteria for a judgement of ‘NO’ (i.e. high risk of bias)
Investigators describe a non‐random component in the sequence generation process. Usually, the description would involve some systematic, non‐random approach, for example, sequence generated by odd or even date of birth; sequence generated by some rule based on date (or day) of admission; or sequence generated by some rule based on hospital or clinic record number. Other non‐random approaches happen much less frequently than the systematic approaches mentioned above and tend to be obvious. They usually involve judgement or some method of non‐random categorisation of participants, for example:
-
allocation by judgement of the clinician;
-
allocation by preference of the participant;
-
allocation based on the results of a laboratory or a series of tests; and
-
allocation by availability of the intervention.
Criteria for a judgement of 'UNCLEAR' (uncertain risk of bias)
Insufficient information about the sequence generation process to permit a judgement of 'Yes' or 'No'
ALLOCATION CONCEALMENT
Was allocation adequately concealed? (short form: allocation concealment?)
Criteria for a judgement of ‘YES’ (i.e. low risk of bias)
Participants and investigators enrolling participants could not foresee assignment because one of the following, or an equivalent method, was used to conceal allocation.
-
Central allocation (including telephone, Web‐based, and pharmacy‐controlled randomisation.
-
Sequentially numbered drug containers of identical appearance.
-
Sequentially numbered, opaque, sealed envelopes.
Criteria for a judgement of ‘NO’ (i.e. high risk of bias)
Participants or investigators enrolling participants could possibly foresee assignments and thus introduce selection bias, such as allocation based on:
-
using an open random allocation schedule (e.g. a list of random numbers);
-
using assignment envelopes without appropriate safeguards (e.g. if envelopes were unsealed or non‐opaque or were not sequentially numbered);
-
alternation or rotation;
-
date of birth;
-
case record number; or
-
any other explicitly unconcealed procedure.
Criteria for a judgement of 'UNCLEAR' (uncertain risk of bias)
Insufficient information about the sequence generation process to permit judgement of 'Yes' or 'No'. This is usually the case if the method of concealment is not described or is not described in sufficient detail to allow a definitive judgement, for example, if use of assignment envelopes is described but it remains unclear whether envelopes were sequentially numbered, opaque, and sealed.
BLINDING OF PARTICIPANTS, PERSONNEL, AND OUTCOME ASSESSORS
Was knowledge of allocated interventions adequately prevented during the study? (short form: blinding)
Criteria for a judgement of ‘YES’ (i.e. low risk of bias)
Any one of the following.
-
No blinding, but review authors judge that the outcome and the outcome measurement are not likely to be influenced by lack of blinding.
-
Blinding of participants and key study personnel ensured, and unlikely that the blinding could have been broken.
-
Either participants or key study personnel were not blinded, but outcome assessment was blinded and non‐blinding of others was unlikely to introduce bias.
Criteria for a judgement of ‘NO’ (i.e. high risk of bias)
Any one of the following.
-
No blinding or incomplete blinding, and the outcome or outcome measurement is likely to be influenced by lack of blinding.
-
Blinding of key study participants and personnel attempted, but likely that blinding could have been broken.
-
Either participants or some key study personnel were not blinded, and non‐blinding or others was likely to introduce bias.
Criteria for a judgment of 'UNCLEAR' (uncertain risk of bias)
Any one of the following.
-
Insufficient information to permit a judgement of 'Yes' or 'No'.
-
The study did not address this outcome.
INCOMPLETE OUTCOME DATA
Were incomplete outcome data adequately addressed? (short form: Incomplete outcome data addressed?)
Criteria for a judgement of ‘YES’ (i.e. low risk of bias)
Any one of the following.
-
No missing data.
-
Reasons for missing outcome data unlikely to be related to true outcomes (for survival data, censoring unlikely to introduce bias).
-
Missing outcome data balanced in numbers across intervention groups, and similar reasons for missing data were provided across groups.
-
For dichotomous outcome data, the proportion of missing outcomes compared with observed event risk was not enough to have a clinically relevant impact on the intervention effect estimate.
-
For continuous outcome data, the plausible effect size (difference in means or standardised difference in means) among missing outcomes was not enough to have a clinically relevant impact on observed effect size.
-
Missing data have been imputed by appropriate methods.
Criteria for a judgment of ‘NO’ (i.e. high risk of bias)
Any one of the following.
-
Reasons for missing outcome data likely to be related to true outcomes, with imbalance in numbers or reasons for missing data across intervention groups.
-
For dichotomous outcome data, the proportion of missing outcomes compared with observed event risk enough to induce clinically relevant bias in the intervention effect estimate.
-
For continuous outcome data, the plausible effect size (difference in means or standardised difference in means) among missing outcomes enough to have a clinically relevant impact on observed effect size.
-
'As treated' analysis done with substantial departure of the intervention received from that assigned at randomisation.
-
Potentially inappropriate application of simple imputation.
Criteria for a judgement of 'UNCLEAR' (uncertain risk of bias)
Any one of the following.
-
Insufficient reporting of attrition/exclusions to permit judgement of 'Yes' or 'No' (e.g. number randomised not stated, no reasons for missing data provided).
-
The study did not address this outcome.
SELECTIVE OUTCOME REPORTING
Are reports of the study free of the suggestion of selective outcome reporting? (short form: free of selective reporting?)
Criteria for a judgement of ‘YES’ (i.e. low risk of bias)
Any one of the following.
-
The study protocol is available and all of the study's prespecified (primary and secondary) outcomes that are of interest in the review have been reported in the prespecified way.
-
The study protocol is not available but it is clear that published reports include all expected outcomes, including those that were prespecified (convincing test of this nature may be uncommon).
Criteria for a judgement of ‘NO’ (i.e. high risk of bias)
Any one of the following.
-
Not all of the study's prespecified primary outcomes have been reported.
-
One or more primary outcomes are reported via measurements, analysis methods, or subsets of data (subscales) that were not prespecified.
-
One or more reported primary outcomes were not prespecified (unless clear justification for their reporting is provided, such as an unexpected adverse effect).
-
One or more outcomes of interest in the review are reported incompletely so that they cannot be entered into a meta‐analysis.
-
The study report fails to include results for a key outcome that would be expected to have been reported for such a study.
Criteria for a judgement of 'UNCLEAR' (uncertain risk of bias)
Insufficient information to permit a judgement of 'Yes' or 'No'. It is likely that most studies will fall into this category.
OTHER POTENTIAL THREATS TO VALIDITY
Was the study apparently free of other problems that could put it at risk of bias? (short form: free of other bias?)
Criteria for a judgement of ‘YES’ (i.e. low risk of bias)
The study appears free of other sources of bias.
Criteria for a judgement of ‘NO’ (i.e. high risk of bias)
At least one important risk of bias is present. For example, the study:
-
had a potential source of bias related to the specific design used;
-
was stopped early owing to some data‐dependent process (including a formal‐stopping rule);
-
had extreme baseline imbalance;
-
has been claimed to have been fraudulent; or
-
had some other problem.
Criteria for a judgement of 'UNCLEAR' (uncertain risk of bias)
Risk of bias may be present, but either:
-
information is iinsuffiecient for assessment of whether an important risk of bias exists; or
-
rationale or evidence is insufficient to suggest that an identified problem will introduce bias.
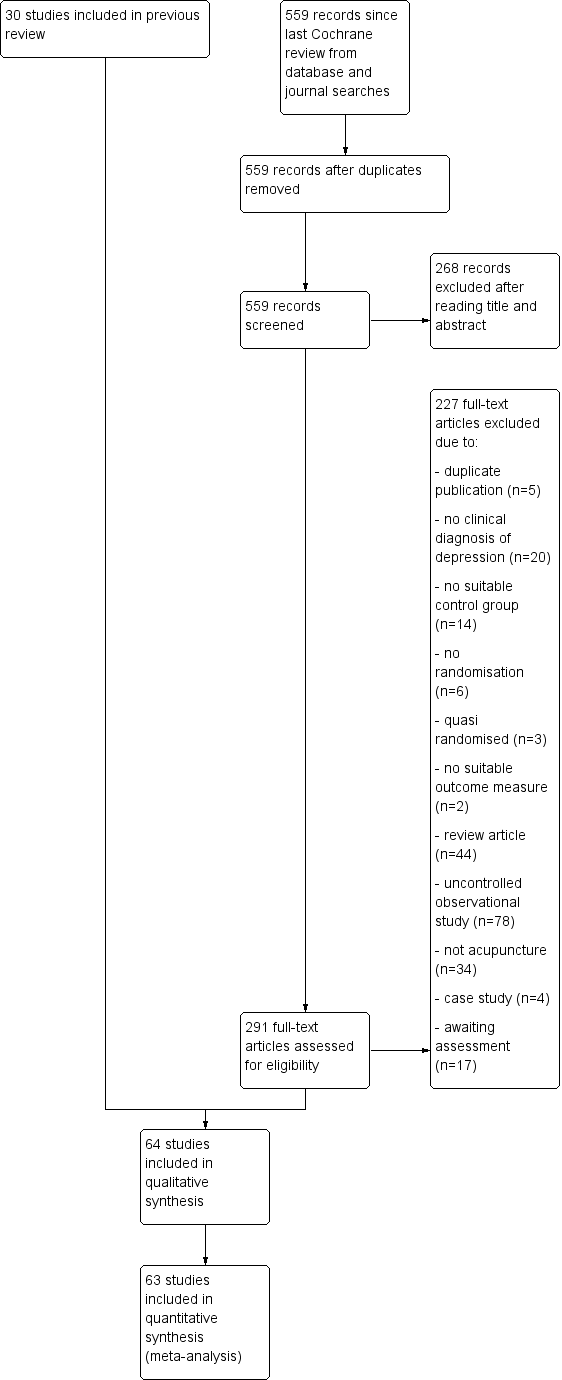
Study flow diagram.

Methodological quality graph: review authors' judgements about each methodological quality item presented as percentages across all included studies.
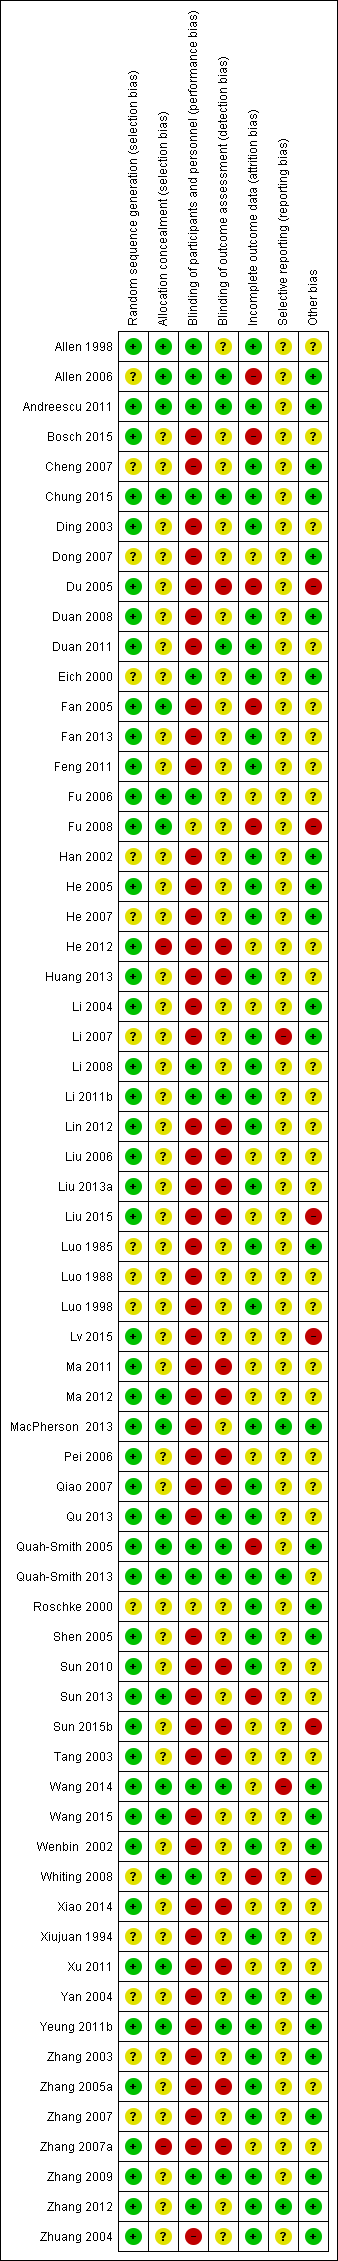
Review authors' judgements about each 'risk of bias' domain for each included study.

Forest plot of comparison: 1 Acupuncture versus no treatment/wait list/TAU, outcome: 1.1 Severity of depression at the end of treatment.

Forest plot of comparison: 2 Acupuncture versus control acupuncture, outcome: 2.1 Severity of depression at the end of the intervention.

Forest plot of comparison: 3 Acupuncture versus medication, outcome: 3.1 Severity of depression at the end of treatment.

Forest plot of comparison: 4 Acupuncture plus medication vs medication, outcome: 4.1 Severity of depression at the end of treatment.
Funnel plot of comparison: 2 Acupuncture versus control acupuncture, outcome: 2.1 Severity of depression at the end of the intervention.

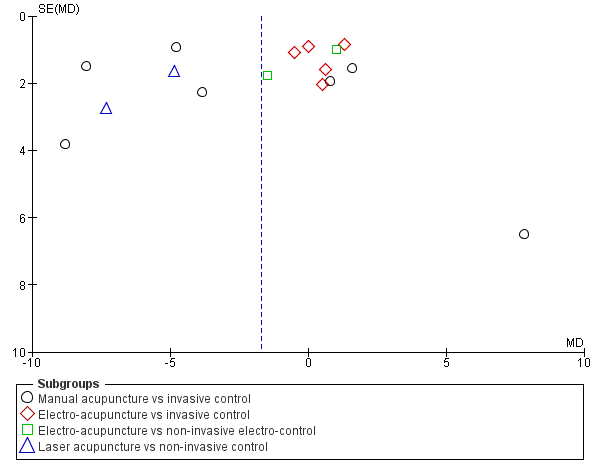
Funnel plot of comparison: 3 Acupuncture versus medication, outcome: 3.1 Severity of depression at the end of treatment.
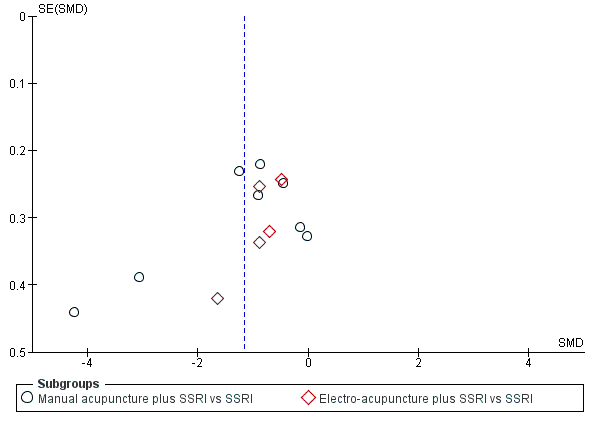
Funnel plot of comparison: 4 Acupuncture plus medication vs medication, outcome: 4.1 Severity of depression at the end of treatment.

Comparison 1 Acupuncture versus no treatment/wait list/TAU, Outcome 1 Severity of depression at the end of treatment.

Comparison 1 Acupuncture versus no treatment/wait list/TAU, Outcome 2 Adverse events.
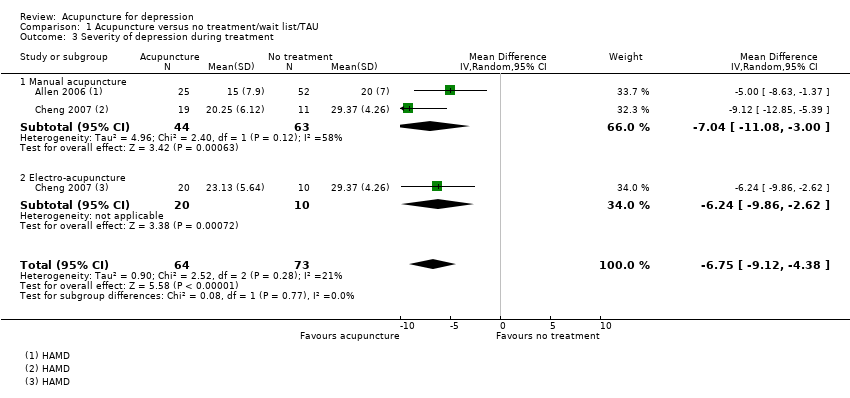
Comparison 1 Acupuncture versus no treatment/wait list/TAU, Outcome 3 Severity of depression during treatment.

Comparison 1 Acupuncture versus no treatment/wait list/TAU, Outcome 4 Severity of depression 0‐6 months after treatment.
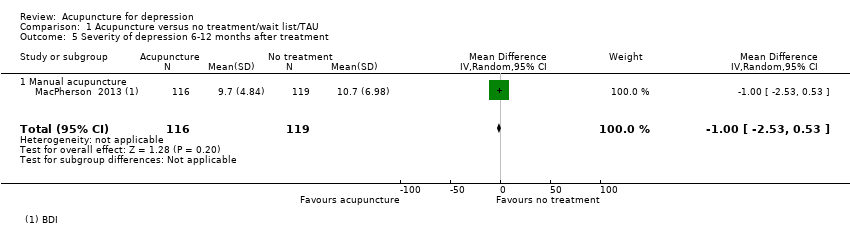
Comparison 1 Acupuncture versus no treatment/wait list/TAU, Outcome 5 Severity of depression 6‐12 months after treatment.
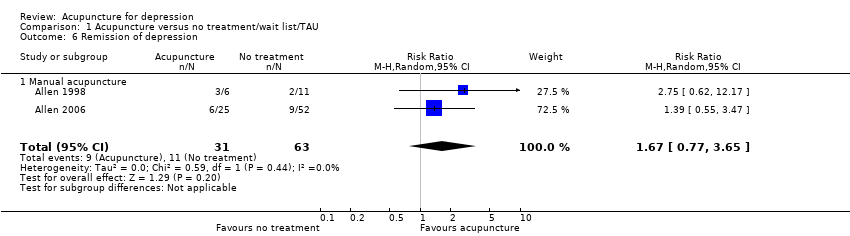
Comparison 1 Acupuncture versus no treatment/wait list/TAU, Outcome 6 Remission of depression.
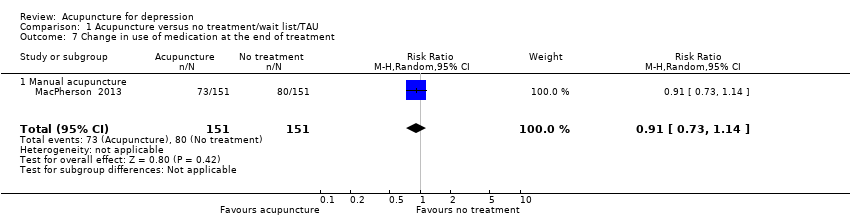
Comparison 1 Acupuncture versus no treatment/wait list/TAU, Outcome 7 Change in use of medication at the end of treatment.

Comparison 1 Acupuncture versus no treatment/wait list/TAU, Outcome 8 Dropout from treatment.

Comparison 2 Acupuncture versus control acupuncture, Outcome 1 Severity of depression at the end of the intervention.

Comparison 2 Acupuncture versus control acupuncture, Outcome 2 Adverse events.
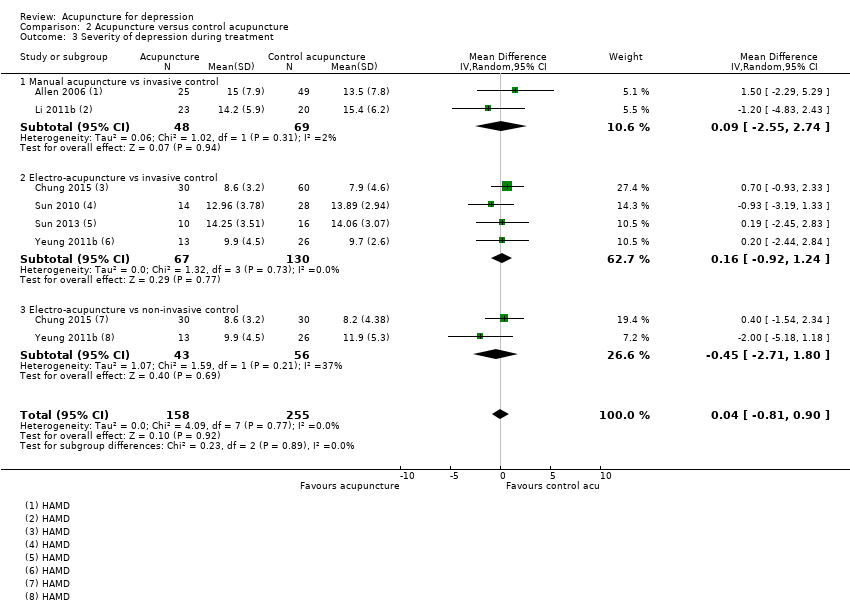
Comparison 2 Acupuncture versus control acupuncture, Outcome 3 Severity of depression during treatment.
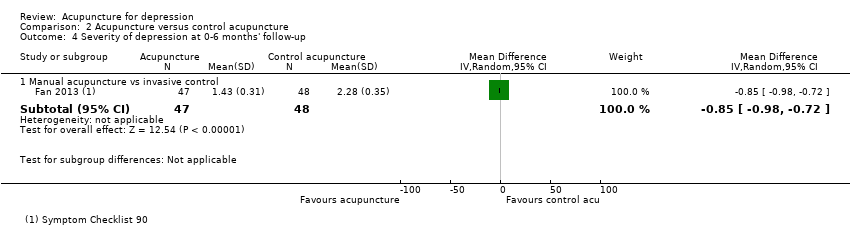
Comparison 2 Acupuncture versus control acupuncture, Outcome 4 Severity of depression at 0‐6 months' follow‐up.
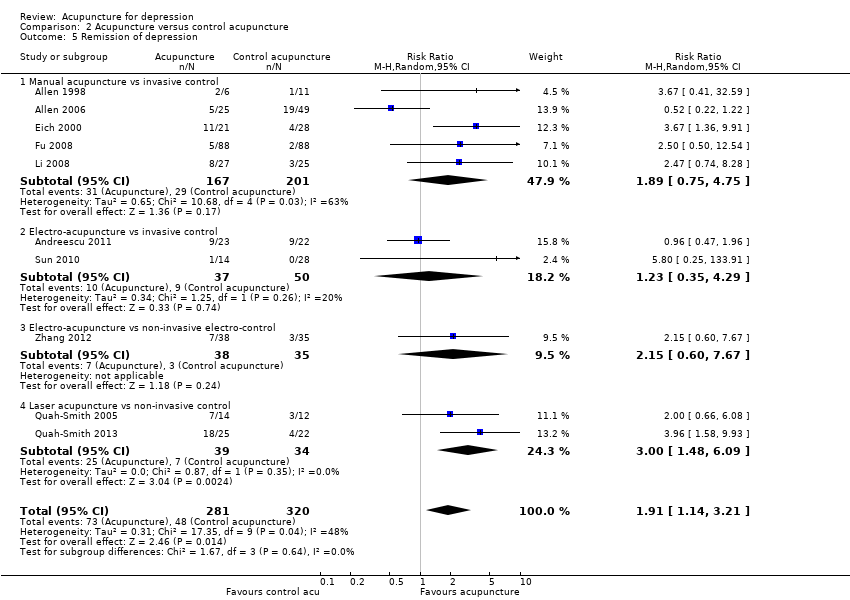
Comparison 2 Acupuncture versus control acupuncture, Outcome 5 Remission of depression.

Comparison 2 Acupuncture versus control acupuncture, Outcome 6 Quality of life (emotional) during treatment.
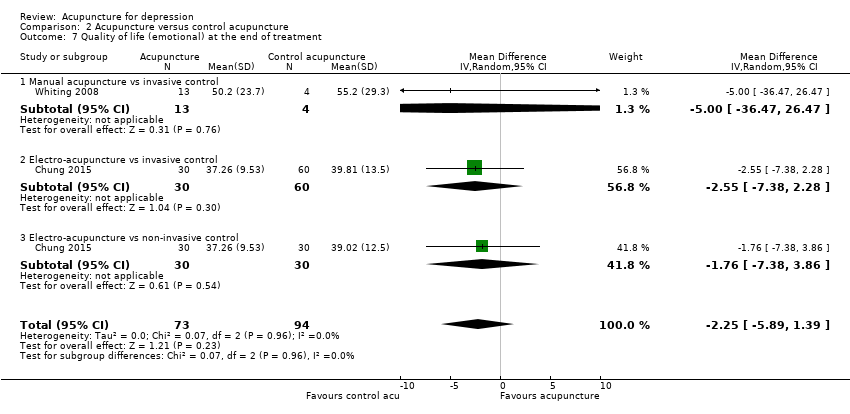
Comparison 2 Acupuncture versus control acupuncture, Outcome 7 Quality of life (emotional) at the end of treatment.

Comparison 2 Acupuncture versus control acupuncture, Outcome 8 Quality of life (physical) during treatment.
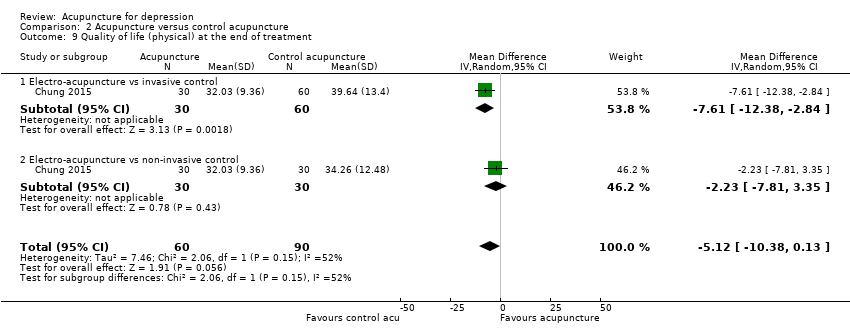
Comparison 2 Acupuncture versus control acupuncture, Outcome 9 Quality of life (physical) at the end of treatment.

Comparison 2 Acupuncture versus control acupuncture, Outcome 10 Change in medication.

Comparison 2 Acupuncture versus control acupuncture, Outcome 11 Dropout from treatment.
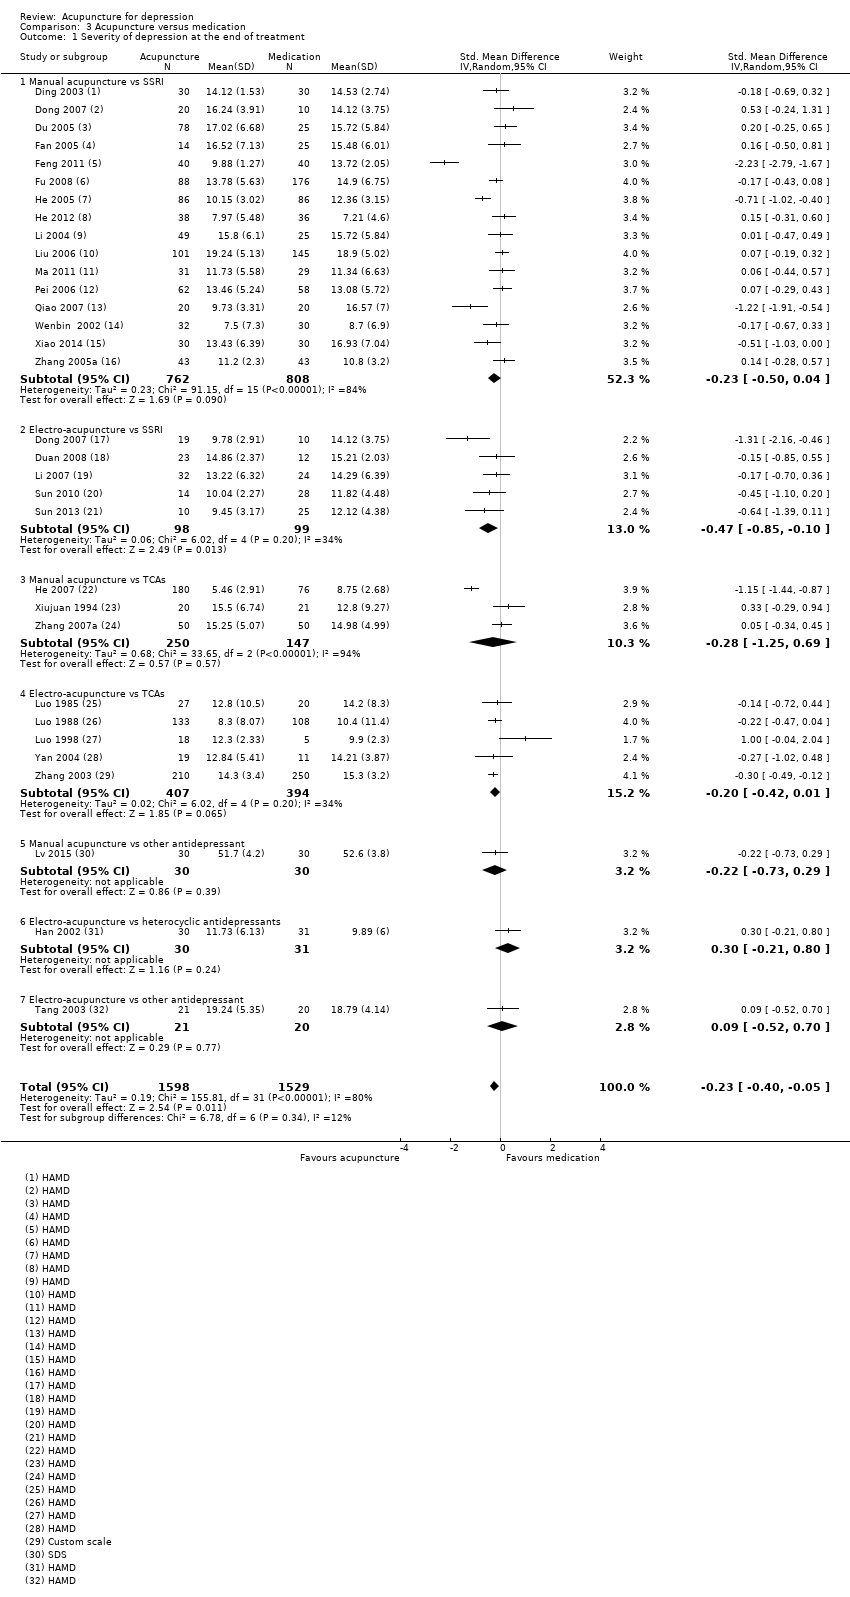
Comparison 3 Acupuncture versus medication, Outcome 1 Severity of depression at the end of treatment.

Comparison 3 Acupuncture versus medication, Outcome 2 Adverse events.

Comparison 3 Acupuncture versus medication, Outcome 3 Severity of depression during treatment.

Comparison 3 Acupuncture versus medication, Outcome 4 Severity of depression 0‐6 months after treatment.

Comparison 3 Acupuncture versus medication, Outcome 5 Remission of depression.
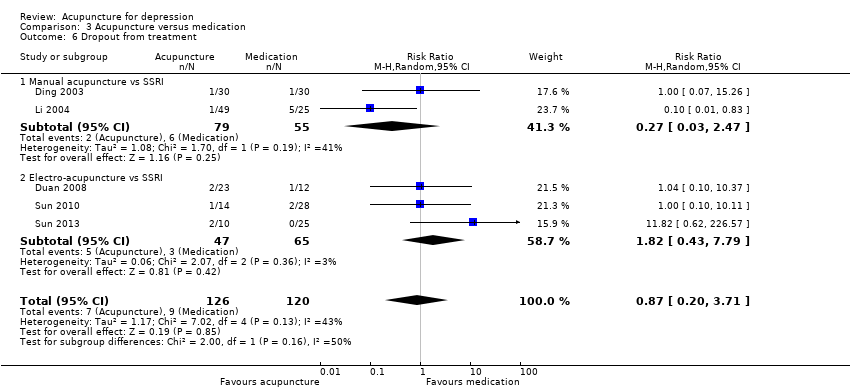
Comparison 3 Acupuncture versus medication, Outcome 6 Dropout from treatment.

Comparison 4 Acupuncture plus medication versus medication, Outcome 1 Severity of depression at the end of treatment.
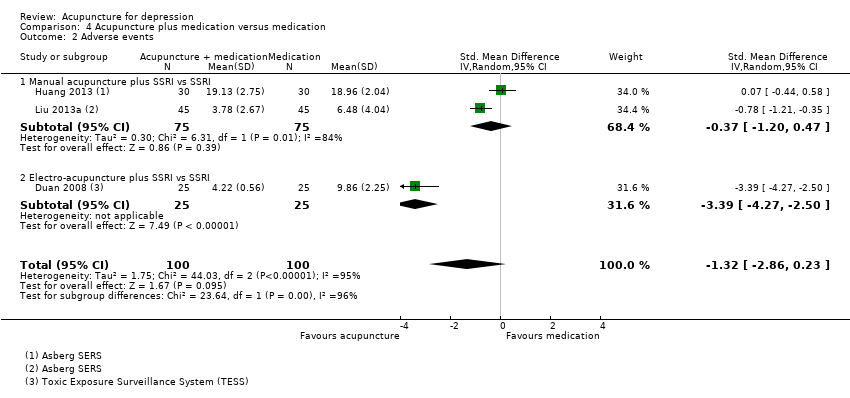
Comparison 4 Acupuncture plus medication versus medication, Outcome 2 Adverse events.
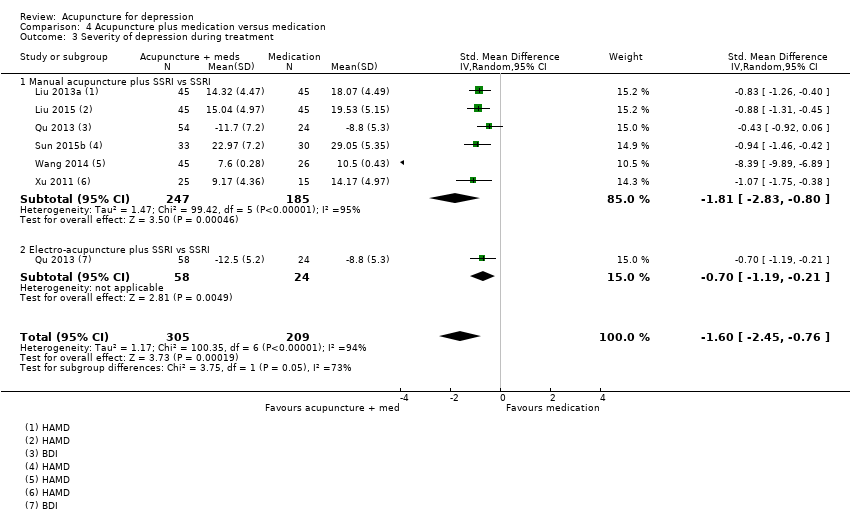
Comparison 4 Acupuncture plus medication versus medication, Outcome 3 Severity of depression during treatment.

Comparison 4 Acupuncture plus medication versus medication, Outcome 4 Remission of depression.
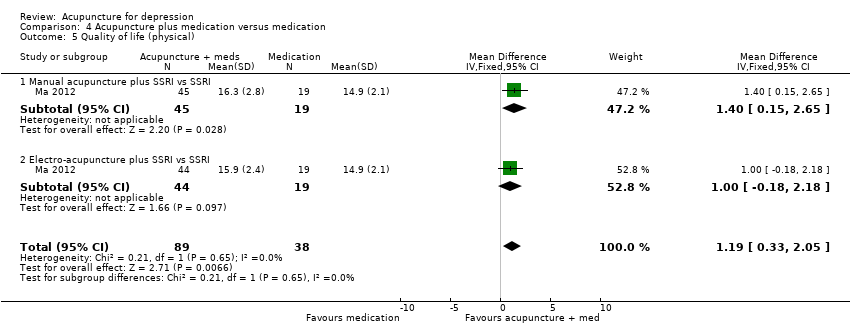
Comparison 4 Acupuncture plus medication versus medication, Outcome 5 Quality of life (physical).

Comparison 4 Acupuncture plus medication versus medication, Outcome 6 Quality of life (emotional).
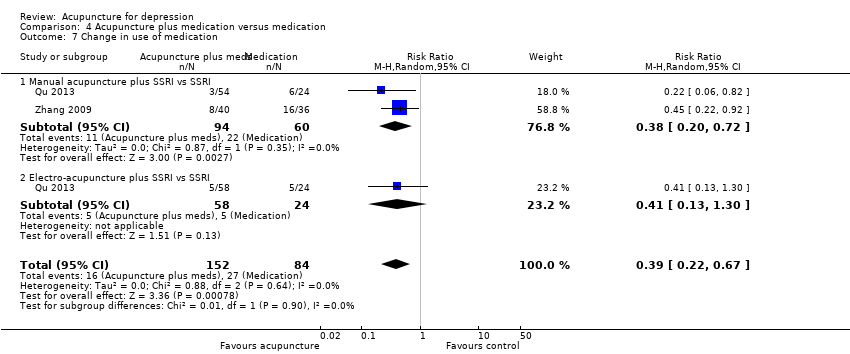
Comparison 4 Acupuncture plus medication versus medication, Outcome 7 Change in use of medication.
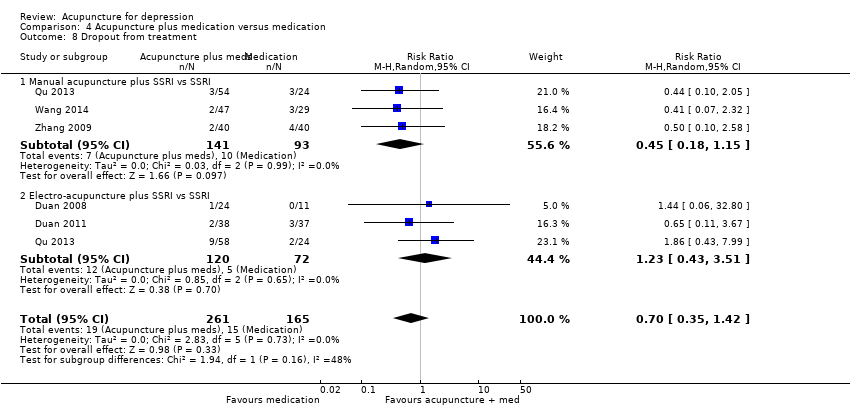
Comparison 4 Acupuncture plus medication versus medication, Outcome 8 Dropout from treatment.

Comparison 5 Acupuncture versus psychological therapy, Outcome 1 Severity of depression at the end of treatment.

Comparison 5 Acupuncture versus psychological therapy, Outcome 2 Adverse events.

Comparison 5 Acupuncture versus psychological therapy, Outcome 3 Severity of depression 0‐6 months after treatment.

Comparison 5 Acupuncture versus psychological therapy, Outcome 4 Severity of depression 6‐12 months.

Comparison 5 Acupuncture versus psychological therapy, Outcome 6 Change in use of medication.

Comparison 5 Acupuncture versus psychological therapy, Outcome 7 Dropout from treatment.
| Acupuncture compared with no treatment/wait list/treatment as usual for depression | ||||||
| Patient or population: clinical diagnosis of depression | ||||||
| Outcomes | Anticipated absolute effects* (95% CI) | Relative effect | No. of participants | Quality of the evidence | Comments | |
| Risk with no treatment/wait list/treatment as usual | Risk with acupuncture | |||||
| Severity of depression at the end of treatment | SMD 0.66 lower | ‐ | 488 | ⊕⊕⊝⊝ | As a rule of thumb, 0.2 SMD represents a small difference, 0.5 moderate, and 0.8 large. | |
| Adverse events | Study population | RR 0.89 | 302 | ⊕⊕⊝⊝ | ||
| 60 per 1000 | 53 per 1000 | |||||
| Quality of life (physical) | ‐ | ‐ | ‐ | ‐ | ‐ | Cannot estimate the effect of acupuncture as no studies reported on this outcome |
| Quality of life (emotional) | ‐ | ‐ | ‐ | ‐ | ‐ | Cannot estimate the effect of acupuncture as no studies reported on this outcome |
| *The risk in the intervention group (and its 95% confidence interval) is based on the assumed risk in the comparison group and the relative effect of the intervention (and its 95% CI). | ||||||
| GRADE Working Group grades of evidence. | ||||||
| aDowngraded one level owing to high risk of performance bias across most included studies. bDowngraded one level owing to substantial heterogeneity (I2 = 64%, Tau2 = 0.14, P = 0.02). cDowngraded one level owing to high risk of performance bias. dDowngraded one level owing to small sample size for detecting relatively rare events. | ||||||
| Acupuncture compared with control acupuncture for depression | ||||||
| Patient or population: clinical diagnosis of depression | ||||||
| Outcomes | Anticipated absolute effects* (95% CI) | Relative effect | No. of participants | Quality of the evidence | Comments | |
| Risk with control acupuncture | Risk with acupuncture | |||||
| Severity of depression at the end of the intervention as measured by the Hamilton Depression Rating Scale (HAMD) scored from 0 to 54 (lower score indicates less severe depression) | In the study population, average severity of depression at the end of treatment was 11.4 in clinician‐rated HAMD scores. | MD 1.69 lower | ‐ | 841 | ⊕⊕⊝⊝ | |
| Adverse events | Study population | RR 1.63 | 300 | ⊕⊕⊕⊝ | ||
| 162 per 1000 | 264 per 1000 | |||||
| Quality of life (physical) at the end of treatment (higher scores indicate greater quality of life) | Mean quality of life (physical) at the end of treatment was 37. | MD 5.12 lower | ‐ | 150 | ⊕⊕⊝⊝ | |
| Quality of life (emotional) at the end of treatment (higher scores indicate greater quality of life) | Mean quality of life (emotional) at the end of treatment was 44.6. | MD 2.25 lower | ‐ | 167 | ⊕⊕⊕⊝ | |
| *The risk in the intervention group (and its 95% confidence interval) is based on the assumed risk in the comparison group and the relative effect of the intervention (and its 95% CI). | ||||||
| GRADE Working Group grades of evidence. | ||||||
| aDowngraded one level owing to high risk of bias in performance bias in five of the included studies and high risk of bias in at least one domain in most studies. bDowngraded one level owing to substantial heterogeneity (I2 = 80%, Tau2 = 7.80, P < 0.001). cDowngraded one level owing to small sample size for relatively rare events. dDowngraded one level because only one small study contributed to this outcome. eDowngraded one level for imprecision due to small sample size. | ||||||
| Acupuncture compared with medication for depression | ||||||
| Patient or population: clinical diagnosis of depression | ||||||
| Outcomes | Anticipated absolute effects* (95% CI) | Relative effect | No. of participants | Quality of the evidence | Comments | |
| Risk with medication | Risk with acupuncture | |||||
| Severity of depression at the end of treatment | SMD 0.23 lower | ‐ | 3127 | ⊕⊝⊝⊝ | As a rule of thumb, 0.2 SMD represents a small difference, 0.5 moderate, and 0.8 large. | |
| Adverse events (measured with Asberg Antidepressant Side Effect Scale) | Mean number of adverse events was 6.2. | MD 4.32 lower | ‐ | 481 | ⊕⊝⊝⊝ | |
| Quality of life (physical) | ‐ | ‐ | No studies reported on this outcome. | ‐ | Cannot estimate the effect of acupuncture as no studies reported on this outcome | |
| Quality of life (emotional) | ‐ | ‐ | No studies reported on this outcome. | ‐ | Cannot estimate the effect of acupuncture as no studies reported on this outcome | |
| *The risk in the intervention group (and its 95% confidence interval) is based on the assumed risk in the comparison group and the relative effect of the intervention (and its 95% CI). | ||||||
| GRADE Working Group grades of evidence. | ||||||
| aDowngraded two levels owing to very serious risk of bias. Of 31 trials, 30 were at high risk of bias owing to lack of blinding of participants, and 12 were at high risk of bias owing to lack of blinding of outcome assessors. bDowngraded one level owing to substantial heterogeneity (I2 = 80%, Tau2 = 0.19, P < 0.0001). cDowngraded two levels owing to very serious risk of bias in all three studies. dDowngraded two levels owing to considerable heterogeneity (I2 = 97%, Tau2 = 7.22, P < 0.001). | ||||||
| Acupuncture plus medication compared with medication for depression | ||||||
| Patient or population: clinical diagnosis of depression | ||||||
| Outcomes | Anticipated absolute effects* (95% CI) | Relative effect | No. of participants | Quality of the evidence | Comments | |
| Risk with medication | Risk with acupuncture plus medication | |||||
| Severity of depression at the end of treatment | SMD 1.15 lower | ‐ | 813 | ⊕⊝⊝⊝ | As a rule of thumb, 0.2 SMD represents a small difference, 0.5 moderate, and 0.8 large. | |
| Adverse events (measured with Asberg Antidepressant Side Effect Scale and Toxic Exposure Surveillance System) | SMD 1.32 lower | ‐ | 200 | ⊕⊝⊝⊝ | As a rule of thumb, 0.2 SMD represents a small difference, 0.5 moderate, and 0.8 large. | |
| Quality of life (physical) at the end of treatment (higher scores indicate greater quality of life) | Quality of life (physical) score in the single included study was 14.9. | MD 1.19 higher | ‐ | 127 | ⊕⊝⊝⊝ | |
| Quality of life (emotional) at the end of treatment (higher scores indicate greater quality of life) | Mean quality of life (emotional) score was 17.2. | MD 0.25 higher | ‐ | 219 | ⊕⊝⊝⊝ | |
| *The risk in the intervention group (and its 95% confidence interval) is based on the assumed risk in the comparison group and the relative effect of the intervention (and its 95% CI). | ||||||
| GRADE Working Group grades of evidence. | ||||||
| aDowngraded two levels owing to very serious risk of bias. Of 11 trials, nine were at high risk of bias owing to lack of blinding of participants, and 6 were at high risk of bias owing to lack of blinding of outcome assessors. bDowngraded two levels owing to considerable heterogeneity (I2 = 89%, Tau2 = 0.70, P < 0.001). fDowngraded two levels owing to very serious risk of bias. | ||||||
| Acupuncture compared with psychological therapy for depression | ||||||
| Patient or population: clinical diagnosis of depression | ||||||
| Outcomes | Anticipated absolute effects* (95% CI) | Relative effect | No. of participants | Quality of the evidence | Comments | |
| Risk with psychological therapy | Risk with acupuncture | |||||
| Severity of depression at the end of treatment as measured by self‐rated depression scores (lower score indicates less severe depression) | SMD 0.5 lower | ‐ | 497 | ⊕⊕⊝⊝ | As a rule of thumb, 0.2 SMD represents a small difference, 0.5 moderate, and 0.8 large. | |
| Adverse events measured during study treatment | Study population | RR 0.62 | 453 | ⊕⊕⊝⊝ | ||
| 86 per 1000 | 53 per 1000 | |||||
| Quality of life (physical) | ‐ | ‐ | ‐ | No studies reported on this outcome. | ‐ | Cannot estimate the effect of acupuncture as no studies reported on this outcome |
| Quality of life (emotional) | ‐ | ‐ | ‐ | No studies reported on this outcome. | ‐ | Cannot estimate the effect of acupuncture as no studies reported on this outcome |
| *The risk in the intervention group (and its 95% confidence interval) is based on the assumed risk in the comparison group and the relative effect of the intervention (and its 95% CI). | ||||||
| GRADE Working Group grades of evidence. | ||||||
| aDowngraded one level for serious risk of bias; both included trials have high risk of performance bias. dDowngraded one level owing to high risk of performance bias. | ||||||
| Outcome or subgroup title | No. of studies | No. of participants | Statistical method | Effect size |
| 1 Severity of depression at the end of treatment Show forest plot | 5 | 488 | Std. Mean Difference (IV, Random, 95% CI) | ‐0.66 [‐1.06, ‐0.25] |
| 1.1 Manual acupuncture | 5 | 458 | Std. Mean Difference (IV, Random, 95% CI) | ‐0.56 [‐0.98, ‐0.15] |
| 1.2 Electro‐acupuncture | 1 | 30 | Std. Mean Difference (IV, Random, 95% CI) | ‐1.26 [‐2.10, ‐0.43] |
| 2 Adverse events Show forest plot | 1 | 302 | Risk Ratio (M‐H, Random, 95% CI) | 0.89 [0.35, 2.24] |
| 2.1 Manual acupuncture | 1 | 302 | Risk Ratio (M‐H, Random, 95% CI) | 0.89 [0.35, 2.24] |
| 3 Severity of depression during treatment Show forest plot | 2 | 137 | Mean Difference (IV, Random, 95% CI) | ‐6.75 [‐9.12, ‐4.38] |
| 3.1 Manual acupuncture | 2 | 107 | Mean Difference (IV, Random, 95% CI) | ‐7.04 [‐11.08, ‐3.00] |
| 3.2 Electro‐acupuncture | 1 | 30 | Mean Difference (IV, Random, 95% CI) | ‐6.24 [‐9.86, ‐2.62] |
| 4 Severity of depression 0‐6 months after treatment Show forest plot | 1 | 237 | Mean Difference (IV, Random, 95% CI) | ‐1.90 [‐3.01, ‐0.79] |
| 4.1 Manual acupuncture | 1 | 237 | Mean Difference (IV, Random, 95% CI) | ‐1.90 [‐3.01, ‐0.79] |
| 5 Severity of depression 6‐12 months after treatment Show forest plot | 1 | 235 | Mean Difference (IV, Random, 95% CI) | ‐1.0 [‐2.53, 0.53] |
| 5.1 Manual acupuncture | 1 | 235 | Mean Difference (IV, Random, 95% CI) | ‐1.0 [‐2.53, 0.53] |
| 6 Remission of depression Show forest plot | 2 | 94 | Risk Ratio (M‐H, Random, 95% CI) | 1.67 [0.77, 3.65] |
| 6.1 Manual acupuncture | 2 | 94 | Risk Ratio (M‐H, Random, 95% CI) | 1.67 [0.77, 3.65] |
| 7 Change in use of medication at the end of treatment Show forest plot | 1 | 302 | Risk Ratio (M‐H, Random, 95% CI) | 0.91 [0.73, 1.14] |
| 7.1 Manual acupuncture | 1 | 302 | Risk Ratio (M‐H, Random, 95% CI) | 0.91 [0.73, 1.14] |
| 8 Dropout from treatment Show forest plot | 1 | 302 | Risk Ratio (M‐H, Random, 95% CI) | 1.0 [0.21, 4.88] |
| 8.1 Manual acupuncture | 1 | 302 | Risk Ratio (M‐H, Random, 95% CI) | 1.0 [0.21, 4.88] |
| Outcome or subgroup title | No. of studies | No. of participants | Statistical method | Effect size |
| 1 Severity of depression at the end of the intervention Show forest plot | 14 | 841 | Mean Difference (IV, Random, 95% CI) | ‐1.69 [‐3.33, ‐0.05] |
| 1.1 Manual acupuncture vs invasive control | 7 | 418 | Mean Difference (IV, Random, 95% CI) | ‐2.97 [‐6.26, 0.31] |
| 1.2 Electro‐acupuncture vs invasive control | 5 | 251 | Mean Difference (IV, Random, 95% CI) | 0.43 [‐0.54, 1.40] |
| 1.3 Electro‐acupuncture vs non‐invasive electro‐control | 2 | 99 | Mean Difference (IV, Random, 95% CI) | 0.17 [‐2.14, 2.48] |
| 1.4 Laser acupuncture vs non‐invasive control | 2 | 73 | Mean Difference (IV, Random, 95% CI) | ‐5.51 [‐8.30, ‐2.73] |
| 2 Adverse events Show forest plot | 5 | 300 | Risk Ratio (M‐H, Random, 95% CI) | 1.63 [0.93, 2.86] |
| 2.1 Manual acupuncture vs invasive control | 1 | 17 | Risk Ratio (M‐H, Random, 95% CI) | 2.5 [0.15, 40.37] |
| 2.2 Electro‐acupuncture vs invasive control | 4 | 244 | Risk Ratio (M‐H, Random, 95% CI) | 1.79 [0.99, 3.25] |
| 2.3 Electro‐acupuncture vs non‐invasive control | 1 | 39 | Risk Ratio (M‐H, Random, 95% CI) | 0.4 [0.05, 3.08] |
| 3 Severity of depression during treatment Show forest plot | 6 | 413 | Mean Difference (IV, Random, 95% CI) | 0.04 [‐0.81, 0.90] |
| 3.1 Manual acupuncture vs invasive control | 2 | 117 | Mean Difference (IV, Random, 95% CI) | 0.09 [‐2.55, 2.74] |
| 3.2 Electro‐acupuncture vs invasive control | 4 | 197 | Mean Difference (IV, Random, 95% CI) | 0.16 [‐0.92, 1.24] |
| 3.3 Electro‐acupuncture vs non‐invasive control | 2 | 99 | Mean Difference (IV, Random, 95% CI) | ‐0.45 [‐2.71, 1.80] |
| 4 Severity of depression at 0‐6 months' follow‐up Show forest plot | 1 | Mean Difference (IV, Random, 95% CI) | Subtotals only | |
| 4.1 Manual acupuncture vs invasive control | 1 | 95 | Mean Difference (IV, Random, 95% CI) | ‐0.85 [‐0.98, ‐0.72] |
| 5 Remission of depression Show forest plot | 10 | 601 | Risk Ratio (M‐H, Random, 95% CI) | 1.91 [1.14, 3.21] |
| 5.1 Manual acupuncture vs invasive control | 5 | 368 | Risk Ratio (M‐H, Random, 95% CI) | 1.89 [0.75, 4.75] |
| 5.2 Electro‐acupuncture vs invasive control | 2 | 87 | Risk Ratio (M‐H, Random, 95% CI) | 1.23 [0.35, 4.29] |
| 5.3 Electro‐acupuncture vs non‐invasive electro‐control | 1 | 73 | Risk Ratio (M‐H, Random, 95% CI) | 2.15 [0.60, 7.67] |
| 5.4 Laser acupuncture vs non‐invasive control | 2 | 73 | Risk Ratio (M‐H, Random, 95% CI) | 3.00 [1.48, 6.09] |
| 6 Quality of life (emotional) during treatment Show forest plot | 1 | 150 | Mean Difference (IV, Random, 95% CI) | ‐1.98 [‐5.41, 1.45] |
| 6.1 Electro‐acupuncture vs invasive control | 1 | 90 | Mean Difference (IV, Random, 95% CI) | ‐2.09 [‐6.54, 2.36] |
| 6.2 Electro‐acupuncture vs non‐invasive control | 1 | 60 | Mean Difference (IV, Random, 95% CI) | ‐1.81 [‐7.18, 3.56] |
| 7 Quality of life (emotional) at the end of treatment Show forest plot | 2 | 167 | Mean Difference (IV, Random, 95% CI) | ‐2.25 [‐5.89, 1.39] |
| 7.1 Manual acupuncture vs invasive control | 1 | 17 | Mean Difference (IV, Random, 95% CI) | ‐5.0 [‐36.47, 26.47] |
| 7.2 Electro‐acupuncture vs invasive control | 1 | 90 | Mean Difference (IV, Random, 95% CI) | ‐2.55 [‐7.38, 2.28] |
| 7.3 Electro‐acupuncture vs non‐invasive control | 1 | 60 | Mean Difference (IV, Random, 95% CI) | ‐1.76 [‐7.38, 3.86] |
| 8 Quality of life (physical) during treatment Show forest plot | 1 | 150 | Mean Difference (IV, Random, 95% CI) | ‐0.99 [‐4.74, 2.77] |
| 8.1 Electro‐acupuncture vs invasive control | 1 | 90 | Mean Difference (IV, Random, 95% CI) | ‐2.62 [‐7.07, 1.83] |
| 8.2 Electro‐acupuncture vs non‐invasive control | 1 | 60 | Mean Difference (IV, Random, 95% CI) | 1.26 [‐4.12, 6.64] |
| 9 Quality of life (physical) at the end of treatment Show forest plot | 1 | 150 | Mean Difference (IV, Random, 95% CI) | ‐5.12 [‐10.38, 0.13] |
| 9.1 Electro‐acupuncture vs invasive control | 1 | 90 | Mean Difference (IV, Random, 95% CI) | ‐7.61 [‐12.38, ‐2.84] |
| 9.2 Electro‐acupuncture vs non‐invasive control | 1 | 60 | Mean Difference (IV, Random, 95% CI) | ‐2.23 [‐7.81, 3.35] |
| 10 Change in medication Show forest plot | 1 | 70 | Mean Difference (IV, Random, 95% CI) | ‐0.39 [‐1.71, 0.93] |
| 10.1 Electro‐acupuncture vs non‐invasive control | 1 | 70 | Mean Difference (IV, Random, 95% CI) | ‐0.39 [‐1.71, 0.93] |
| 11 Dropout from treatment Show forest plot | 7 | 501 | Risk Ratio (M‐H, Random, 95% CI) | 1.04 [0.62, 1.75] |
| 11.1 Manual acupuncture vs invasive control | 1 | 60 | Risk Ratio (M‐H, Random, 95% CI) | 0.6 [0.16, 2.29] |
| 11.2 Electro‐acupuncture vs invasive control | 4 | 224 | Risk Ratio (M‐H, Random, 95% CI) | 1.01 [0.51, 2.02] |
| 11.3 Electro‐acupuncture vs non‐invasive control | 4 | 217 | Risk Ratio (M‐H, Random, 95% CI) | 1.48 [0.56, 3.91] |
| Outcome or subgroup title | No. of studies | No. of participants | Statistical method | Effect size |
| 1 Severity of depression at the end of treatment Show forest plot | 31 | 3127 | Std. Mean Difference (IV, Random, 95% CI) | ‐0.23 [‐0.40, ‐0.05] |
| 1.1 Manual acupuncture vs SSRI | 16 | 1570 | Std. Mean Difference (IV, Random, 95% CI) | ‐0.23 [‐0.50, 0.04] |
| 1.2 Electro‐acupuncture vs SSRI | 5 | 197 | Std. Mean Difference (IV, Random, 95% CI) | ‐0.47 [‐0.85, ‐0.10] |
| 1.3 Manual acupuncture vs TCAs | 3 | 397 | Std. Mean Difference (IV, Random, 95% CI) | ‐0.28 [‐1.25, 0.69] |
| 1.4 Electro‐acupuncture vs TCAs | 5 | 801 | Std. Mean Difference (IV, Random, 95% CI) | ‐0.20 [‐0.42, 0.01] |
| 1.5 Manual acupuncture vs other antidepressant | 1 | 60 | Std. Mean Difference (IV, Random, 95% CI) | ‐0.22 [‐0.73, 0.29] |
| 1.6 Electro‐acupuncture vs heterocyclic antidepressants | 1 | 61 | Std. Mean Difference (IV, Random, 95% CI) | 0.30 [‐0.21, 0.80] |
| 1.7 Electro‐acupuncture vs other antidepressant | 1 | 41 | Std. Mean Difference (IV, Random, 95% CI) | 0.09 [‐0.52, 0.70] |
| 2 Adverse events Show forest plot | 3 | 481 | Mean Difference (IV, Random, 95% CI) | ‐4.32 [‐7.41, ‐1.23] |
| 2.1 Manual acupuncture vs SSRI | 3 | 481 | Mean Difference (IV, Random, 95% CI) | ‐4.32 [‐7.41, ‐1.23] |
| 3 Severity of depression during treatment Show forest plot | 9 | 552 | Mean Difference (IV, Random, 95% CI) | ‐1.67 [‐2.91, ‐0.43] |
| 3.1 Manual acupuncture vs SSRI | 5 | 340 | Mean Difference (IV, Random, 95% CI) | ‐1.38 [‐3.20, 0.45] |
| 3.2 Electro‐acupuncture vs SSRI | 3 | 112 | Mean Difference (IV, Random, 95% CI) | ‐2.58 [‐4.38, ‐0.78] |
| 3.3 Manual acupuncture vs TCAs | 1 | 100 | Mean Difference (IV, Random, 95% CI) | ‐0.80 [‐3.65, 2.05] |
| 4 Severity of depression 0‐6 months after treatment Show forest plot | 1 | 60 | Mean Difference (IV, Random, 95% CI) | ‐5.60 [‐7.60, ‐3.60] |
| 4.1 Manual acupuncture vs other antidepressant medication | 1 | 60 | Mean Difference (IV, Random, 95% CI) | ‐5.60 [‐7.60, ‐3.60] |
| 5 Remission of depression Show forest plot | 25 | 2918 | Risk Ratio (M‐H, Random, 95% CI) | 1.16 [1.05, 1.29] |
| 5.1 Manual acupuncture vs SSRI | 14 | 1332 | Risk Ratio (M‐H, Random, 95% CI) | 1.16 [0.98, 1.37] |
| 5.2 Electro‐acupuncture vs SSRI | 4 | 188 | Risk Ratio (M‐H, Random, 95% CI) | 1.28 [0.94, 1.75] |
| 5.3 Manual acupuncture vs TCAs | 4 | 620 | Risk Ratio (M‐H, Random, 95% CI) | 1.32 [1.03, 1.69] |
| 5.4 Electro‐acupuncture vs TCAs | 4 | 778 | Risk Ratio (M‐H, Random, 95% CI) | 1.03 [0.88, 1.21] |
| 6 Dropout from treatment Show forest plot | 5 | 246 | Risk Ratio (M‐H, Random, 95% CI) | 0.87 [0.20, 3.71] |
| 6.1 Manual acupuncture vs SSRI | 2 | 134 | Risk Ratio (M‐H, Random, 95% CI) | 0.27 [0.03, 2.47] |
| 6.2 Electro‐acupuncture vs SSRI | 3 | 112 | Risk Ratio (M‐H, Random, 95% CI) | 1.82 [0.43, 7.79] |
| Outcome or subgroup title | No. of studies | No. of participants | Statistical method | Effect size |
| 1 Severity of depression at the end of treatment Show forest plot | 11 | 813 | Std. Mean Difference (IV, Random, 95% CI) | ‐1.15 [‐1.63, ‐0.66] |
| 1.1 Manual acupuncture plus SSRI vs SSRI | 8 | 539 | Std. Mean Difference (IV, Random, 95% CI) | ‐1.32 [‐2.09, ‐0.55] |
| 1.2 Electro‐acupuncture plus SSRI vs SSRI | 5 | 274 | Std. Mean Difference (IV, Random, 95% CI) | ‐0.84 [‐1.16, ‐0.51] |
| 2 Adverse events Show forest plot | 3 | 200 | Std. Mean Difference (IV, Random, 95% CI) | ‐1.32 [‐2.86, 0.23] |
| 2.1 Manual acupuncture plus SSRI vs SSRI | 2 | 150 | Std. Mean Difference (IV, Random, 95% CI) | ‐0.37 [‐1.20, 0.47] |
| 2.2 Electro‐acupuncture plus SSRI vs SSRI | 1 | 50 | Std. Mean Difference (IV, Random, 95% CI) | ‐3.39 [‐4.27, ‐2.50] |
| 3 Severity of depression during treatment Show forest plot | 6 | 514 | Std. Mean Difference (IV, Random, 95% CI) | ‐1.60 [‐2.45, ‐0.76] |
| 3.1 Manual acupuncture plus SSRI vs SSRI | 6 | 432 | Std. Mean Difference (IV, Random, 95% CI) | ‐1.81 [‐2.83, ‐0.80] |
| 3.2 Electro‐acupuncture plus SSRI vs SSRI | 1 | 82 | Std. Mean Difference (IV, Random, 95% CI) | ‐0.70 [‐1.19, ‐0.21] |
| 4 Remission of depression Show forest plot | 9 | 618 | Risk Ratio (M‐H, Random, 95% CI) | 1.21 [0.85, 1.73] |
| 4.1 Manual acupuncture plus SSRI vs SSRI | 5 | 299 | Risk Ratio (M‐H, Random, 95% CI) | 1.33 [0.65, 2.73] |
| 4.2 Electro‐acupuncture plus SSRI vs SSRI | 5 | 273 | Risk Ratio (M‐H, Random, 95% CI) | 1.17 [0.75, 1.80] |
| 4.3 Manual acupuncture plus heterocyclic antidepressant vs medication alone | 1 | 46 | Risk Ratio (M‐H, Random, 95% CI) | 4.36 [0.53, 36.12] |
| 5 Quality of life (physical) Show forest plot | 1 | 127 | Mean Difference (IV, Fixed, 95% CI) | 1.19 [0.33, 2.05] |
| 5.1 Manual acupuncture plus SSRI vs SSRI | 1 | 64 | Mean Difference (IV, Fixed, 95% CI) | 1.40 [0.15, 2.65] |
| 5.2 Electro‐acupuncture plus SSRI vs SSRI | 1 | 63 | Mean Difference (IV, Fixed, 95% CI) | 1.0 [‐0.18, 2.18] |
| 6 Quality of life (emotional) Show forest plot | 2 | 219 | Mean Difference (IV, Random, 95% CI) | 0.25 [‐0.90, 1.40] |
| 6.1 Manual acupuncture plus SSRI vs SSRI | 2 | 111 | Mean Difference (IV, Random, 95% CI) | 0.10 [‐1.46, 1.65] |
| 6.2 Electro‐acupuncture plus SSRI vs SSRI | 2 | 108 | Mean Difference (IV, Random, 95% CI) | 0.35 [‐2.00, 2.70] |
| 7 Change in use of medication Show forest plot | 2 | 236 | Risk Ratio (M‐H, Random, 95% CI) | 0.39 [0.22, 0.67] |
| 7.1 Manual acupuncture plus SSRI vs SSRI | 2 | 154 | Risk Ratio (M‐H, Random, 95% CI) | 0.38 [0.20, 0.72] |
| 7.2 Electro‐acupuncture plus SSRI vs SSRI | 1 | 82 | Risk Ratio (M‐H, Random, 95% CI) | 0.41 [0.13, 1.30] |
| 8 Dropout from treatment Show forest plot | 5 | 426 | Risk Ratio (M‐H, Random, 95% CI) | 0.70 [0.35, 1.42] |
| 8.1 Manual acupuncture plus SSRI vs SSRI | 3 | 234 | Risk Ratio (M‐H, Random, 95% CI) | 0.45 [0.18, 1.15] |
| 8.2 Electro‐acupuncture plus SSRI vs SSRI | 3 | 192 | Risk Ratio (M‐H, Random, 95% CI) | 1.23 [0.43, 3.51] |
| Outcome or subgroup title | No. of studies | No. of participants | Statistical method | Effect size |
| 1 Severity of depression at the end of treatment Show forest plot | 2 | 497 | Std. Mean Difference (IV, Random, 95% CI) | ‐0.50 [‐1.33, 0.33] |
| 1.1 Manual acupuncture | 2 | 497 | Std. Mean Difference (IV, Random, 95% CI) | ‐0.50 [‐1.33, 0.33] |
| 2 Adverse events Show forest plot | 1 | 453 | Risk Ratio (M‐H, Random, 95% CI) | 0.62 [0.29, 1.33] |
| 2.1 Manual acupuncture | 1 | 453 | Risk Ratio (M‐H, Random, 95% CI) | 0.62 [0.29, 1.33] |
| 3 Severity of depression 0‐6 months after treatment Show forest plot | 1 | 453 | Mean Difference (IV, Random, 95% CI) | 0.5 [‐0.51, 1.51] |
| 3.1 Manual acupuncture | 1 | 453 | Mean Difference (IV, Random, 95% CI) | 0.5 [‐0.51, 1.51] |
| 4 Severity of depression 6‐12 months Show forest plot | 1 | 453 | Mean Difference (IV, Random, 95% CI) | 0.60 [‐0.80, 2.00] |
| 4.1 Manual acupuncture | 1 | 453 | Mean Difference (IV, Random, 95% CI) | 0.60 [‐0.80, 2.00] |
| 5 Remission of depression | 0 | Risk Ratio (M‐H, Random, 95% CI) | Subtotals only | |
| 5.1 Manual acupuncture | 0 | 0 | Risk Ratio (M‐H, Random, 95% CI) | 0.0 [0.0, 0.0] |
| 6 Change in use of medication Show forest plot | 1 | 453 | Risk Ratio (M‐H, Random, 95% CI) | 0.82 [0.61, 1.10] |
| 6.1 Manual acupuncture | 1 | 453 | Risk Ratio (M‐H, Random, 95% CI) | 0.82 [0.61, 1.10] |
| 7 Dropout from treatment Show forest plot | 1 | 453 | Risk Ratio (M‐H, Random, 95% CI) | 0.27 [0.08, 0.90] |
| 7.1 Manual acupuncture | 1 | 453 | Risk Ratio (M‐H, Random, 95% CI) | 0.27 [0.08, 0.90] |