| 1 Global state: No clinically important overall improvement (as rated by trialists) Show forest plot | 1 | 72 | Risk Ratio (M‐H, Fixed, 95% CI) | 0.10 [0.03, 0.31] |
|
| 1.1 20 or more sessions | 1 | 72 | Risk Ratio (M‐H, Fixed, 95% CI) | 0.10 [0.03, 0.31] |
| 2 Mental state: General ‐ 1a. Average endpoint score (PANSS, high score = poor) Show forest plot | 1 | 69 | Std. Mean Difference (IV, Fixed, 95% CI) | ‐0.36 [‐0.84, 0.12] |
|
| 2.1 less than 20 sessions | 1 | 69 | Std. Mean Difference (IV, Fixed, 95% CI) | ‐0.36 [‐0.84, 0.12] |
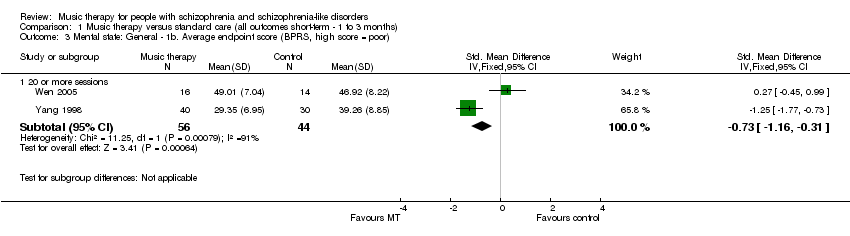
| 3 Mental state: General ‐ 1b. Average endpoint score (BPRS, high score = poor) Show forest plot | 2 | | Std. Mean Difference (IV, Fixed, 95% CI) | Subtotals only |
|
| 3.1 20 or more sessions | 2 | 100 | Std. Mean Difference (IV, Fixed, 95% CI) | ‐0.73 [‐1.16, ‐0.31] |
| 4 Mental state: Specific ‐ 2. Negative symptoms ‐ average endpoint score (SANS, high score = poor) Show forest plot | 4 | 240 | Std. Mean Difference (IV, Fixed, 95% CI) | ‐0.74 [‐1.00, ‐0.47] |
|
| 4.1 less than 20 sessions | 2 | 110 | Std. Mean Difference (IV, Fixed, 95% CI) | ‐0.79 [‐1.19, ‐0.40] |
| 4.2 20 or more sessions | 2 | 130 | Std. Mean Difference (IV, Fixed, 95% CI) | ‐0.69 [‐1.05, ‐0.33] |
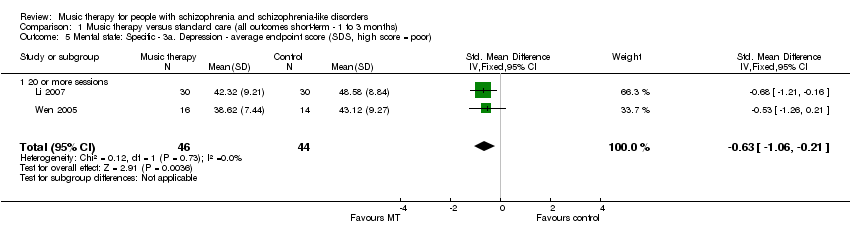
| 5 Mental state: Specific ‐ 3a. Depression ‐ average endpoint score (SDS, high score = poor) Show forest plot | 2 | 90 | Std. Mean Difference (IV, Fixed, 95% CI) | ‐0.63 [‐1.06, ‐0.21] |
|
| 5.1 20 or more sessions | 2 | 90 | Std. Mean Difference (IV, Fixed, 95% CI) | ‐0.63 [‐1.06, ‐0.21] |
| 6 Mental state: Specific ‐ 3b. Depression ‐ average endpoint score (Ham‐D, high score = poor) Show forest plot | 1 | 30 | Std. Mean Difference (IV, Fixed, 95% CI) | ‐0.52 [‐1.25, 0.21] |
|
| 6.1 20 or more sessions | 1 | 30 | Std. Mean Difference (IV, Fixed, 95% CI) | ‐0.52 [‐1.25, 0.21] |
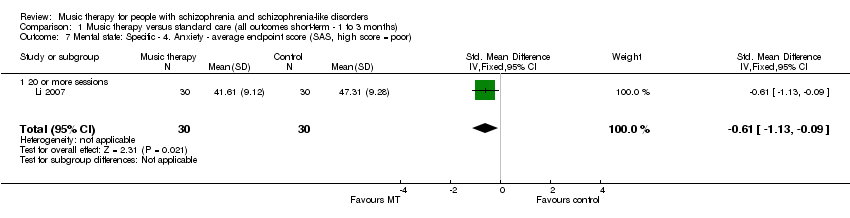
| 7 Mental state: Specific ‐ 4. Anxiety ‐ average endpoint score (SAS, high score = poor) Show forest plot | 1 | 60 | Std. Mean Difference (IV, Fixed, 95% CI) | ‐0.61 [‐1.13, ‐0.09] |
|
| 7.1 20 or more sessions | 1 | 60 | Std. Mean Difference (IV, Fixed, 95% CI) | ‐0.61 [‐1.13, ‐0.09] |
| 8 Leaving the study early Show forest plot | 8 | 493 | Risk Ratio (M‐H, Fixed, 95% CI) | 1.03 [0.38, 2.78] |
|
| 8.1 less than 20 sessions | 4 | 261 | Risk Ratio (M‐H, Fixed, 95% CI) | 1.04 [0.36, 2.99] |
| 8.2 20 or more sessions | 4 | 232 | Risk Ratio (M‐H, Fixed, 95% CI) | 1.0 [0.06, 15.45] |
| 9 General functioning: Average endpoint score (GAF, high score = good) Show forest plot | 1 | 69 | Std. Mean Difference (IV, Fixed, 95% CI) | ‐0.05 [‐0.53, 0.43] |
|
| 9.1 less than 20 sessions | 1 | 69 | Std. Mean Difference (IV, Fixed, 95% CI) | ‐0.05 [‐0.53, 0.43] |
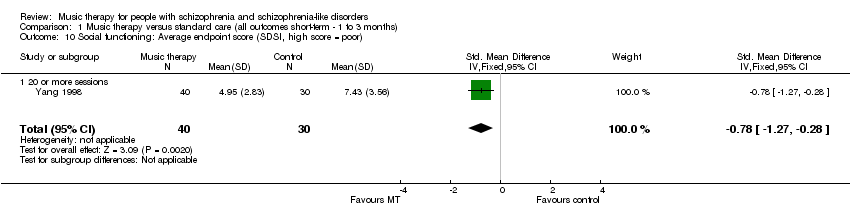
| 10 Social functioning: Average endpoint score (SDSI, high score = poor) Show forest plot | 1 | 70 | Std. Mean Difference (IV, Fixed, 95% CI) | ‐0.78 [‐1.27, ‐0.28] |
|
| 10.1 20 or more sessions | 1 | 70 | Std. Mean Difference (IV, Fixed, 95% CI) | ‐0.78 [‐1.27, ‐0.28] |
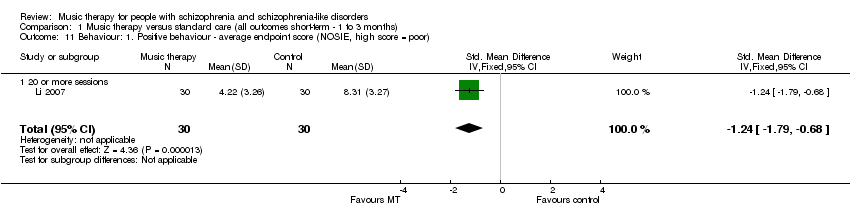
| 11 Behaviour: 1. Positive behaviour ‐ average endpoint score (NOSIE, high score = poor) Show forest plot | 1 | 60 | Std. Mean Difference (IV, Fixed, 95% CI) | ‐1.24 [‐1.79, ‐0.68] |
|
| 11.1 20 or more sessions | 1 | 60 | Std. Mean Difference (IV, Fixed, 95% CI) | ‐1.24 [‐1.79, ‐0.68] |
| 12 Behaviour: 2. Negative behaviour ‐ average endpoint score (NOSIE, high score = poor) Show forest plot | 1 | 60 | Std. Mean Difference (IV, Fixed, 95% CI) | ‐2.22 [‐2.87, ‐1.57] |
|
| 12.1 20 or more sessions | 1 | 60 | Std. Mean Difference (IV, Fixed, 95% CI) | ‐2.22 [‐2.87, ‐1.57] |
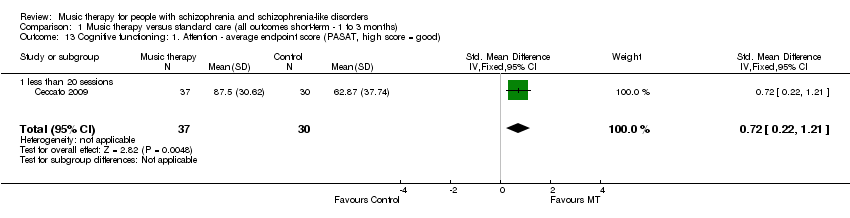
| 13 Cognitive functioning: 1. Attention ‐ average endpoint score (PASAT, high score = good) Show forest plot | 1 | 67 | Std. Mean Difference (IV, Fixed, 95% CI) | 0.72 [0.22, 1.21] |
|
| 13.1 less than 20 sessions | 1 | 67 | Std. Mean Difference (IV, Fixed, 95% CI) | 0.72 [0.22, 1.21] |
| 14 Cognitive functioning: 2. Vigilance and attention ‐ average endpoint score (CCPT, high score = good) Show forest plot | 1 | 67 | Std. Mean Difference (IV, Fixed, 95% CI) | 0.25 [‐0.23, 0.74] |
|
| 14.1 less than 20 sessions | 1 | 67 | Std. Mean Difference (IV, Fixed, 95% CI) | 0.25 [‐0.23, 0.74] |
| 15 Cognitive functioning: 3. Memory ‐ average endpoint score (WMS, high score = good) Show forest plot | 1 | 67 | Std. Mean Difference (IV, Fixed, 95% CI) | 0.43 [‐0.06, 0.92] |
|
| 15.1 less than 20 sessions | 1 | 67 | Std. Mean Difference (IV, Fixed, 95% CI) | 0.43 [‐0.06, 0.92] |
| 16 Cognitive functioning: 4. Abstract thinking ‐ average endpoint score (BCST, high score = good) ) Show forest plot | 1 | 67 | Std. Mean Difference (IV, Fixed, 95% CI) | 0.09 [‐0.39, 0.58] |
|
| 16.1 less than 20 sessions | 1 | 67 | Std. Mean Difference (IV, Fixed, 95% CI) | 0.09 [‐0.39, 0.58] |
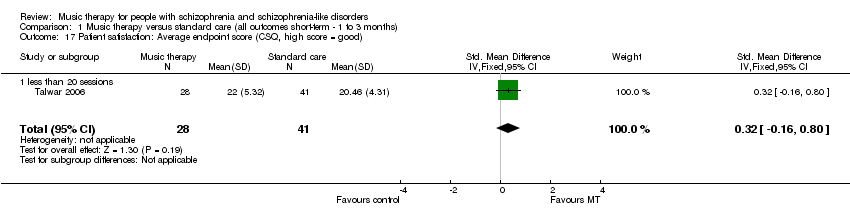
| 17 Patient satisfaction: Average endpoint score (CSQ, high score = good) Show forest plot | 1 | 69 | Std. Mean Difference (IV, Fixed, 95% CI) | 0.32 [‐0.16, 0.80] |
|
| 17.1 less than 20 sessions | 1 | 69 | Std. Mean Difference (IV, Fixed, 95% CI) | 0.32 [‐0.16, 0.80] |
| 18 Quality of life: Average endpoint score (SPG, high score = good) Show forest plot | 1 | 31 | Std. Mean Difference (IV, Fixed, 95% CI) | 0.05 [‐0.66, 0.75] |
|
| 18.1 less than 20 sessions | 1 | 31 | Std. Mean Difference (IV, Fixed, 95% CI) | 0.05 [‐0.66, 0.75] |