Tratamiento antibiótico oral versus intravenoso para la neutropenia febril en pacientes con cáncer
Appendices
Appendix 1. CENTRAL search strategy
#1 MeSH descriptor Neutropenia, this term only
#2 neutrop* or granulo* or leukop*
#3 (#1 OR #2)
#4 MeSH descriptor Fever explode all trees
#5 MeSH descriptor Bacterial Infections explode all trees
#6 MeSH descriptor Sepsis explode all trees
#7 fever* or febrile or infect* or septic or sepsis
#8 (#4 OR #5 OR #6 OR #7)
#9 Any MeSH descriptor with qualifier: DT
#10 MeSH descriptor Anti‐Infective Agents explode all trees
#11 antibiotic* or antimicrob* or anti‐microb* or antibacter* or anti‐bacter* or antiinfect* or anti‐infect*
#12 (#9 OR #10 OR #11)
#13 MeSH descriptor Drug Administration Routesexplode all trees
#14 oral* or per os or intravenous* or IV or parenteral*
#15 (#13 OR #14)
#16 MeSH descriptor Neoplasms explode all trees
#17 cancer* or tumor* or tumour* or neoplas* or malignan* or carcinoma* or lymphoma* or leukemia* or leukaemia* or myeloma*
#18 bone marrow and transplant*
#19 (#16 OR #17 OR #18)
#20 (#3 AND #8 AND #12 AND #15 AND #19)
Appendix 2. MEDLINE search strategy
1 Neutropenia/
2 (neutrop* or granulo* or leukop*).mp.
3 1 or 2
4 exp Fever/
5 exp Bacterial Infections/
6 exp Sepsis/
7 (fever* or febrile or infect* or sepsis or septic).mp.
8 4 or 5 or 6 or 7
9 drug therapy.fs.
10 exp Anti‐Infective Agents/
11 (antibiotic* or antimicrob* or anti‐microb* or antibacter* or anti‐bacter* or antiinfect* or anti‐infect*).mp.
12 9 or 10 or 11
13 exp Drug Administration Routes/
14 (oral* or per os or intravenous* or IV or parenteral*).mp.
15 13 or 14
16 exp Neoplasms/
17 Bone Marrow Transplantation/
18 (cancer* or tumor* or tumour* or neoplas* or malignan* or carcinoma* or lymphoma* or leukemia* or leukaemia* or myeloma*).mp.
19 (bone marrow and transplant*).mp.
20 16 or 17 or 18 or 19
21 3 and 8 and 12 and 15 and 20
22 randomized controlled trial.pt.
23 controlled clinical trial.pt.
24 randomized.ab.
25 placebo.ab.
26 clinical trials as topic.sh.
27 randomly.ab.
28 trial.ti.
29 22 or 23 or 24 or 25 or 26 or 27 or 28
30 21 and 29
key:
mp=protocol supplementary concept, rare disease supplementary concept, title, original title, abstract, name of substance word, subject heading word, unique identifier
pt=publication type
ab=abstract
ti=title
sh=subject heading
Appendix 3. EMBASE search strategy
1 exp neutropenia/
2 (neutrop* or granulo* or leukop*).mp.
3 1 or 2
4 exp fever/
5 exp bacterial infection/
6 exp sepsis/
7 (fever* or febrile or infect* or septic or sepsis).mp.
8 4 or 5 or 6 or 7
9 exp antiinfective agent/
10 (antibiotic* or antimicrob* or anti‐microb* or antibacter* or anti‐bacter* or antiinfect* or anti‐infect*).mp.
11 9 or 10
12 exp drug administration route/
13 (oral* or per os or intravenous* or IV or parenteral*).mp.
14 12 or 13
15 exp neoplasm/
16 exp bone marrow transplantation/
17 (cancer* or tumor* or tumour* or neoplas* or malignan* or carcinoma* or lymphoma* or leukemia* or leukaemia* or myeloma*).mp.
18 (bone marrow and transplant*).mp.
19 15 or 16 or 17 or 18
20 3 and 8 and 11 and 14 and 19
21 crossover procedure/
22 randomized controlled trial/
23 single blind procedure/
24 random*.mp.
25 factorial*.mp.
26 (crossover* or cross over* or cross‐over).mp.
27 placebo*.mp.
28 (doubl* adj blind*).mp.
29 (singl* adj blind*).mp.
30 assign*.mp.
31 allocat*.mp.
32 volunteer*.mp.
33 21 or 22 or 23 or 24 or 25 or 26 or 27 or 28 or 29 or 30 or 31 or 32
34 20 and 33
key:
mp=title, abstract, subject headings, heading word, drug trade name, original title, device manufacturer, drug manufacturer, device trade name, keyword
Appendix 4. LILACS search strategy
((fever*:ME OR febrile OR infection*:ME OR infect* OR sepsis*:ME) AND (neutropenia*:ME OR neutropen* OR neutropaen* OR granolucytopen* OR granolucytopaen* OR leukopen* OR leukopaen*) AND (oral OR per‐os) AND (intravenous OR parenteral) AND ((antibiotics*:ME OR antibiot* OR antimicrob* OR anti‐microb* OR antibact* OR anti infective agents*:ME) NOT decontamination*:ME))

Risk of bias graph: review authors' judgements about each risk of bias item presented as percentages across all included studies.
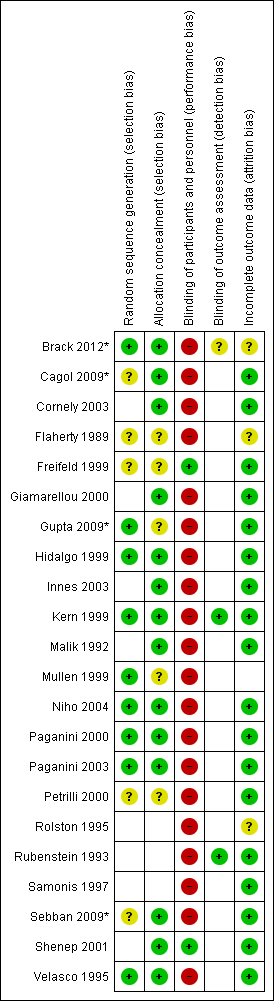
Risk of bias summary: review authors' judgements about each risk of bias item for each included study.

Funnel plot of comparison: 1 Oral versus intravenous antibiotic therapy, outcome: 1.1 Mortality.
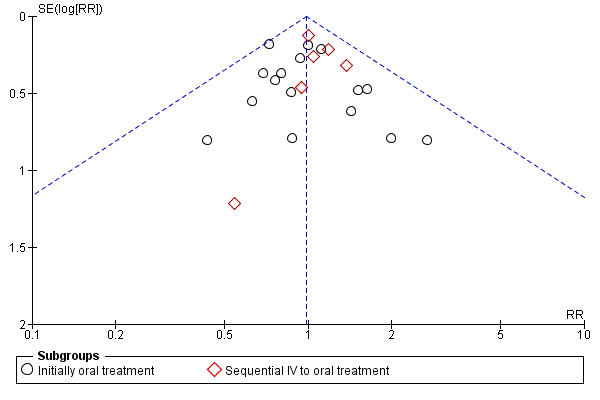
Funnel plot of comparison: 1 Oral versus intravenous antibiotic therapy, outcome: 1.3 Treatment failure ‐ per protocol analysis.
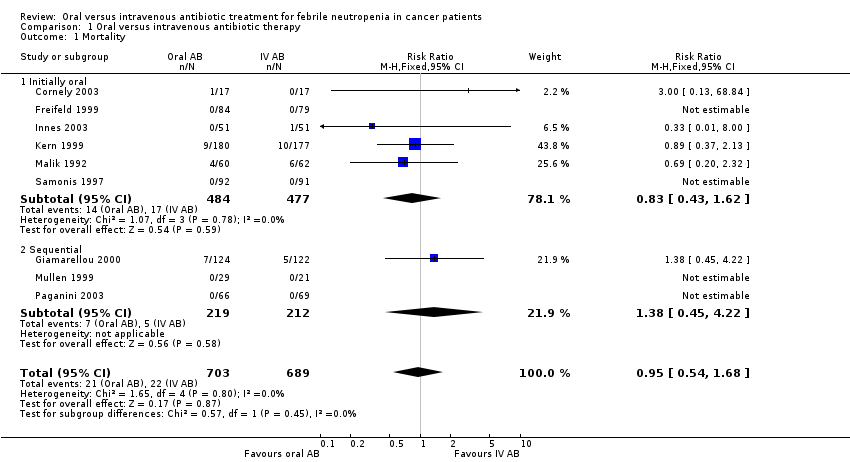
Comparison 1 Oral versus intravenous antibiotic therapy, Outcome 1 Mortality.
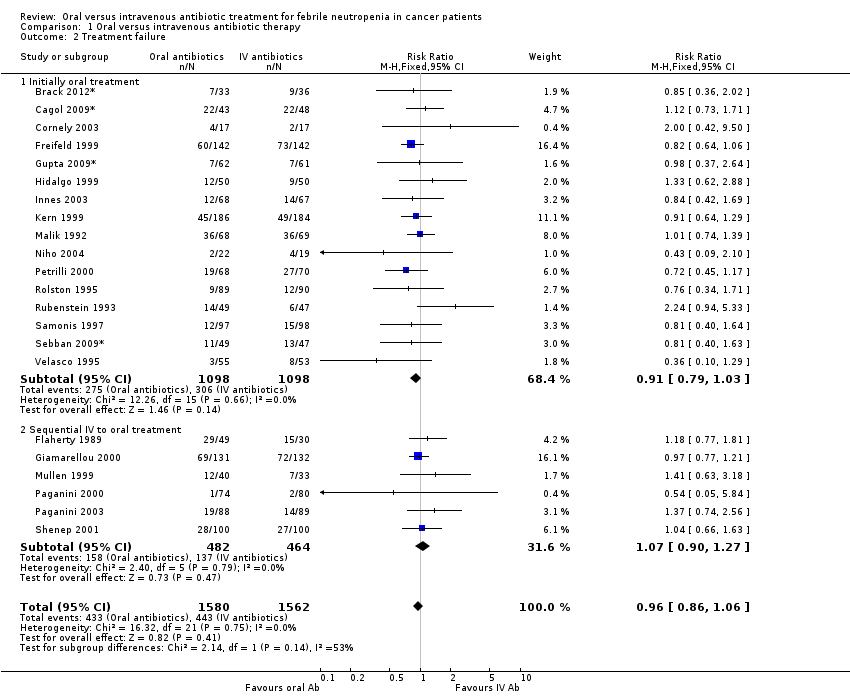
Comparison 1 Oral versus intravenous antibiotic therapy, Outcome 2 Treatment failure.
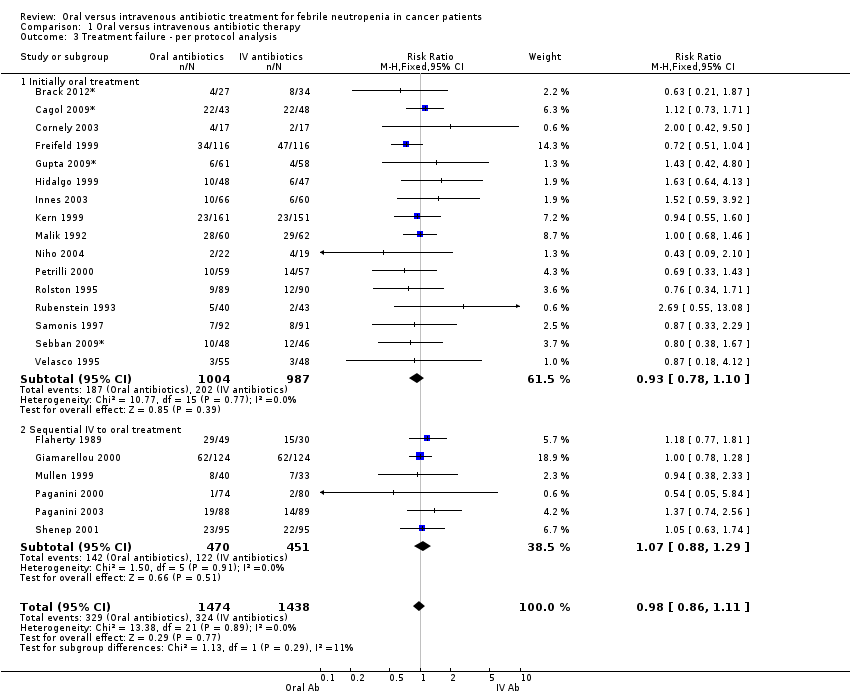
Comparison 1 Oral versus intravenous antibiotic therapy, Outcome 3 Treatment failure ‐ per protocol analysis.

Comparison 1 Oral versus intravenous antibiotic therapy, Outcome 4 Adverse events requiring discontinuation of antibiotics.
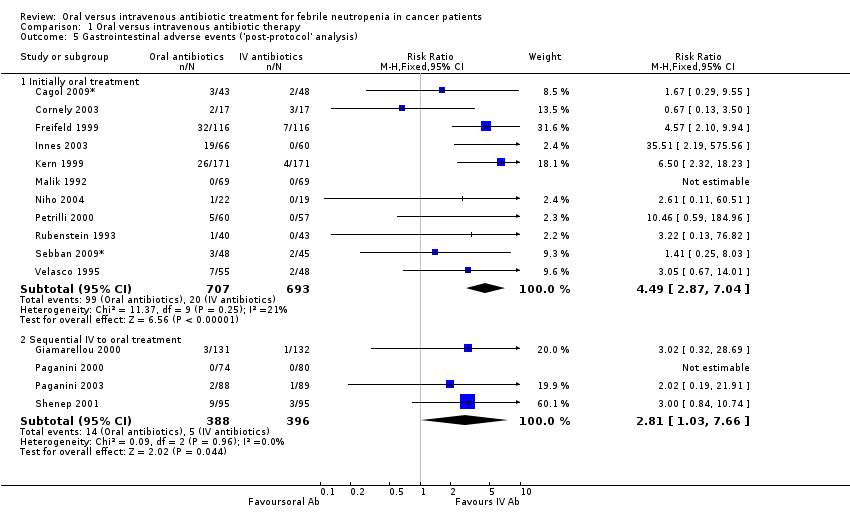
Comparison 1 Oral versus intravenous antibiotic therapy, Outcome 5 Gastrointestinal adverse events ('post‐protocol' analysis).
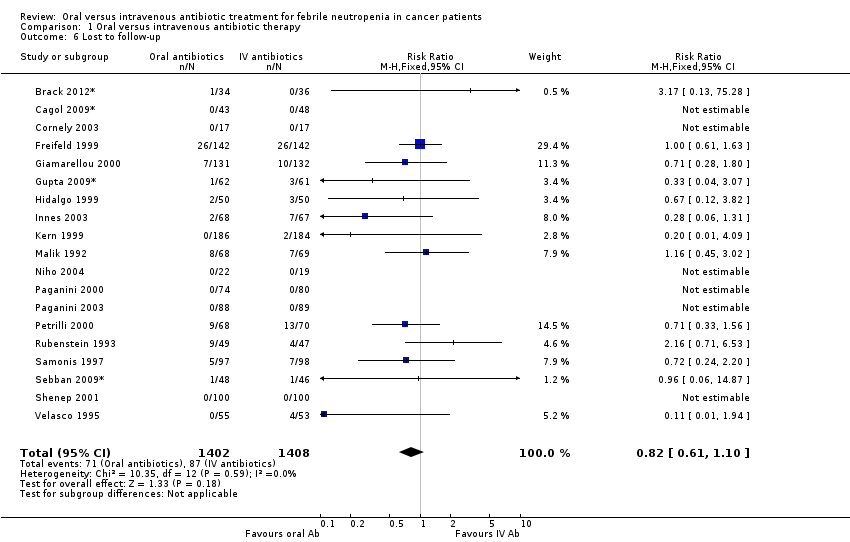
Comparison 1 Oral versus intravenous antibiotic therapy, Outcome 6 Lost to follow‐up.

Comparison 1 Oral versus intravenous antibiotic therapy, Outcome 7 Treatment failure not dt modification in update.
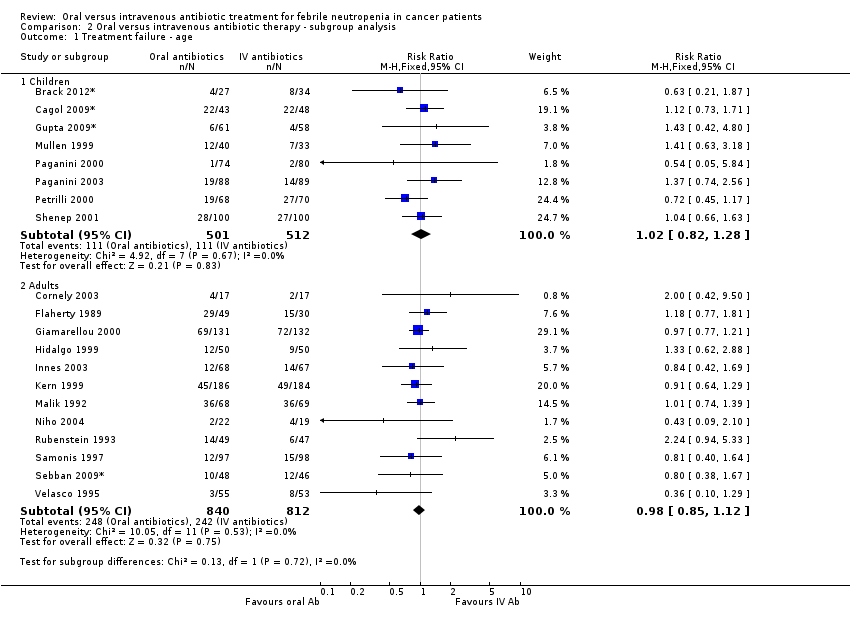
Comparison 2 Oral versus intravenous antibiotic therapy ‐ subgroup analysis, Outcome 1 Treatment failure ‐ age.
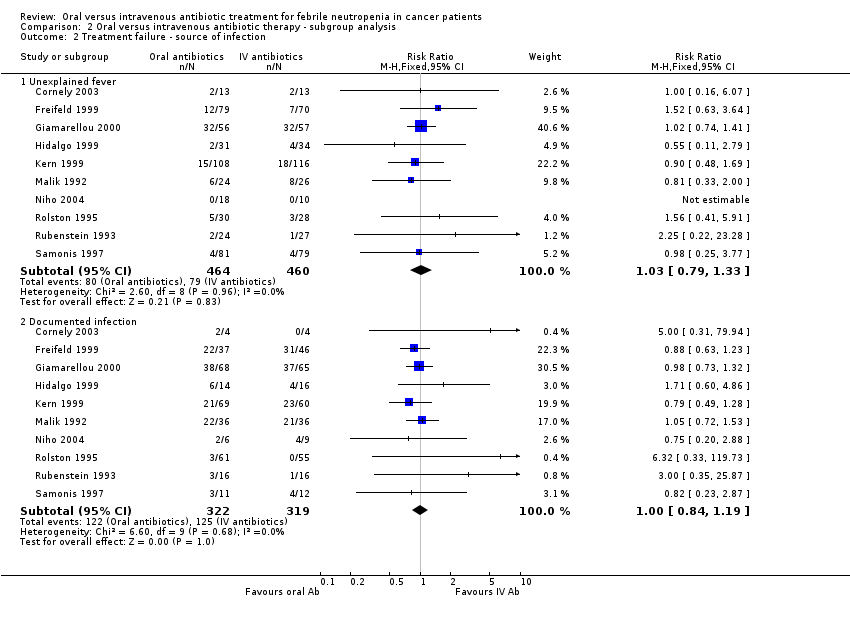
Comparison 2 Oral versus intravenous antibiotic therapy ‐ subgroup analysis, Outcome 2 Treatment failure ‐ source of infection.
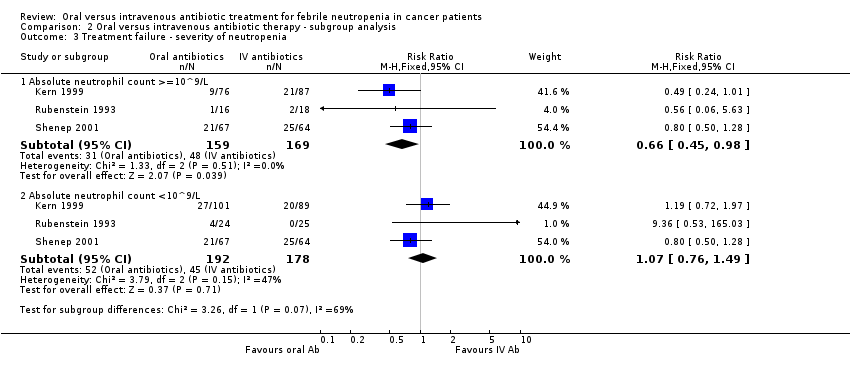
Comparison 2 Oral versus intravenous antibiotic therapy ‐ subgroup analysis, Outcome 3 Treatment failure ‐ severity of neutropenia.

Comparison 2 Oral versus intravenous antibiotic therapy ‐ subgroup analysis, Outcome 4 Treatment failure ‐ type of malignancy.
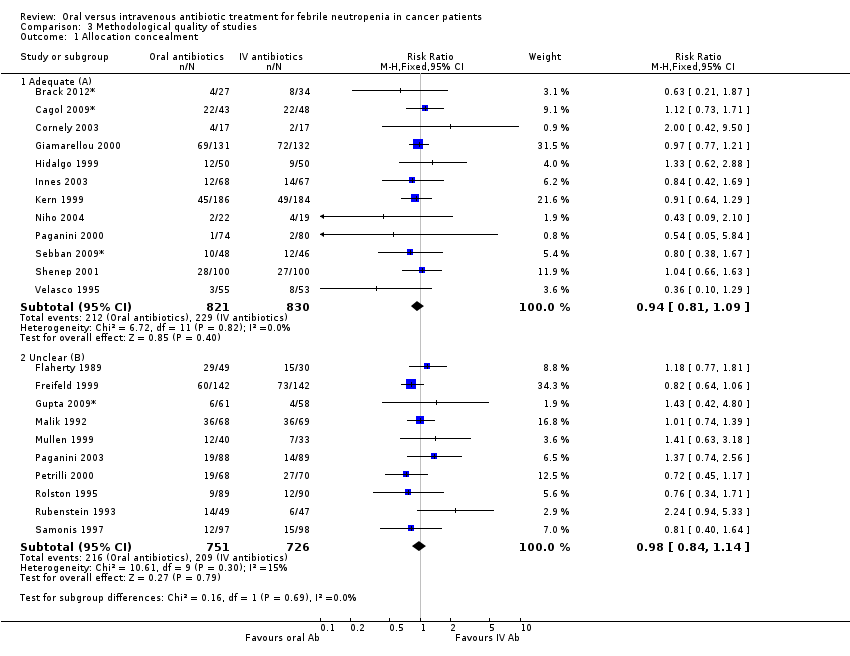
Comparison 3 Methodological quality of studies, Outcome 1 Allocation concealment.

Comparison 4 Post hoc subgroup analyses, Outcome 1 Setting.

Comparison 4 Post hoc subgroup analyses, Outcome 2 Type of oral antibiotics.
| Oral compared to intravenous antibiotic therapy for febrile neutropenia in cancer patients | ||||||
| Patient or population: patients with febrile neutropenia in cancer patients | ||||||
| Outcomes | Illustrative comparative risks* (95% CI) | Relative effect | No of Participants | Quality of the evidence | Comments | |
| Assumed risk | Corresponding risk | |||||
| intravenous antibiotic therapy | Oral | |||||
| Mortality | Study population | RR 0.95 | 1392 | ⊕⊕⊕⊝ | ||
| 32 per 1000 | 30 per 1000 | |||||
| Low risk | ||||||
| 0 per 1000 | 0 per 1000 | |||||
| Treatment failure | Study population | RR 0.96 | 3142 | ⊕⊕⊕⊝ moderate1 | ||
| 284 per 1000 | 272 per 1000 | |||||
| Moderate | ||||||
| 211 per 1000 | 203 per 1000 | |||||
| Treatment failure ‐ per protocol analysis | Study population | RR 0.98 | 2912 | ⊕⊕⊕⊝ | ||
| 225 per 1000 | 221 per 1000 | |||||
| Moderate | ||||||
| 184 per 1000 | 180 per 1000 | |||||
| Adverse events requiring discontinuation of antibiotics | Study population | RR 1.45 | 1823 | ⊕⊕⊝⊝ low1, 2 | ||
| 21 per 1000 | 31 per 1000 | |||||
| Moderate | ||||||
| 0 per 1000 | 0 per 1000 | |||||
| Treatment failure not dt modification in update | Study population | RR 0.95 | 3041 | ⊕⊕⊕⊝ | ||
| 267 per 1000 | 254 per 1000 | |||||
| Moderate | ||||||
| 180 per 1000 | 171 per 1000 | |||||
| *The basis for the assumed risk (e.g. the median control group risk across studies) is provided in footnotes. The corresponding risk (and its 95% confidence interval) is based on the assumed risk in the comparison group and the relative effect of the intervention (and its 95% CI). | ||||||
| GRADE Working Group grades of evidence | ||||||
| 1 High risk of detection bias in most of the trials 2 A wide CI | ||||||
| Common criteria |
| Haemodynamic stablity |
| No organ failure |
| Ability to take oral medications |
| No pneumonia |
| No infection of a central line |
| No severe soft‐tissue infection |
| No acute leukaemia as the background malignancy |
| No known drug allergy |
| Not pregnant or lactating women |
| Study ID | Evident infection | Previous AB | Prolonged neutropeni | Performance status | Active malignancy | BMT/PSCT | Other |
| Kern 1999 | Infected catheter or CNS infection, known bacterial /viral/fungal infection | yes | yes | no | no | yes | Need of IV supportive therapy, expected to die within 48 hours, HIV, fever unrelated to infection and protocol violation |
| Mullen 1999 | A source of infection that required hospitalisation as: tunnelitis, pneumonia, perirectal cellulitis, typhlitis, resistant microorganism to one of the study's drugs | no | no | no | yes | yes | >10% dehydration, bleeding requiring platelet transfusion, |
| Paganini 2000 | Infected catheter, perineal/ facial cellulitis, uncontrolled local infection, positive blood cultures at 72 hours | no | no | no | yes | yes | Persistance of fever >48 hours, incorrectable bleeding; refractory hypoglycemia or hypocalcemia |
| Rubenstein 1993 | Known resistant microorganism | no | no | no | no | no | Na<128, uncontrolled hypercalcemia, more than 30 miles away |
| Samonis 1997 | Pneumonia, deep organ infection | yes | yes | no | yes | no* | Prior hospitalisation |
| Shenep 2001 | Pneumonia, clinical or radiographic evidence of focal bacterial infection, severe mucositis, positive blood cultures at 48 hours | no | no | no | no | no | MRSA or P.Aeroginosa in any culture obtained in preceding 12weeks |
| Velasco1995 | Meningitis, pyelonephritis | yes | no | yes | no | no* | Long term central vein catheter |
| Petrilli 1999 | no | no | no | no | no | no* | |
| Flaherty 1989 | no | yes | no | no | no | no | |
| Freifeld 1999 | Intravascular infection, tunnelitis, pneumonia, neurologic symtoms, | no | yes | no | no | yes | Treatment with Ca‐Mg or probenecid or alluporinol or theophylline, HIV |
| Giamarelou 2000 | Suspected anaerobes | no | no | yes | no | no | Moribund and high probability of dying within 48 hours |
| Hidalgo 1999 | Pneumonia, extensive cellulitis, meningitis, pyelonephritis | no | no | yes | yes | no | Clotting abnormalities, acidosis, hypercalcaemia, uncontrolled bleeding, live >2h apart from hospital; Hx of tumour fever, other severe extra hematologic chemotherapy induced toxicity, no 24 hours home companion |
| Innes 2003 | Tunnelitis, cellulitis, abcess, clinically documented infection likely to require prolonged antibiotic therapy | yes | yes | no | no | yes | Need for the use of G/GM‐CSF and cytokines; no responsible adult living with them (carer); |
| Malik 1992 | no | yes | no | no | no | no | Recurrent FUO |
| Cornely 2003 | not excluded | excluded (except cotrimoxazole prophylaxis) | yes | yes | excluded | excluded | potential compromised absorption; inability to take oral medication; tenopathy, epilepsy; aplastic anaemia, acute leukaemia; septic shock or signs of sever infection; HIV carrier; serious concomitant disease, liver transaminase> x5 of norm. |
| Niho 2004 | not excluded | excluded | no | not excluded | no | yes | Recurrent FUO; renal insufficiency; hepatic insufficiency; hypotension or peripheral circulatory failure; uncontrolled hypercalcaemia; altered sensorium; respiratory rate >30 breaths/min; serum sodium <128 mg/dl; inability to take oral medications; intestinal malabsorption |
| Paganini 2003 | Fascial, perineal, or catheter‐associated cellulites; uncontrolled local infection; positive blood cultures within the first 48 hours; infection with microorganisms known as resistant to ceftriaxone or ciprofloxacin | included | yes | not excluded | not excluded | excluded | severe comorbidity factors; respiratory failure |
| Outcome or subgroup title | No. of studies | No. of participants | Statistical method | Effect size |
| 1 Mortality Show forest plot | 9 | 1392 | Risk Ratio (M‐H, Fixed, 95% CI) | 0.95 [0.54, 1.68] |
| 1.1 Initially oral | 6 | 961 | Risk Ratio (M‐H, Fixed, 95% CI) | 0.83 [0.43, 1.62] |
| 1.2 Sequential | 3 | 431 | Risk Ratio (M‐H, Fixed, 95% CI) | 1.38 [0.45, 4.22] |
| 2 Treatment failure Show forest plot | 22 | 3142 | Risk Ratio (M‐H, Fixed, 95% CI) | 0.96 [0.86, 1.06] |
| 2.1 Initially oral treatment | 16 | 2196 | Risk Ratio (M‐H, Fixed, 95% CI) | 0.91 [0.79, 1.03] |
| 2.2 Sequential IV to oral treatment | 6 | 946 | Risk Ratio (M‐H, Fixed, 95% CI) | 1.07 [0.90, 1.27] |
| 3 Treatment failure ‐ per protocol analysis Show forest plot | 22 | 2912 | Risk Ratio (M‐H, Fixed, 95% CI) | 0.98 [0.86, 1.11] |
| 3.1 Initially oral treatment | 16 | 1991 | Risk Ratio (M‐H, Fixed, 95% CI) | 0.93 [0.78, 1.10] |
| 3.2 Sequential IV to oral treatment | 6 | 921 | Risk Ratio (M‐H, Fixed, 95% CI) | 1.07 [0.88, 1.29] |
| 4 Adverse events requiring discontinuation of antibiotics Show forest plot | 15 | 1823 | Risk Ratio (M‐H, Random, 95% CI) | 1.45 [0.61, 3.46] |
| 4.1 Initially oral treatment | 10 | 1064 | Risk Ratio (M‐H, Random, 95% CI) | 2.78 [1.14, 6.75] |
| 4.2 Sequential IV to oral treatment | 5 | 759 | Risk Ratio (M‐H, Random, 95% CI) | 0.57 [0.26, 1.25] |
| 5 Gastrointestinal adverse events ('post‐protocol' analysis) Show forest plot | 15 | Risk Ratio (M‐H, Fixed, 95% CI) | Subtotals only | |
| 5.1 Initially oral treatment | 11 | 1400 | Risk Ratio (M‐H, Fixed, 95% CI) | 4.49 [2.87, 7.04] |
| 5.2 Sequential IV to oral treatment | 4 | 784 | Risk Ratio (M‐H, Fixed, 95% CI) | 2.81 [1.03, 7.66] |
| 6 Lost to follow‐up Show forest plot | 19 | 2810 | Risk Ratio (M‐H, Fixed, 95% CI) | 0.82 [0.61, 1.10] |
| 7 Treatment failure not dt modification in update Show forest plot | 21 | 3041 | Risk Ratio (M‐H, Fixed, 95% CI) | 0.95 [0.85, 1.06] |
| 7.1 Initially oral treatment | 15 | 2095 | Risk Ratio (M‐H, Fixed, 95% CI) | 0.91 [0.79, 1.04] |
| 7.2 Sequential IV to oral treatment | 6 | 946 | Risk Ratio (M‐H, Fixed, 95% CI) | 1.05 [0.88, 1.25] |
| Outcome or subgroup title | No. of studies | No. of participants | Statistical method | Effect size |
| 1 Treatment failure ‐ age Show forest plot | 20 | Risk Ratio (M‐H, Fixed, 95% CI) | Subtotals only | |
| 1.1 Children | 8 | 1013 | Risk Ratio (M‐H, Fixed, 95% CI) | 1.02 [0.82, 1.28] |
| 1.2 Adults | 12 | 1652 | Risk Ratio (M‐H, Fixed, 95% CI) | 0.98 [0.85, 1.12] |
| 2 Treatment failure ‐ source of infection Show forest plot | 10 | Risk Ratio (M‐H, Fixed, 95% CI) | Subtotals only | |
| 2.1 Unexplained fever | 10 | 924 | Risk Ratio (M‐H, Fixed, 95% CI) | 1.03 [0.79, 1.33] |
| 2.2 Documented infection | 10 | 641 | Risk Ratio (M‐H, Fixed, 95% CI) | 1.00 [0.84, 1.19] |
| 3 Treatment failure ‐ severity of neutropenia Show forest plot | 3 | Risk Ratio (M‐H, Fixed, 95% CI) | Subtotals only | |
| 3.1 Absolute neutrophil count >=10^9/L | 3 | 328 | Risk Ratio (M‐H, Fixed, 95% CI) | 0.66 [0.45, 0.98] |
| 3.2 Absolute neutrophil count <10^9/L | 3 | 370 | Risk Ratio (M‐H, Fixed, 95% CI) | 1.07 [0.76, 1.49] |
| 4 Treatment failure ‐ type of malignancy Show forest plot | 8 | Risk Ratio (M‐H, Fixed, 95% CI) | Subtotals only | |
| 4.1 Solid tumour | 7 | 990 | Risk Ratio (M‐H, Fixed, 95% CI) | 0.89 [0.70, 1.12] |
| 4.2 Haemetologic malignancy | 4 | 412 | Risk Ratio (M‐H, Fixed, 95% CI) | 1.04 [0.84, 1.28] |
| Outcome or subgroup title | No. of studies | No. of participants | Statistical method | Effect size |
| 1 Allocation concealment Show forest plot | 22 | Risk Ratio (M‐H, Fixed, 95% CI) | Subtotals only | |
| 1.1 Adequate (A) | 12 | 1651 | Risk Ratio (M‐H, Fixed, 95% CI) | 0.94 [0.81, 1.09] |
| 1.2 Unclear (B) | 10 | 1477 | Risk Ratio (M‐H, Fixed, 95% CI) | 0.98 [0.84, 1.14] |
| Outcome or subgroup title | No. of studies | No. of participants | Statistical method | Effect size |
| 1 Setting Show forest plot | 18 | Risk Ratio (M‐H, Fixed, 95% CI) | Subtotals only | |
| 1.1 Oral‐outpatient, IV‐inpatients | 3 | 430 | Risk Ratio (M‐H, Fixed, 95% CI) | 0.95 [0.63, 1.43] |
| 1.2 Inpatients | 6 | 1128 | Risk Ratio (M‐H, Fixed, 95% CI) | 0.93 [0.81, 1.07] |
| 1.3 Outpatients | 7 | 816 | Risk Ratio (M‐H, Fixed, 95% CI) | 1.13 [0.85, 1.50] |
| 1.4 Only first dose in | 2 | 161 | Risk Ratio (M‐H, Fixed, 95% CI) | 0.74 [0.41, 1.34] |
| 2 Type of oral antibiotics Show forest plot | 22 | Risk Ratio (M‐H, Fixed, 95% CI) | Subtotals only | |
| 2.1 Quinolones only | 7 | 967 | Risk Ratio (M‐H, Fixed, 95% CI) | 1.03 [0.88, 1.20] |
| 2.2 Quinolones in combination with augmentin, ampicillin‐sulbactam, penicillin V or clindamycin | 11 | 1679 | Risk Ratio (M‐H, Fixed, 95% CI) | 0.89 [0.76, 1.04] |
| 2.3 Cefixime | 2 | 354 | Risk Ratio (M‐H, Fixed, 95% CI) | 1.00 [0.64, 1.56] |
| 2.4 New quinolones | 2 | 128 | Risk Ratio (M‐H, Fixed, 95% CI) | 0.97 [0.50, 1.86] |