Scolaris Content Display Scolaris Content Display

Comparison 1 Tegaserod 12mg vs placebo, Outcome 1 SGA of Relief at endpoint.
Figuras y tablas -
Analysis 1.1

Comparison 1 Tegaserod 12mg vs placebo, Outcome 1 SGA of Relief at endpoint.

Comparison 1 Tegaserod 12mg vs placebo, Outcome 2 Abdominal pain and discomfort at endpoint.
Figuras y tablas -
Analysis 1.2

Comparison 1 Tegaserod 12mg vs placebo, Outcome 2 Abdominal pain and discomfort at endpoint.

Comparison 1 Tegaserod 12mg vs placebo, Outcome 3 SGA of relief at endpoint (fully published studies only).
Figuras y tablas -
Analysis 1.3

Comparison 1 Tegaserod 12mg vs placebo, Outcome 3 SGA of relief at endpoint (fully published studies only).

Comparison 1 Tegaserod 12mg vs placebo, Outcome 4 Bowel habit.
Figuras y tablas -
Analysis 1.4

Comparison 1 Tegaserod 12mg vs placebo, Outcome 4 Bowel habit.

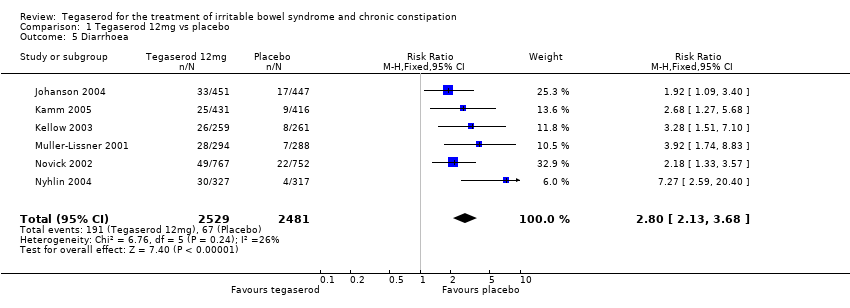
Comparison 1 Tegaserod 12mg vs placebo, Outcome 5 Diarrhoea.
Figuras y tablas -
Analysis 1.5

Comparison 1 Tegaserod 12mg vs placebo, Outcome 5 Diarrhoea.

Comparison 1 Tegaserod 12mg vs placebo, Outcome 6 Headache.
Figuras y tablas -
Analysis 1.6

Comparison 1 Tegaserod 12mg vs placebo, Outcome 6 Headache.

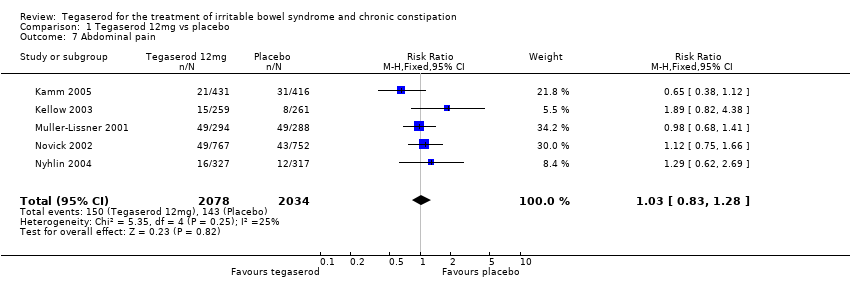
Comparison 1 Tegaserod 12mg vs placebo, Outcome 7 Abdominal pain.
Figuras y tablas -
Analysis 1.7

Comparison 1 Tegaserod 12mg vs placebo, Outcome 7 Abdominal pain.

Comparison 1 Tegaserod 12mg vs placebo, Outcome 8 Nausea.
Figuras y tablas -
Analysis 1.8

Comparison 1 Tegaserod 12mg vs placebo, Outcome 8 Nausea.

Comparison 1 Tegaserod 12mg vs placebo, Outcome 9 Complete spontaneous bowel movement responders at week 12.
Figuras y tablas -
Analysis 1.9

Comparison 1 Tegaserod 12mg vs placebo, Outcome 9 Complete spontaneous bowel movement responders at week 12.

Comparison 1 Tegaserod 12mg vs placebo, Outcome 10 Weekly frequency of bowel movements.
Figuras y tablas -
Analysis 1.10

Comparison 1 Tegaserod 12mg vs placebo, Outcome 10 Weekly frequency of bowel movements.

Comparison 1 Tegaserod 12mg vs placebo, Outcome 11 SGA of relief weeks 1‐4 of DB treatment.
Figuras y tablas -
Analysis 1.11

Comparison 1 Tegaserod 12mg vs placebo, Outcome 11 SGA of relief weeks 1‐4 of DB treatment.

Comparison 2 Tegaserod 4mg vs placebo, Outcome 1 SGA of Relief at endpoint.
Figuras y tablas -
Analysis 2.1

Comparison 2 Tegaserod 4mg vs placebo, Outcome 1 SGA of Relief at endpoint.

Comparison 2 Tegaserod 4mg vs placebo, Outcome 2 Abdominal pain and discomfort at endpoint.
Figuras y tablas -
Analysis 2.2

Comparison 2 Tegaserod 4mg vs placebo, Outcome 2 Abdominal pain and discomfort at endpoint.

Comparison 2 Tegaserod 4mg vs placebo, Outcome 3 Bowel habit.
Figuras y tablas -
Analysis 2.3

Comparison 2 Tegaserod 4mg vs placebo, Outcome 3 Bowel habit.

Comparison 2 Tegaserod 4mg vs placebo, Outcome 4 Weekly frequency of bowel movements.
Figuras y tablas -
Analysis 2.4

Comparison 2 Tegaserod 4mg vs placebo, Outcome 4 Weekly frequency of bowel movements.

Comparison 2 Tegaserod 4mg vs placebo, Outcome 5 Diarrhoea.
Figuras y tablas -
Analysis 2.5

Comparison 2 Tegaserod 4mg vs placebo, Outcome 5 Diarrhoea.

Comparison 3 Tegaserod 12mg vs 4mg, Outcome 1 SGA of Relief at endpoint.
Figuras y tablas -
Analysis 3.1

Comparison 3 Tegaserod 12mg vs 4mg, Outcome 1 SGA of Relief at endpoint.

Comparison 3 Tegaserod 12mg vs 4mg, Outcome 2 Abdominal pain and discomfort at endpoint.
Figuras y tablas -
Analysis 3.2

Comparison 3 Tegaserod 12mg vs 4mg, Outcome 2 Abdominal pain and discomfort at endpoint.

Comparison 3 Tegaserod 12mg vs 4mg, Outcome 3 Bowel habit.
Figuras y tablas -
Analysis 3.3

Comparison 3 Tegaserod 12mg vs 4mg, Outcome 3 Bowel habit.

Comparison 3 Tegaserod 12mg vs 4mg, Outcome 4 Weekly frequency of bowel movements.
Figuras y tablas -
Analysis 3.4

Comparison 3 Tegaserod 12mg vs 4mg, Outcome 4 Weekly frequency of bowel movements.

Comparison 4 Tegaserod 4mg & 12mg vs placebo, Outcome 1 SGA of Relief at endpoint.
Figuras y tablas -
Analysis 4.1

Comparison 4 Tegaserod 4mg & 12mg vs placebo, Outcome 1 SGA of Relief at endpoint.

Comparison 4 Tegaserod 4mg & 12mg vs placebo, Outcome 2 Abdominal pain and discomfort at endpoint.
Figuras y tablas -
Analysis 4.2

Comparison 4 Tegaserod 4mg & 12mg vs placebo, Outcome 2 Abdominal pain and discomfort at endpoint.

Comparison 4 Tegaserod 4mg & 12mg vs placebo, Outcome 3 Bowel habit.
Figuras y tablas -
Analysis 4.3

Comparison 4 Tegaserod 4mg & 12mg vs placebo, Outcome 3 Bowel habit.

Table 1. SGA of Relief responder rates

Study

Tegaserod 12 mg

Tegaserod 4 mg

Placebo

Comments

B307

42.2%

38.3%

37.0%

Applies to last 4 weeks of DB treatment. In the 12 mg group, patients started on 4 mg for one month, which could be increased to 12 mg according to response (65% of patients took 12 mg after the first month). The responder rate is adjusted for missing SGAs, laxative use, and duration of treatment. P = 0.142 for 12 mg vs placebo, P = 0.837 for 4 mg vs placebo

Kellow 2003

46.8%

No 4 mg group

28.3%

Applies to weeks 1 to 4 of DB treatment. P < 0.0001 for 12 mg vs placebo

Lefkowitz 1999b

45.7%

38.9%

33.3%

Applies to last 4 weeks of DB treatment. The responder rate is adjusted for missing SGAs, laxative use, and duration of treatment. P = 0.004 for 12 mg vs placebo, P = 0.157 for 4 mg vs placebo

Muller‐Lissner 2001

38.4%

38.8%

30.2%

Applies to last 4 weeks of DB treatment. The responder rate is adjusted for missing SGAs, laxative use, and duration of treatment. P = 0.033 for 12 mg vs placebo, P = 0.018 for 4 mg vs placebo

Novick 2002

43.5%

No 4 mg group

38.8%

Applies to last 4 weeks of DB treatment. The responder rate is adjusted for missing SGAs, laxative use, and duration of treatment. P < 0.033 for 12 mg vs placebo

Hamling 1998

No numerical data

No numerical data

No numerical data

Responder rates reported in abstract but not for ITT population, or for each tegaserod dosage group

Lefkowitz 1999a

No numerical data

No numerical data

No numerical data

Nyhlin 2004

30.5%

No 4 mg group

20.8%

Applies to weeks 1 to 4 of DB treatment. P = 0.006 for 12 mg vs placebo

Nyhlin 2004

31%

No 4 mg group

20.4%

Applies to weeks 1 to 12 of DB treatment. P = 0.0027 for 12 mg vs placebo

Tack 2005

33.7%

No 4 mg group

24.2%

Applies to weeks 1 to 4 of DB treatment. Difference in response rate 9.3%, 95% CI 5.3 to 13.3), P < 0.0001

Figuras y tablas -
Table 1. SGA of Relief responder rates
Table 2. Abdominal pain and discomfort responder rates

Study

Tegaserod 12 mg

Tegaserod 4 mg

Placebo

Comments

B307

27.6%

25.5%

30.6%

In the 12 mg group, patients started on 4 mg for one month, which could be increased to 12 mg according to response (65% of patients took 12 mg after the first month). P = 0.411 for 12 mg vs placebo, P = 0.141 for 4 mg vs placebo

Hamling 1998

No numerical data

No numerical data

No numerical data

Responder rates reported in abstract but not for ITT population, or for each tegaserod dosage group

Lefkowitz 1999a

No numerical data

No numerical data

No numerical data

Lefkowitz 1999b

25.1%

23.4%

18.7%

P = 0.075 for 12 mg vs placebo, P = 0.185 for 4 mg vs placebo

Muller‐Lissner 2001

29.9%

29.8%

22.6%

P = 0.044 for 12 mg vs placebo, P = 0.055 for 4 mg vs placebo

Novick 2002

No responder rate

No 4mg group

No responder rate

Mean score differences reported on 7‐point scale (endpoint minus baseline); ‐1.01 for 12 mg, ‐0.80 for placebo, P < 0.003

Figuras y tablas -
Table 2. Abdominal pain and discomfort responder rates
Table 3. Abdominal pain

Study

Outcome

Teg 12 mg + laxative

Laxative

Comments

Khoshoo 2006

Mean pain score at 4 weeks

4.29 (SD 2.31)

6.15 (SD 2.38)

Scored on a scale of 0 to 10. P < 0.05 between groups

Khosoo 2006

% with good pain reduction (3 or more points on scale)

66.7%

18.5%

P < 0.05 between groups

Khosoo 2006

% with no pain reduction (2 points or less on pain scale)

23.8%

59.3%

P < 0.05 between groups

Khosoo 2006

% with increased pain (not defined)

9.5%

22.2%

P < 0.05 between groups

Figuras y tablas -
Table 3. Abdominal pain
Table 4. Bowel habit responder rates

Study

Tegaserod 12 mg

Tegaserod 4 mg

Placebo

Comments

B307

24.0%

27.0%

25.0%

In the 12 mg group, patients started on 4 mg for one month, which could be increased to 12 mg according to response (65% took 12mg after the first month). P = 0.847 for 12 mg vs placebo, P = 0.661 for 4 mg vs placebo

Lefkowitz 1999b

24.7%

26.4%

20.2%

P = 0.218 for 12 mg vs placebo, P = 0.082 for 4 mg vs placebo

Muller‐Lissner 2001

26.2%

28.8%

22.6%

P = 0.337 for 12 mg vs placebo, P = 0.096 for 4 mg vs placebo

Novick 2002

No responder rate

No 4 mg group

No responder rate

Mean score difference (endpoint minus baseline) reported, on a 7‐point ordinal scale; ‐1.30 for 12 mg, ‐0.95 for placebo, P < 0.001

Figuras y tablas -
Table 4. Bowel habit responder rates
Table 5. Satisfaction with bowel habit response rates

Novick 2002

Month 1

Month 2

Month 3

Tegaserod 12 mg

56.0%

58.7%

60.4%

Placebo

41.1%

50.1%

52.7%

P for tegaserod vs placebo

P < 0.001

P = 0.002

P = 0.007

Figuras y tablas -
Table 5. Satisfaction with bowel habit response rates
Table 6. Outcomes of repeated tegaserod treatment (Tack 2005)

Outcome

Tegaserod 12mg

Placebo

Comments

Satisfactory relief of overall IBS symptoms (75% of the time)

44.9%

28.7%

(difference in response rate 16.6%, 95% CI 10.5 to 22.2), P < 0.0001

Satisfactory relief of abdominal pain and discomfort (75% of the time)

42.4%

27.1%

(difference in response rate 15.9%, 95% CI 10.3 to 21.5), P < 0.0001

Satisfactory relief of constipation (75% of the time)

45.1%

27.5%

P < 0.0001

Improvement in abdominal pain and discomfort

54.2%

41.8%

P < 0.0001 (1‐point or greater improvement on 7‐point scale)

Figuras y tablas -
Table 6. Outcomes of repeated tegaserod treatment (Tack 2005)
Table 7. Responder rate for complete spontaneous bowel movements

Study

Week assessed

Tegaserod 4 mg

Tegaserod 12 mg

Placebo

Comments

Kamm 2005

4

35.6%

40.2%

26.7%

P < 0.0001 for 12 mg vs placebo, P = 0.059 for 4 mg vs placebo

Kamm 2005

12

no numerical data

43.2%

30.6%

P < 0.0001 for 12 mg vs placebo, P = 0.14 for 4 mg vs placebo

Johanson 2004

4

41.4%

43.2%

25.1%

P < 0.0001 for 12 mg vs placebo, P < 0.0001 for 4 mg vs placebo

Johanson 2004

12

40.3%

44.8%

26.9%

P < 0.0001 for 12 mg vs placebo, P < 0.0001 for 4 mg vs placebo

Figuras y tablas -
Table 7. Responder rate for complete spontaneous bowel movements
Table 8. Time to first bowel movement (median)

Study

Tegaserod 4 mg

Tegaserod 12 mg

Placebo

Comments

Kamm 2005

174.3

98

286.3

Hours to CSBM. P < 0.007 for 4 mg and 12 mg vs placebo

Johanson 2004

117

73

229

Hours to CSBM. P < 0.01 for 4 mg and P < 0.001 for 12 mg vs placebo

Kamm 2005

21.3

18.4

37.2

Hours to SBM. P < 0.001 for 4 mg and 12 mg vs placebo

Johanson 2004

data shown in graph only

data shown in graph only

data shown in graph only

Figuras y tablas -
Table 8. Time to first bowel movement (median)
Table 9. Diarrhoea (adverse effect)

Study

Tegaserod 12 mg

Tegaserod 4 mg

Placebo

Comments

Fidelholtz 2002

17.6%

48.6%

35.3%

Study included D‐IBS patients. P = NS between groups

Kellow 2003

10.0%

No 4 mg group

3.1%

Study included C‐IBS patients. P value not reported

Muller‐Lissner 2001

9.6%

7.1%

2.5%

Study included C‐IBS patients. P value not reported

Novick 2002

6.4%

No 4 mg group

2.9%

Study included C‐IBS patients. P value not reported

Nyhlin 2004

9.2%

No 4 mg group

1.3%

Study included C‐IBS patients. P value not reported

Kamm 2005

5.8%

3.9%

2.2%

Study included patients with chronic constipation. P = 0.1516 for 4 mg vs placebo, P = 0.0072 for 12 mg vs placebo

Johanson 2004

7.3%

4.5%

3.8%

Study included C‐IBS patients. P value not reported

Figuras y tablas -
Table 9. Diarrhoea (adverse effect)
Table 10. Headache (adverse effect)

Study

Tegaserod 12 mg

Tegaserod 4 mg

Placebo

Comments

Fidelholtz 2002

20.6%

28.6%

23.5%

P = NS

Kellow 2003

12.0%

No 4 mg group

11.1%

P value not reported

Muller‐Lissner 2001

27.3%

30.6%

27.3%

P value not reported

Novick 2002

9.0%

No 4 mg group

5.7%

P value not reported

Nyhlin 2004

8.0%

No 4 mg group

4.7%

P value not reported

Kamm 2005

12.3%

11.1%

13.7%

P value not reported

Johanson 2004

9.8%

9.2%

12.8%

P value not reported

Figuras y tablas -
Table 10. Headache (adverse effect)
Table 11. Abdominal pain (adverse effect)

Study

Tegaserod 12 mg

Tegaserod 4 mg

Placebo

Comments

Fidelholtz 2002

20.6%

31.4%

23.5%

P = NS

Kellow 2003

5.8%

No 4 mg group

3.1%

P value not reported

Muller‐Lissner 2001

16.7%

16.5%

17.1%

P value not reported

Novick 2002

6.4%

No 4 mg group

5.7%

P value not reported

Nyhlin 2004

4.9%

No 4 mg group

3.8%

P value not reported

Figuras y tablas -
Table 11. Abdominal pain (adverse effect)
Table 12. Nausea (adverse effect)

Study

Tegaserod 12 mg

Tegaserod 4 mg

Placebo

Comments

Kellow 2003

4.2%

No 4 mg group

3.4%

P value not reported

Muller‐Lissner 2001

7.2%

7.4%

8.7%

P value not reported

Novick 2002

6.8%

No 4 mg group

4.7%

P value not reported

Nyhlin 2004

5.5%

No 4 mg group

5.1%

P value not reported

Figuras y tablas -
Table 12. Nausea (adverse effect)
Comparison 1. Tegaserod 12mg vs placebo

Outcome or subgroup title

No. of studies

No. of participants

Statistical method

Effect size

1 SGA of Relief at endpoint Show forest plot

4

3194

Risk Ratio (M‐H, Fixed, 95% CI)

1.19 [1.09, 1.29]

2 Abdominal pain and discomfort at endpoint Show forest plot

3

1675

Risk Ratio (M‐H, Random, 95% CI)

1.16 [0.89, 1.51]

3 SGA of relief at endpoint (fully published studies only) Show forest plot

2

2101

Risk Ratio (M‐H, Fixed, 95% CI)

1.16 [1.04, 1.29]

4 Bowel habit Show forest plot

3

1675

Risk Ratio (M‐H, Fixed, 95% CI)

1.10 [0.93, 1.31]

5 Diarrhoea Show forest plot

6

5010

Risk Ratio (M‐H, Fixed, 95% CI)

2.80 [2.13, 3.68]

6 Headache Show forest plot

6

5010

Risk Ratio (M‐H, Fixed, 95% CI)

1.07 [0.92, 1.24]

7 Abdominal pain Show forest plot

5

4112

Risk Ratio (M‐H, Fixed, 95% CI)

1.03 [0.83, 1.28]

8 Nausea Show forest plot

5

4112

Risk Ratio (M‐H, Fixed, 95% CI)

1.21 [0.93, 1.57]

9 Complete spontaneous bowel movement responders at week 12 Show forest plot

2

1745

Risk Ratio (M‐H, Fixed, 95% CI)

1.54 [1.35, 1.75]

10 Weekly frequency of bowel movements Show forest plot

2

5154

Mean Difference (IV, Fixed, 95% CI)

0.69 [0.55, 0.83]

10.1 Complete spontaneous bowel movements (CSBM)

2

1718

Mean Difference (IV, Fixed, 95% CI)

0.60 [0.42, 0.78]

10.2 Spontaneous bowel movements (SBM)

2

1718

Mean Difference (IV, Fixed, 95% CI)

0.91 [0.59, 1.23]

10.3 Bowel movements

2

1718

Mean Difference (IV, Fixed, 95% CI)

0.75 [0.46, 1.05]

11 SGA of relief weeks 1‐4 of DB treatment Show forest plot

2

3180

Risk Ratio (M‐H, Fixed, 95% CI)

1.46 [1.28, 1.66]

Figuras y tablas -
Comparison 1. Tegaserod 12mg vs placebo
Comparison 2. Tegaserod 4mg vs placebo

Outcome or subgroup title

No. of studies

No. of participants

Statistical method

Effect size

1 SGA of Relief at endpoint Show forest plot

3

1685

Risk Ratio (M‐H, Fixed, 95% CI)

1.15 [1.02, 1.31]

2 Abdominal pain and discomfort at endpoint Show forest plot

3

1685

Risk Ratio (M‐H, Random, 95% CI)

1.10 [0.82, 1.49]

3 Bowel habit Show forest plot

3

1685

Risk Ratio (M‐H, Fixed, 95% CI)

1.21 [1.02, 1.43]

4 Weekly frequency of bowel movements Show forest plot

2

5103

Mean Difference (IV, Fixed, 95% CI)

0.52 [0.38, 0.66]

4.1 Complete spontaneous bowel movements (CSBM)

2

1701

Mean Difference (IV, Fixed, 95% CI)

0.44 [0.26, 0.62]

4.2 Spontaneous bowel movements (SBM)

2

1701

Mean Difference (IV, Fixed, 95% CI)

0.73 [0.41, 1.05]

4.3 Bowel movements

2

1701

Mean Difference (IV, Fixed, 95% CI)

0.58 [0.28, 0.88]

5 Diarrhoea Show forest plot

3

2317

Risk Ratio (M‐H, Fixed, 95% CI)

1.70 [1.12, 2.59]

Figuras y tablas -
Comparison 2. Tegaserod 4mg vs placebo
Comparison 3. Tegaserod 12mg vs 4mg

Outcome or subgroup title

No. of studies

No. of participants

Statistical method

Effect size

1 SGA of Relief at endpoint Show forest plot

3

1682

Risk Ratio (M‐H, Fixed, 95% CI)

1.09 [0.97, 1.22]

2 Abdominal pain and discomfort at endpoint Show forest plot

3

1682

Risk Ratio (M‐H, Fixed, 95% CI)

1.05 [0.90, 1.23]

3 Bowel habit Show forest plot

3

1682

Risk Ratio (M‐H, Fixed, 95% CI)

0.91 [0.78, 1.07]

4 Weekly frequency of bowel movements Show forest plot

2

5175

Mean Difference (IV, Fixed, 95% CI)

0.17 [0.02, 0.32]

4.1 CSBM

2

1725

Mean Difference (IV, Fixed, 95% CI)

0.16 [‐0.04, 0.36]

4.2 SBM

2

1725

Mean Difference (IV, Fixed, 95% CI)

0.19 [‐0.14, 0.53]

4.3 Bowel movements

2

1725

Mean Difference (IV, Fixed, 95% CI)

0.19 [‐0.12, 0.50]

Figuras y tablas -
Comparison 3. Tegaserod 12mg vs 4mg
Comparison 4. Tegaserod 4mg & 12mg vs placebo

Outcome or subgroup title

No. of studies

No. of participants

Statistical method

Effect size

1 SGA of Relief at endpoint Show forest plot

4

4040

Risk Ratio (M‐H, Fixed, 95% CI)

1.17 [1.08, 1.27]

2 Abdominal pain and discomfort at endpoint Show forest plot

3

2521

Risk Ratio (M‐H, Random, 95% CI)

1.13 [0.85, 1.51]

3 Bowel habit Show forest plot

3

2521

Risk Ratio (M‐H, Fixed, 95% CI)

1.16 [1.00, 1.34]

Figuras y tablas -
Comparison 4. Tegaserod 4mg & 12mg vs placebo