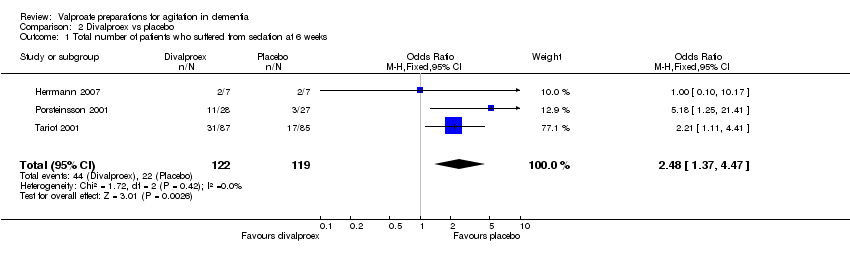
| 1 Total number of patients who suffered from sedation at 6 weeks Show forest plot | 3 | 241 | Odds Ratio (M‐H, Fixed, 95% CI) | 2.48 [1.37, 4.47] |
|
| 2 Total number of patients who suffered from nausea, vomiting, or diarrhea at 6 weeks Show forest plot | 2 | 208 | Odds Ratio (M‐H, Fixed, 95% CI) | 7.09 [1.73, 29.02] |
|
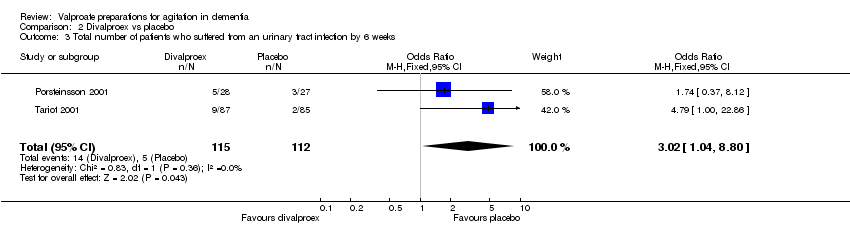
| 3 Total number of patients who suffered from an urinary tract infection by 6 weeks Show forest plot | 2 | 227 | Odds Ratio (M‐H, Fixed, 95% CI) | 3.02 [1.04, 8.80] |
|
| 4 Total number of patients who suffered falls without injury by 6 weeks Show forest plot | 3 | 222 | Odds Ratio (M‐H, Fixed, 95% CI) | 1.70 [0.84, 3.44] |
|
| 5 Total number of patients who suffered falls with injury by 6 weeks Show forest plot | 2 | 82 | Odds Ratio (M‐H, Fixed, 95% CI) | 1.57 [0.38, 6.41] |
|
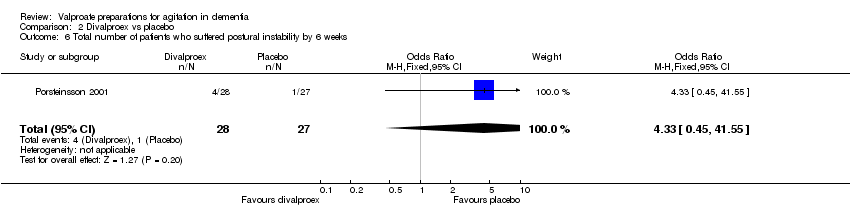
| 6 Total number of patients who suffered postural instability by 6 weeks Show forest plot | 1 | 55 | Odds Ratio (M‐H, Fixed, 95% CI) | 4.33 [0.45, 41.55] |
|
| 7 Total number of patients who suffered weakness by 6 weeks Show forest plot | 1 | 55 | Peto Odds Ratio (Peto, Fixed, 95% CI) | 8.00 [1.06, 60.16] |
|
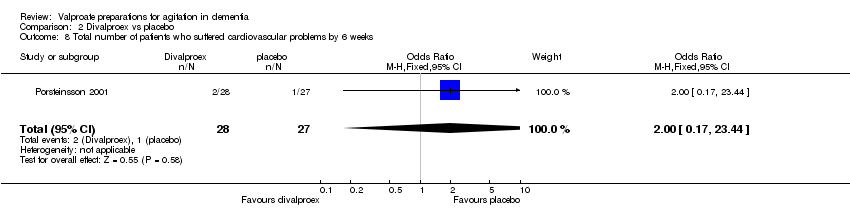
| 8 Total number of patients who suffered cardiovascular problems by 6 weeks Show forest plot | 1 | 55 | Odds Ratio (M‐H, Fixed, 95% CI) | 2.0 [0.17, 23.44] |
|
| 9 Total number of patients who suffered edema by 6 weeks Show forest plot | 1 | 55 | Peto Odds Ratio (Peto, Fixed, 95% CI) | 7.69 [0.77, 77.21] |
|
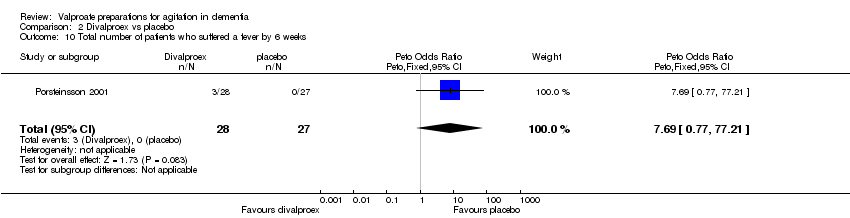
| 10 Total number of patients who suffered a fever by 6 weeks Show forest plot | 1 | 55 | Peto Odds Ratio (Peto, Fixed, 95% CI) | 7.69 [0.77, 77.21] |
|
| 11 Total number of patients who suffered a respiratory problem by 6 weeks Show forest plot | 1 | 55 | Peto Odds Ratio (Peto, Fixed, 95% CI) | 8.34 [1.35, 51.60] |
|
| 12 Total number of patients who suffered any adverse effect by 6 weeks Show forest plot | 4 | 394 | Odds Ratio (M‐H, Fixed, 95% CI) | 1.99 [1.29, 3.08] |
|
| 13 Total number of patients who suffered from ataxia at 6 weeks Show forest plot | 1 | 55 | Odds Ratio (M‐H, Fixed, 95% CI) | 1.33 [0.27, 6.61] |
|
| 14 Total number of patients who suffered from a skin problem at 6 weeks Show forest plot | 2 | 227 | Odds Ratio (M‐H, Fixed, 95% CI) | 1.27 [0.45, 3.58] |
|
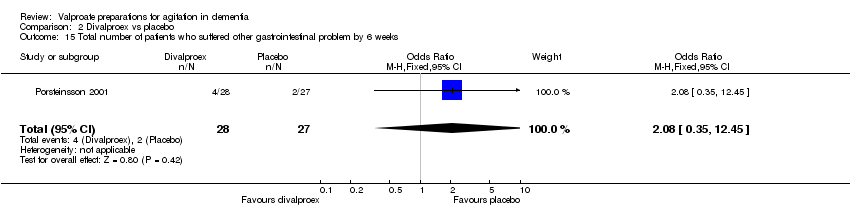
| 15 Total number of patients who suffered other gastrointestinal problem by 6 weeks Show forest plot | 1 | 55 | Odds Ratio (M‐H, Fixed, 95% CI) | 2.08 [0.35, 12.45] |
|
| 16 Total number of patients who suffered trauma (other than falls) by 6 weeks Show forest plot | 1 | 55 | Odds Ratio (M‐H, Fixed, 95% CI) | 0.62 [0.09, 4.01] |
|
| 17 Total number of patients who suffered joint problems by 6 weeks Show forest plot | 1 | 55 | Odds Ratio (M‐H, Fixed, 95% CI) | 0.30 [0.03, 3.04] |
|
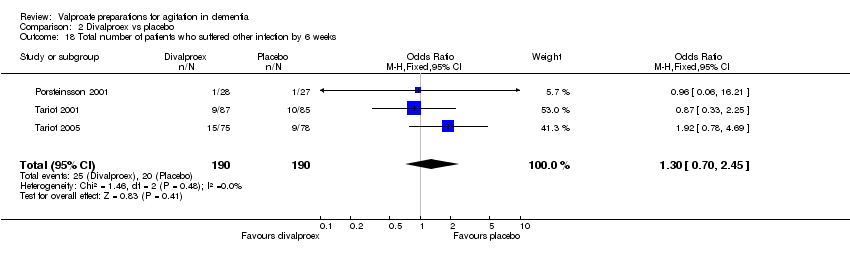
| 18 Total number of patients who suffered other infection by 6 weeks Show forest plot | 3 | 380 | Odds Ratio (M‐H, Fixed, 95% CI) | 1.30 [0.70, 2.45] |
|
| 19 Total number of patients who suffered hallucinations by 6 weeks Show forest plot | 1 | 55 | Peto Odds Ratio (Peto, Fixed, 95% CI) | 7.13 [0.14, 359.55] |
|
| 20 Total number of patients who suffered accidental injury by 6 weeks Show forest plot | 1 | 172 | Peto Odds Ratio (Peto, Fixed, 95% CI) | 1.52 [0.79, 2.92] |
|
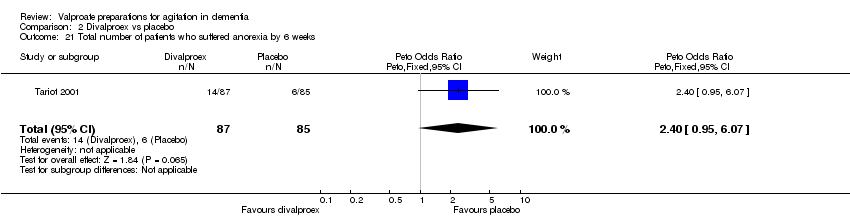
| 21 Total number of patients who suffered anorexia by 6 weeks Show forest plot | 1 | 172 | Peto Odds Ratio (Peto, Fixed, 95% CI) | 2.40 [0.95, 6.07] |
|
| 22 Total number of patients who suffered weight loss by 6 weeks Show forest plot | 1 | 172 | Peto Odds Ratio (Peto, Fixed, 95% CI) | 2.56 [0.76, 8.66] |
|
| 23 Total number of patients who suffered dehydration by 6 weeks Show forest plot | 1 | 172 | Peto Odds Ratio (Peto, Fixed, 95% CI) | 3.13 [0.82, 11.94] |
|
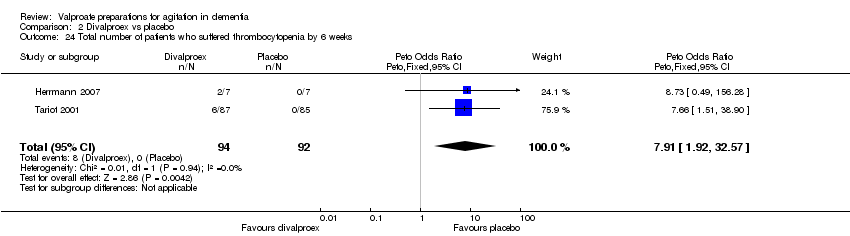
| 24 Total number of patients who suffered thrombocytopenia by 6 weeks Show forest plot | 2 | 186 | Peto Odds Ratio (Peto, Fixed, 95% CI) | 7.91 [1.92, 32.57] |
|
| 25 Total number of patients who suffered serious adverse events by 6 weeks Show forest plot | 3 | 235 | Peto Odds Ratio (Peto, Fixed, 95% CI) | 1.34 [0.74, 2.45] |
|