Scolaris Content Display Scolaris Content Display

Comparison 1 Betamimetic versus placebo/no treatment (primary outcomes), Outcome 1 Very preterm birth (Less than 34 weeks' gestation).
Figuras y tablas -
Analysis 1.1

Comparison 1 Betamimetic versus placebo/no treatment (primary outcomes), Outcome 1 Very preterm birth (Less than 34 weeks' gestation).

Comparison 1 Betamimetic versus placebo/no treatment (primary outcomes), Outcome 2 Low birthweight (< 2500 grams).
Figuras y tablas -
Analysis 1.2

Comparison 1 Betamimetic versus placebo/no treatment (primary outcomes), Outcome 2 Low birthweight (< 2500 grams).

Comparison 1 Betamimetic versus placebo/no treatment (primary outcomes), Outcome 3 Neonatal intensive care unit admission.
Figuras y tablas -
Analysis 1.3

Comparison 1 Betamimetic versus placebo/no treatment (primary outcomes), Outcome 3 Neonatal intensive care unit admission.

Comparison 1 Betamimetic versus placebo/no treatment (primary outcomes), Outcome 4 Perinatal mortality.
Figuras y tablas -
Analysis 1.4

Comparison 1 Betamimetic versus placebo/no treatment (primary outcomes), Outcome 4 Perinatal mortality.

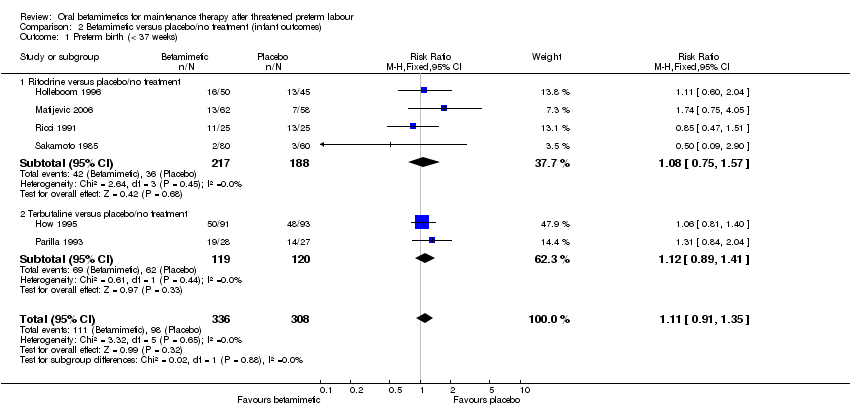
Comparison 2 Betamimetic versus placebo/no treatment (infant outcomes), Outcome 1 Preterm birth (< 37 weeks).
Figuras y tablas -
Analysis 2.1

Comparison 2 Betamimetic versus placebo/no treatment (infant outcomes), Outcome 1 Preterm birth (< 37 weeks).

Comparison 2 Betamimetic versus placebo/no treatment (infant outcomes), Outcome 2 Birthweight.
Figuras y tablas -
Analysis 2.2

Comparison 2 Betamimetic versus placebo/no treatment (infant outcomes), Outcome 2 Birthweight.

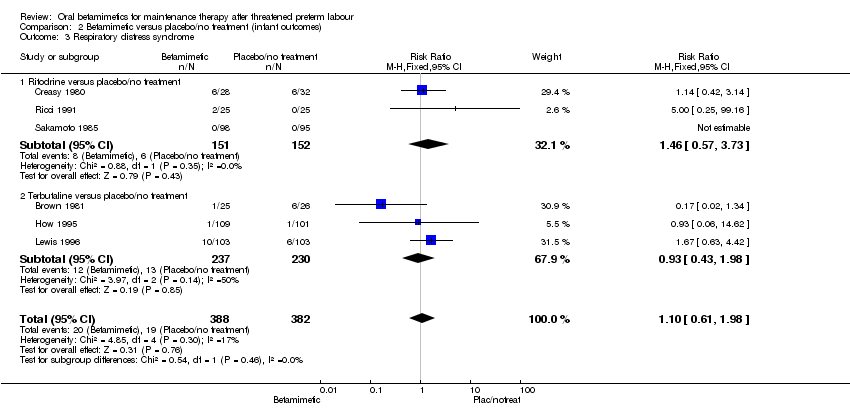
Comparison 2 Betamimetic versus placebo/no treatment (infant outcomes), Outcome 3 Respiratory distress syndrome.
Figuras y tablas -
Analysis 2.3

Comparison 2 Betamimetic versus placebo/no treatment (infant outcomes), Outcome 3 Respiratory distress syndrome.

Comparison 2 Betamimetic versus placebo/no treatment (infant outcomes), Outcome 4 Necrotising enterocolitis.
Figuras y tablas -
Analysis 2.4

Comparison 2 Betamimetic versus placebo/no treatment (infant outcomes), Outcome 4 Necrotising enterocolitis.

Comparison 2 Betamimetic versus placebo/no treatment (infant outcomes), Outcome 5 Intraventricular haemorrhage.
Figuras y tablas -
Analysis 2.5

Comparison 2 Betamimetic versus placebo/no treatment (infant outcomes), Outcome 5 Intraventricular haemorrhage.

Comparison 2 Betamimetic versus placebo/no treatment (infant outcomes), Outcome 6 Neonatal jaundice.
Figuras y tablas -
Analysis 2.6

Comparison 2 Betamimetic versus placebo/no treatment (infant outcomes), Outcome 6 Neonatal jaundice.

Comparison 2 Betamimetic versus placebo/no treatment (infant outcomes), Outcome 7 Apgar score < 7 at 5 minutes.
Figuras y tablas -
Analysis 2.7

Comparison 2 Betamimetic versus placebo/no treatment (infant outcomes), Outcome 7 Apgar score < 7 at 5 minutes.

Comparison 2 Betamimetic versus placebo/no treatment (infant outcomes), Outcome 8 Need for mechanical ventilation.
Figuras y tablas -
Analysis 2.8

Comparison 2 Betamimetic versus placebo/no treatment (infant outcomes), Outcome 8 Need for mechanical ventilation.

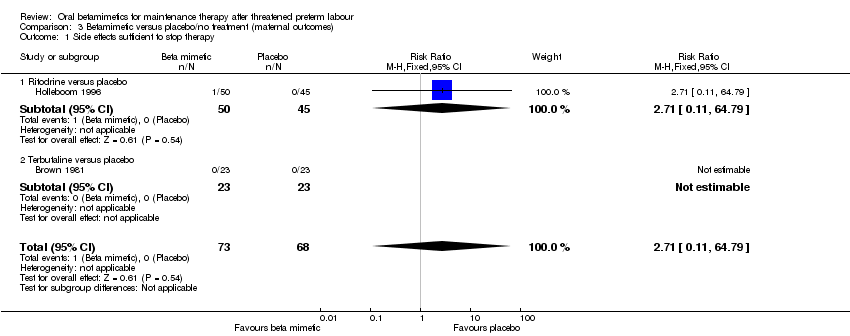
Comparison 3 Betamimetic versus placebo/no treatment (maternal outcomes), Outcome 1 Side effects sufficient to stop therapy.
Figuras y tablas -
Analysis 3.1

Comparison 3 Betamimetic versus placebo/no treatment (maternal outcomes), Outcome 1 Side effects sufficient to stop therapy.

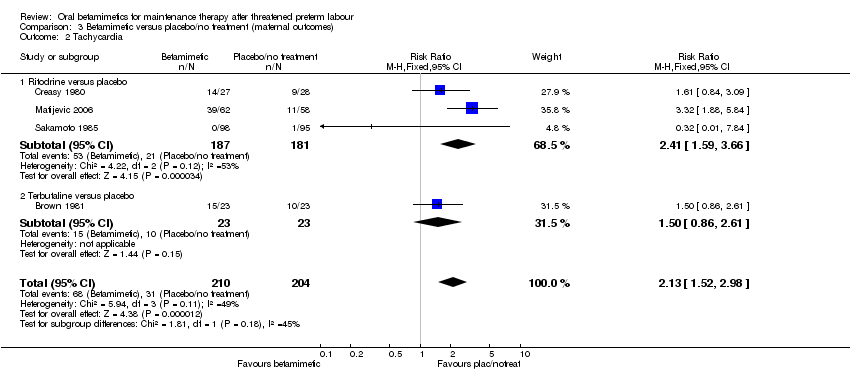
Comparison 3 Betamimetic versus placebo/no treatment (maternal outcomes), Outcome 2 Tachycardia.
Figuras y tablas -
Analysis 3.2

Comparison 3 Betamimetic versus placebo/no treatment (maternal outcomes), Outcome 2 Tachycardia.

Comparison 3 Betamimetic versus placebo/no treatment (maternal outcomes), Outcome 3 Tachypnoea.
Figuras y tablas -
Analysis 3.3

Comparison 3 Betamimetic versus placebo/no treatment (maternal outcomes), Outcome 3 Tachypnoea.

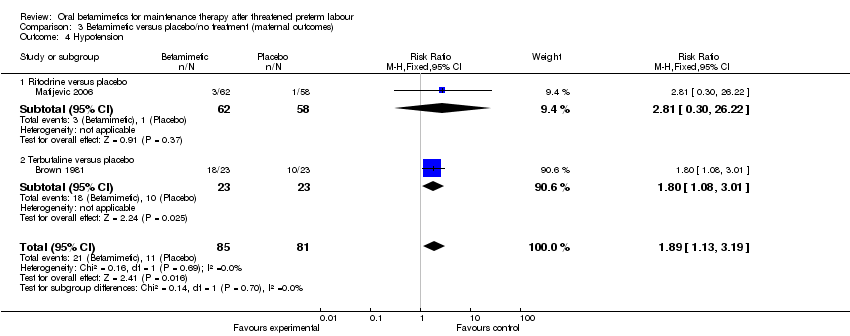
Comparison 3 Betamimetic versus placebo/no treatment (maternal outcomes), Outcome 4 Hypotension.
Figuras y tablas -
Analysis 3.4

Comparison 3 Betamimetic versus placebo/no treatment (maternal outcomes), Outcome 4 Hypotension.

Comparison 3 Betamimetic versus placebo/no treatment (maternal outcomes), Outcome 5 Nausea.
Figuras y tablas -
Analysis 3.5

Comparison 3 Betamimetic versus placebo/no treatment (maternal outcomes), Outcome 5 Nausea.

Comparison 3 Betamimetic versus placebo/no treatment (maternal outcomes), Outcome 6 Vomiting.
Figuras y tablas -
Analysis 3.6

Comparison 3 Betamimetic versus placebo/no treatment (maternal outcomes), Outcome 6 Vomiting.

Comparison 3 Betamimetic versus placebo/no treatment (maternal outcomes), Outcome 7 Palpitations.
Figuras y tablas -
Analysis 3.7

Comparison 3 Betamimetic versus placebo/no treatment (maternal outcomes), Outcome 7 Palpitations.

Comparison 3 Betamimetic versus placebo/no treatment (maternal outcomes), Outcome 8 Headache.
Figuras y tablas -
Analysis 3.8

Comparison 3 Betamimetic versus placebo/no treatment (maternal outcomes), Outcome 8 Headache.

Comparison 4 Betamimetic versus placebo/no treatment (preterm birth and hospital admissions), Outcome 1 Preterm birth within 24 hours.
Figuras y tablas -
Analysis 4.1

Comparison 4 Betamimetic versus placebo/no treatment (preterm birth and hospital admissions), Outcome 1 Preterm birth within 24 hours.

Comparison 4 Betamimetic versus placebo/no treatment (preterm birth and hospital admissions), Outcome 2 Preterm birth within 48 hours.
Figuras y tablas -
Analysis 4.2

Comparison 4 Betamimetic versus placebo/no treatment (preterm birth and hospital admissions), Outcome 2 Preterm birth within 48 hours.

Comparison 4 Betamimetic versus placebo/no treatment (preterm birth and hospital admissions), Outcome 3 Preterm birth within 1 week.
Figuras y tablas -
Analysis 4.3

Comparison 4 Betamimetic versus placebo/no treatment (preterm birth and hospital admissions), Outcome 3 Preterm birth within 1 week.

Comparison 4 Betamimetic versus placebo/no treatment (preterm birth and hospital admissions), Outcome 4 Maternal antenatal readmission to hospital.
Figuras y tablas -
Analysis 4.4

Comparison 4 Betamimetic versus placebo/no treatment (preterm birth and hospital admissions), Outcome 4 Maternal antenatal readmission to hospital.

Comparison 5 Terbutaline versus indomethacin (primary outcomes), Outcome 1 Very preterm birth (< 34 weeks).
Figuras y tablas -
Analysis 5.1

Comparison 5 Terbutaline versus indomethacin (primary outcomes), Outcome 1 Very preterm birth (< 34 weeks).

Comparison 5 Terbutaline versus indomethacin (primary outcomes), Outcome 2 Neonatal mortality.
Figuras y tablas -
Analysis 5.2

Comparison 5 Terbutaline versus indomethacin (primary outcomes), Outcome 2 Neonatal mortality.

Comparison 6 Terbutaline versus indomethacin (infant outcomes), Outcome 1 Birthweight.
Figuras y tablas -
Analysis 6.1

Comparison 6 Terbutaline versus indomethacin (infant outcomes), Outcome 1 Birthweight.

Comparison 6 Terbutaline versus indomethacin (infant outcomes), Outcome 2 Required mechanical ventilation.
Figuras y tablas -
Analysis 6.2

Comparison 6 Terbutaline versus indomethacin (infant outcomes), Outcome 2 Required mechanical ventilation.

Comparison 6 Terbutaline versus indomethacin (infant outcomes), Outcome 3 Days stay in neonatal intensive care unit.
Figuras y tablas -
Analysis 6.3

Comparison 6 Terbutaline versus indomethacin (infant outcomes), Outcome 3 Days stay in neonatal intensive care unit.

Comparison 6 Terbutaline versus indomethacin (infant outcomes), Outcome 4 Intraventricular haemorrhage.
Figuras y tablas -
Analysis 6.4

Comparison 6 Terbutaline versus indomethacin (infant outcomes), Outcome 4 Intraventricular haemorrhage.

Comparison 7 Terbutaline versus indomethacin (maternal outcomes), Outcome 1 Side effects sufficient to stop therapy.
Figuras y tablas -
Analysis 7.1

Comparison 7 Terbutaline versus indomethacin (maternal outcomes), Outcome 1 Side effects sufficient to stop therapy.

Comparison 8 Terbutaline versus indomethacin (preterm birth and hospital admissions), Outcome 1 Preterm birth.
Figuras y tablas -
Analysis 8.1

Comparison 8 Terbutaline versus indomethacin (preterm birth and hospital admissions), Outcome 1 Preterm birth.

Comparison 8 Terbutaline versus indomethacin (preterm birth and hospital admissions), Outcome 2 Maternal antenatal readmission to hospital.
Figuras y tablas -
Analysis 8.2

Comparison 8 Terbutaline versus indomethacin (preterm birth and hospital admissions), Outcome 2 Maternal antenatal readmission to hospital.

Comparison 9 Terbutaline versus ritodrine (primary outcomes), Outcome 1 Very preterm birth (less than 34 weeks).
Figuras y tablas -
Analysis 9.1

Comparison 9 Terbutaline versus ritodrine (primary outcomes), Outcome 1 Very preterm birth (less than 34 weeks).

Comparison 10 Terbutaline versus ritodrine (infant outcomes), Outcome 1 Preterm birth (< 37 weeks).
Figuras y tablas -
Analysis 10.1

Comparison 10 Terbutaline versus ritodrine (infant outcomes), Outcome 1 Preterm birth (< 37 weeks).

Comparison 10 Terbutaline versus ritodrine (infant outcomes), Outcome 2 Mean birthweight.
Figuras y tablas -
Analysis 10.2

Comparison 10 Terbutaline versus ritodrine (infant outcomes), Outcome 2 Mean birthweight.

Comparison 10 Terbutaline versus ritodrine (infant outcomes), Outcome 3 Hyperbilirubinaemia (neonatal jaundice requiring phototherapy).
Figuras y tablas -
Analysis 10.3

Comparison 10 Terbutaline versus ritodrine (infant outcomes), Outcome 3 Hyperbilirubinaemia (neonatal jaundice requiring phototherapy).

Comparison 11 Terbutaline versus ritodrine (maternal outcomes), Outcome 1 Tachycardia.
Figuras y tablas -
Analysis 11.1

Comparison 11 Terbutaline versus ritodrine (maternal outcomes), Outcome 1 Tachycardia.

Comparison 11 Terbutaline versus ritodrine (maternal outcomes), Outcome 2 Tachypnoea.
Figuras y tablas -
Analysis 11.2

Comparison 11 Terbutaline versus ritodrine (maternal outcomes), Outcome 2 Tachypnoea.

Comparison 11 Terbutaline versus ritodrine (maternal outcomes), Outcome 3 Nausea/vomiting.
Figuras y tablas -
Analysis 11.3

Comparison 11 Terbutaline versus ritodrine (maternal outcomes), Outcome 3 Nausea/vomiting.

Comparison 12 Terbutaline versus ritodrine (preterm birth and hospital admissions), Outcome 1 Maternal antenatal readmission to hospital.
Figuras y tablas -
Analysis 12.1

Comparison 12 Terbutaline versus ritodrine (preterm birth and hospital admissions), Outcome 1 Maternal antenatal readmission to hospital.

Comparison 13 Betamimetic versus magnesium (primary outcomes), Outcome 1 Neonatal intensive care unit admission.
Figuras y tablas -
Analysis 13.1

Comparison 13 Betamimetic versus magnesium (primary outcomes), Outcome 1 Neonatal intensive care unit admission.

Comparison 13 Betamimetic versus magnesium (primary outcomes), Outcome 2 Perinatal mortality.
Figuras y tablas -
Analysis 13.2

Comparison 13 Betamimetic versus magnesium (primary outcomes), Outcome 2 Perinatal mortality.

Comparison 14 Betamimetic versus magnesium (infant outcomes), Outcome 1 Preterm birth (< 37 weeks).
Figuras y tablas -
Analysis 14.1

Comparison 14 Betamimetic versus magnesium (infant outcomes), Outcome 1 Preterm birth (< 37 weeks).

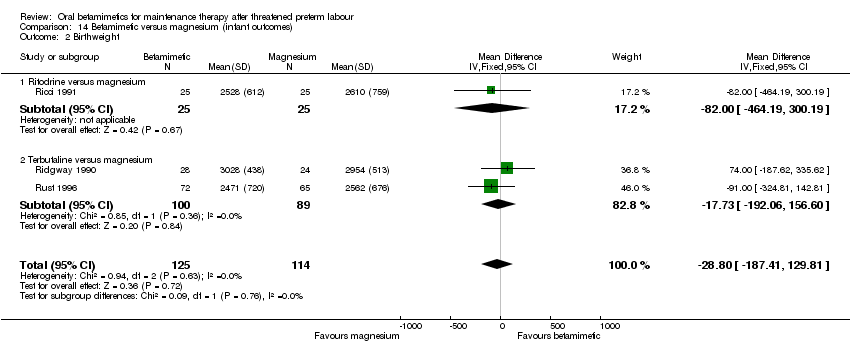
Comparison 14 Betamimetic versus magnesium (infant outcomes), Outcome 2 Birthweight.
Figuras y tablas -
Analysis 14.2

Comparison 14 Betamimetic versus magnesium (infant outcomes), Outcome 2 Birthweight.

Comparison 14 Betamimetic versus magnesium (infant outcomes), Outcome 3 Respiratory distress syndrome.
Figuras y tablas -
Analysis 14.3

Comparison 14 Betamimetic versus magnesium (infant outcomes), Outcome 3 Respiratory distress syndrome.

Comparison 14 Betamimetic versus magnesium (infant outcomes), Outcome 4 Intraventricular haemorrhage.
Figuras y tablas -
Analysis 14.4

Comparison 14 Betamimetic versus magnesium (infant outcomes), Outcome 4 Intraventricular haemorrhage.

Comparison 14 Betamimetic versus magnesium (infant outcomes), Outcome 5 Neonatal jaundice.
Figuras y tablas -
Analysis 14.5

Comparison 14 Betamimetic versus magnesium (infant outcomes), Outcome 5 Neonatal jaundice.

Comparison 15 Betamimetic versus magnesium (maternal outcomes), Outcome 1 Side effects sufficient to stop medication.
Figuras y tablas -
Analysis 15.1

Comparison 15 Betamimetic versus magnesium (maternal outcomes), Outcome 1 Side effects sufficient to stop medication.

Comparison 15 Betamimetic versus magnesium (maternal outcomes), Outcome 2 Tachycardia/palpitations.
Figuras y tablas -
Analysis 15.2

Comparison 15 Betamimetic versus magnesium (maternal outcomes), Outcome 2 Tachycardia/palpitations.

Comparison 15 Betamimetic versus magnesium (maternal outcomes), Outcome 3 Tachypnoea.
Figuras y tablas -
Analysis 15.3

Comparison 15 Betamimetic versus magnesium (maternal outcomes), Outcome 3 Tachypnoea.

Comparison 15 Betamimetic versus magnesium (maternal outcomes), Outcome 4 Nausea.
Figuras y tablas -
Analysis 15.4

Comparison 15 Betamimetic versus magnesium (maternal outcomes), Outcome 4 Nausea.

Comparison 15 Betamimetic versus magnesium (maternal outcomes), Outcome 5 Vomiting.
Figuras y tablas -
Analysis 15.5

Comparison 15 Betamimetic versus magnesium (maternal outcomes), Outcome 5 Vomiting.

Comparison 15 Betamimetic versus magnesium (maternal outcomes), Outcome 6 Chest pain.
Figuras y tablas -
Analysis 15.6

Comparison 15 Betamimetic versus magnesium (maternal outcomes), Outcome 6 Chest pain.

Comparison 16 Betamimetic versus magnesium (preterm birth and hospital admissions), Outcome 1 Maternal antenatal readmission to hospital.
Figuras y tablas -
Analysis 16.1

Comparison 16 Betamimetic versus magnesium (preterm birth and hospital admissions), Outcome 1 Maternal antenatal readmission to hospital.

Comparison 1. Betamimetic versus placebo/no treatment (primary outcomes)

Outcome or subgroup title

No. of studies

No. of participants

Statistical method

Effect size

1 Very preterm birth (Less than 34 weeks' gestation) Show forest plot

1

120

Risk Ratio (M‐H, Fixed, 95% CI)

2.81 [0.30, 26.22]

1.1 Ritodrine versus placebo/no treatment

1

120

Risk Ratio (M‐H, Fixed, 95% CI)

2.81 [0.30, 26.22]

2 Low birthweight (< 2500 grams) Show forest plot

1

140

Risk Ratio (M‐H, Fixed, 95% CI)

0.15 [0.02, 1.25]

2.1 Ritodrine versus placebo/no treatment

1

140

Risk Ratio (M‐H, Fixed, 95% CI)

0.15 [0.02, 1.25]

3 Neonatal intensive care unit admission Show forest plot

2

260

Risk Ratio (M‐H, Fixed, 95% CI)

1.28 [0.68, 2.41]

3.1 Ritodrine versus placebo/no treatment

1

120

Risk Ratio (M‐H, Fixed, 95% CI)

1.25 [0.29, 5.34]

3.2 Terbutaline versus placebo/no treatment

1

140

Risk Ratio (M‐H, Fixed, 95% CI)

1.29 [0.64, 2.60]

4 Perinatal mortality Show forest plot

6

681

Risk Ratio (M‐H, Fixed, 95% CI)

2.41 [0.86, 6.74]

4.1 Ritodrine versus placebo/no treatment

3

214

Risk Ratio (M‐H, Fixed, 95% CI)

1.85 [0.41, 8.39]

4.2 Terbutaline versus placebo/no treatment

3

467

Risk Ratio (M‐H, Fixed, 95% CI)

2.96 [0.72, 12.14]

5 Maternal death or serious maternal morbidity

0

0

Risk Ratio (M‐H, Fixed, 95% CI)

0.0 [0.0, 0.0]

Figuras y tablas -
Comparison 1. Betamimetic versus placebo/no treatment (primary outcomes)
Comparison 2. Betamimetic versus placebo/no treatment (infant outcomes)

Outcome or subgroup title

No. of studies

No. of participants

Statistical method

Effect size

1 Preterm birth (< 37 weeks) Show forest plot

6

644

Risk Ratio (M‐H, Fixed, 95% CI)

1.11 [0.91, 1.35]

1.1 Ritodrine versus placebo/no treatment

4

405

Risk Ratio (M‐H, Fixed, 95% CI)

1.08 [0.75, 1.57]

1.2 Terbutaline versus placebo/no treatment

2

239

Risk Ratio (M‐H, Fixed, 95% CI)

1.12 [0.89, 1.41]

2 Birthweight Show forest plot

7

780

Mean Difference (IV, Fixed, 95% CI)

4.13 [‐91.89, 100.16]

2.1 Ritodrine versus placebo/no treatment

2

110

Mean Difference (IV, Fixed, 95% CI)

‐136.61 [‐395.85, 122.63]

2.2 Terbutaline versus placebo/no treatment

5

670

Mean Difference (IV, Fixed, 95% CI)

26.52 [‐76.87, 129.90]

3 Respiratory distress syndrome Show forest plot

6

770

Risk Ratio (M‐H, Fixed, 95% CI)

1.10 [0.61, 1.98]

3.1 Ritodrine versus placebo/no treatment

3

303

Risk Ratio (M‐H, Fixed, 95% CI)

1.46 [0.57, 3.73]

3.2 Terbutaline versus placebo/no treatment

3

467

Risk Ratio (M‐H, Fixed, 95% CI)

0.93 [0.43, 1.98]

4 Necrotising enterocolitis Show forest plot

2

416

Risk Ratio (M‐H, Fixed, 95% CI)

0.98 [0.22, 4.28]

4.1 Terbutaline versus placebo/no treatment

2

416

Risk Ratio (M‐H, Fixed, 95% CI)

0.98 [0.22, 4.28]

5 Intraventricular haemorrhage Show forest plot

3

466

Risk Ratio (M‐H, Fixed, 95% CI)

0.97 [0.27, 3.58]

5.1 Ritodrine versus placebo/no treatment

1

50

Risk Ratio (M‐H, Fixed, 95% CI)

3.0 [0.13, 70.30]

5.2 Terbutaline versus placebo/no treatment

2

416

Risk Ratio (M‐H, Fixed, 95% CI)

0.72 [0.16, 3.24]

6 Neonatal jaundice Show forest plot

1

50

Risk Ratio (M‐H, Fixed, 95% CI)

1.67 [0.71, 3.89]

6.1 Ritodrine versus no treatment

1

50

Risk Ratio (M‐H, Fixed, 95% CI)

1.67 [0.71, 3.89]

7 Apgar score < 7 at 5 minutes Show forest plot

1

120

Risk Ratio (M‐H, Fixed, 95% CI)

0.23 [0.05, 1.06]

7.1 Ritodrine versus placebo/no treatment

1

120

Risk Ratio (M‐H, Fixed, 95% CI)

0.23 [0.05, 1.06]

8 Need for mechanical ventilation Show forest plot

1

120

Risk Ratio (M‐H, Fixed, 95% CI)

0.94 [0.06, 14.61]

8.1 Ritodrine versus placebo/no treatment

1

120

Risk Ratio (M‐H, Fixed, 95% CI)

0.94 [0.06, 14.61]

Figuras y tablas -
Comparison 2. Betamimetic versus placebo/no treatment (infant outcomes)
Comparison 3. Betamimetic versus placebo/no treatment (maternal outcomes)

Outcome or subgroup title

No. of studies

No. of participants

Statistical method

Effect size

1 Side effects sufficient to stop therapy Show forest plot

2

141

Risk Ratio (M‐H, Fixed, 95% CI)

2.71 [0.11, 64.79]

1.1 Ritodrine versus placebo

1

95

Risk Ratio (M‐H, Fixed, 95% CI)

2.71 [0.11, 64.79]

1.2 Terbutaline versus placebo

1

46

Risk Ratio (M‐H, Fixed, 95% CI)

0.0 [0.0, 0.0]

2 Tachycardia Show forest plot

4

414

Risk Ratio (M‐H, Fixed, 95% CI)

2.13 [1.52, 2.98]

2.1 Ritodrine versus placebo

3

368

Risk Ratio (M‐H, Fixed, 95% CI)

2.41 [1.59, 3.66]

2.2 Terbutaline versus placebo

1

46

Risk Ratio (M‐H, Fixed, 95% CI)

1.5 [0.86, 2.61]

3 Tachypnoea Show forest plot

2

260

Risk Ratio (M‐H, Fixed, 95% CI)

3.52 [1.20, 10.33]

3.1 Ritodrine versus placebo

1

120

Risk Ratio (M‐H, Fixed, 95% CI)

4.21 [0.95, 18.67]

3.2 Terbutaline versus placebo

1

140

Risk Ratio (M‐H, Fixed, 95% CI)

2.83 [0.59, 13.56]

4 Hypotension Show forest plot

2

166

Risk Ratio (M‐H, Fixed, 95% CI)

1.89 [1.13, 3.19]

4.1 Ritodrine versus placebo

1

120

Risk Ratio (M‐H, Fixed, 95% CI)

2.81 [0.30, 26.22]

4.2 Terbutaline versus placebo

1

46

Risk Ratio (M‐H, Fixed, 95% CI)

1.8 [1.08, 3.01]

5 Nausea Show forest plot

2

186

Risk Ratio (M‐H, Fixed, 95% CI)

0.95 [0.43, 2.13]

5.1 Terbutaline versus placebo

2

186

Risk Ratio (M‐H, Fixed, 95% CI)

0.95 [0.43, 2.13]

6 Vomiting Show forest plot

2

235

Risk Ratio (M‐H, Fixed, 95% CI)

1.28 [0.44, 3.70]

6.1 Ritodrine versus placebo

1

95

Risk Ratio (M‐H, Fixed, 95% CI)

2.71 [0.11, 64.79]

6.2 Terbutaline versus placebo

1

140

Risk Ratio (M‐H, Fixed, 95% CI)

1.13 [0.36, 3.54]

7 Palpitations Show forest plot

1

140

Risk Ratio (M‐H, Fixed, 95% CI)

5.67 [1.32, 24.40]

7.1 Terbutaline versus placebo

1

140

Risk Ratio (M‐H, Fixed, 95% CI)

5.67 [1.32, 24.40]

8 Headache Show forest plot

1

95

Risk Ratio (M‐H, Fixed, 95% CI)

2.71 [0.11, 64.79]

8.1 Ritodrine versus placebo/no treatment

1

95

Risk Ratio (M‐H, Fixed, 95% CI)

2.71 [0.11, 64.79]

Figuras y tablas -
Comparison 3. Betamimetic versus placebo/no treatment (maternal outcomes)
Comparison 4. Betamimetic versus placebo/no treatment (preterm birth and hospital admissions)

Outcome or subgroup title

No. of studies

No. of participants

Statistical method

Effect size

1 Preterm birth within 24 hours Show forest plot

1

46

Risk Ratio (M‐H, Fixed, 95% CI)

0.67 [0.12, 3.62]

1.1 Terbutaline versus placebo/no treatment

1

46

Risk Ratio (M‐H, Fixed, 95% CI)

0.67 [0.12, 3.62]

2 Preterm birth within 48 hours Show forest plot

1

200

Risk Ratio (M‐H, Fixed, 95% CI)

0.78 [0.30, 2.01]

2.1 Terbutaline versus placebo/no treatment

1

200

Risk Ratio (M‐H, Fixed, 95% CI)

0.78 [0.30, 2.01]

3 Preterm birth within 1 week Show forest plot

2

295

Risk Ratio (M‐H, Fixed, 95% CI)

0.67 [0.40, 1.13]

3.1 Ritodrine versus placebo

1

95

Risk Ratio (M‐H, Fixed, 95% CI)

0.23 [0.03, 1.94]

3.2 Terbutaline versus placebo

1

200

Risk Ratio (M‐H, Fixed, 95% CI)

0.75 [0.44, 1.29]

4 Maternal antenatal readmission to hospital Show forest plot

4

335

Risk Ratio (M‐H, Fixed, 95% CI)

1.11 [0.76, 1.62]

4.1 Ritodrine versus placebo/no treatment

1

50

Risk Ratio (M‐H, Fixed, 95% CI)

0.86 [0.50, 1.46]

4.2 Terbutaline versus placebo/no treatment

3

285

Risk Ratio (M‐H, Fixed, 95% CI)

1.27 [0.77, 2.10]

Figuras y tablas -
Comparison 4. Betamimetic versus placebo/no treatment (preterm birth and hospital admissions)
Comparison 5. Terbutaline versus indomethacin (primary outcomes)

Outcome or subgroup title

No. of studies

No. of participants

Statistical method

Effect size

1 Very preterm birth (< 34 weeks) Show forest plot

1

65

Risk Ratio (M‐H, Fixed, 95% CI)

0.64 [0.24, 1.76]

2 Neonatal mortality Show forest plot

1

65

Risk Ratio (M‐H, Fixed, 95% CI)

0.0 [0.0, 0.0]

Figuras y tablas -
Comparison 5. Terbutaline versus indomethacin (primary outcomes)
Comparison 6. Terbutaline versus indomethacin (infant outcomes)

Outcome or subgroup title

No. of studies

No. of participants

Statistical method

Effect size

1 Birthweight Show forest plot

1

65

Mean Difference (IV, Fixed, 95% CI)

52.0 [‐202.54, 306.54]

2 Required mechanical ventilation Show forest plot

1

65

Risk Ratio (M‐H, Fixed, 95% CI)

0.34 [0.01, 8.13]

3 Days stay in neonatal intensive care unit Show forest plot

1

65

Mean Difference (IV, Fixed, 95% CI)

‐1.17 [‐2.93, 0.59]

4 Intraventricular haemorrhage Show forest plot

1

65

Risk Ratio (M‐H, Fixed, 95% CI)

0.0 [0.0, 0.0]

Figuras y tablas -
Comparison 6. Terbutaline versus indomethacin (infant outcomes)
Comparison 7. Terbutaline versus indomethacin (maternal outcomes)

Outcome or subgroup title

No. of studies

No. of participants

Statistical method

Effect size

1 Side effects sufficient to stop therapy Show forest plot

1

65

Risk Ratio (M‐H, Fixed, 95% CI)

3.09 [0.13, 73.19]

Figuras y tablas -
Comparison 7. Terbutaline versus indomethacin (maternal outcomes)
Comparison 8. Terbutaline versus indomethacin (preterm birth and hospital admissions)

Outcome or subgroup title

No. of studies

No. of participants

Statistical method

Effect size

1 Preterm birth Show forest plot

1

Risk Ratio (M‐H, Fixed, 95% CI)

Subtotals only

1.1 Within 48 hours

1

65

Risk Ratio (M‐H, Fixed, 95% CI)

0.0 [0.0, 0.0]

1.2 Within 1 week

1

65

Risk Ratio (M‐H, Fixed, 95% CI)

0.26 [0.03, 2.18]

2 Maternal antenatal readmission to hospital Show forest plot

1

65

Risk Ratio (M‐H, Fixed, 95% CI)

0.60 [0.34, 1.05]

Figuras y tablas -
Comparison 8. Terbutaline versus indomethacin (preterm birth and hospital admissions)
Comparison 9. Terbutaline versus ritodrine (primary outcomes)

Outcome or subgroup title

No. of studies

No. of participants

Statistical method

Effect size

1 Very preterm birth (less than 34 weeks) Show forest plot

1

91

Risk Ratio (M‐H, Fixed, 95% CI)

0.29 [0.01, 6.86]

Figuras y tablas -
Comparison 9. Terbutaline versus ritodrine (primary outcomes)
Comparison 10. Terbutaline versus ritodrine (infant outcomes)

Outcome or subgroup title

No. of studies

No. of participants

Statistical method

Effect size

1 Preterm birth (< 37 weeks) Show forest plot

1

91

Risk Ratio (M‐H, Fixed, 95% CI)

0.8 [0.44, 1.46]

2 Mean birthweight Show forest plot

1

91

Mean Difference (IV, Fixed, 95% CI)

38.30 [‐210.97, 287.57]

3 Hyperbilirubinaemia (neonatal jaundice requiring phototherapy) Show forest plot

1

91

Risk Ratio (M‐H, Fixed, 95% CI)

1.45 [0.84, 2.51]

Figuras y tablas -
Comparison 10. Terbutaline versus ritodrine (infant outcomes)
Comparison 11. Terbutaline versus ritodrine (maternal outcomes)

Outcome or subgroup title

No. of studies

No. of participants

Statistical method

Effect size

1 Tachycardia Show forest plot

1

91

Risk Ratio (M‐H, Fixed, 95% CI)

0.57 [0.22, 1.47]

2 Tachypnoea Show forest plot

1

91

Risk Ratio (M‐H, Fixed, 95% CI)

2.57 [0.55, 12.07]

3 Nausea/vomiting Show forest plot

1

91

Risk Ratio (M‐H, Fixed, 95% CI)

0.57 [0.17, 1.89]

Figuras y tablas -
Comparison 11. Terbutaline versus ritodrine (maternal outcomes)
Comparison 12. Terbutaline versus ritodrine (preterm birth and hospital admissions)

Outcome or subgroup title

No. of studies

No. of participants

Statistical method

Effect size

1 Maternal antenatal readmission to hospital Show forest plot

1

91

Risk Ratio (M‐H, Fixed, 95% CI)

1.71 [0.56, 5.29]

Figuras y tablas -
Comparison 12. Terbutaline versus ritodrine (preterm birth and hospital admissions)
Comparison 13. Betamimetic versus magnesium (primary outcomes)

Outcome or subgroup title

No. of studies

No. of participants

Statistical method

Effect size

1 Neonatal intensive care unit admission Show forest plot

1

137

Risk Ratio (M‐H, Fixed, 95% CI)

0.80 [0.43, 1.46]

1.1 Terbutaline versus magnesium

1

137

Risk Ratio (M‐H, Fixed, 95% CI)

0.80 [0.43, 1.46]

2 Perinatal mortality Show forest plot

1

50

Risk Ratio (M‐H, Fixed, 95% CI)

0.2 [0.01, 3.97]

2.1 Ritodrine versus magnesium

1

50

Risk Ratio (M‐H, Fixed, 95% CI)

0.2 [0.01, 3.97]

Figuras y tablas -
Comparison 13. Betamimetic versus magnesium (primary outcomes)
Comparison 14. Betamimetic versus magnesium (infant outcomes)

Outcome or subgroup title

No. of studies

No. of participants

Statistical method

Effect size

1 Preterm birth (< 37 weeks) Show forest plot

2

100

Risk Ratio (M‐H, Fixed, 95% CI)

1.02 [0.58, 1.79]

1.1 Ritodrine versus magnesium

1

50

Risk Ratio (M‐H, Fixed, 95% CI)

1.0 [0.54, 1.87]

1.2 Terbutaline versus magnesium

1

50

Risk Ratio (M‐H, Fixed, 95% CI)

1.06 [0.32, 3.50]

2 Birthweight Show forest plot

3

239

Mean Difference (IV, Fixed, 95% CI)

‐28.80 [‐187.41, 129.81]

2.1 Ritodrine versus magnesium

1

50

Mean Difference (IV, Fixed, 95% CI)

‐82.0 [‐464.19, 300.19]

2.2 Terbutaline versus magnesium

2

189

Mean Difference (IV, Fixed, 95% CI)

‐17.73 [‐192.06, 156.60]

3 Respiratory distress syndrome Show forest plot

1

50

Risk Ratio (M‐H, Fixed, 95% CI)

2.0 [0.19, 20.67]

3.1 Ritodrine versus magnesium

1

50

Risk Ratio (M‐H, Fixed, 95% CI)

2.0 [0.19, 20.67]

4 Intraventricular haemorrhage Show forest plot

1

50

Risk Ratio (M‐H, Fixed, 95% CI)

1.0 [0.07, 15.12]

4.1 Ritodrine versus magnesium

1

50

Risk Ratio (M‐H, Fixed, 95% CI)

1.0 [0.07, 15.12]

5 Neonatal jaundice Show forest plot

1

50

Risk Ratio (M‐H, Fixed, 95% CI)

0.91 [0.47, 1.75]

5.1 Ritodrine versus magnesium

1

50

Risk Ratio (M‐H, Fixed, 95% CI)

0.91 [0.47, 1.75]

Figuras y tablas -
Comparison 14. Betamimetic versus magnesium (infant outcomes)
Comparison 15. Betamimetic versus magnesium (maternal outcomes)

Outcome or subgroup title

No. of studies

No. of participants

Statistical method

Effect size

1 Side effects sufficient to stop medication Show forest plot

2

100

Risk Ratio (M‐H, Fixed, 95% CI)

0.90 [0.24, 3.46]

1.1 Ritodrine versus magnesium

1

50

Risk Ratio (M‐H, Fixed, 95% CI)

0.5 [0.05, 5.17]

1.2 Terbutaline versus magnesium

1

50

Risk Ratio (M‐H, Fixed, 95% CI)

1.28 [0.23, 7.00]

2 Tachycardia/palpitations Show forest plot

3

237

Risk Ratio (M‐H, Fixed, 95% CI)

5.61 [2.41, 13.04]

2.1 Ritodrine versus magnesium

1

50

Risk Ratio (M‐H, Fixed, 95% CI)

17.0 [1.03, 279.53]

2.2 Terbutaline versus magnesium

2

187

Risk Ratio (M‐H, Fixed, 95% CI)

4.54 [1.86, 11.07]

3 Tachypnoea Show forest plot

1

137

Risk Ratio (M‐H, Fixed, 95% CI)

1.35 [0.40, 4.59]

3.1 Terbutaline versus magnesium

1

137

Risk Ratio (M‐H, Fixed, 95% CI)

1.35 [0.40, 4.59]

4 Nausea Show forest plot

3

237

Risk Ratio (M‐H, Fixed, 95% CI)

1.07 [0.57, 1.98]

4.1 Ritodrine versus magnesium

1

50

Risk Ratio (M‐H, Fixed, 95% CI)

0.5 [0.05, 5.17]

4.2 Terbutaline versus magnesium

2

187

Risk Ratio (M‐H, Fixed, 95% CI)

1.15 [0.60, 2.19]

5 Vomiting Show forest plot

3

237

Risk Ratio (M‐H, Fixed, 95% CI)

0.88 [0.39, 1.98]

5.1 Ritodrine versus magnesium

1

50

Risk Ratio (M‐H, Fixed, 95% CI)

0.0 [0.0, 0.0]

5.2 Terbutaline versus magnesium

2

187

Risk Ratio (M‐H, Fixed, 95% CI)

0.88 [0.39, 1.98]

6 Chest pain Show forest plot

1

50

Risk Ratio (M‐H, Fixed, 95% CI)

0.0 [0.0, 0.0]

6.1 Ritodrine versus magnesium

1

50

Risk Ratio (M‐H, Fixed, 95% CI)

0.0 [0.0, 0.0]

Figuras y tablas -
Comparison 15. Betamimetic versus magnesium (maternal outcomes)
Comparison 16. Betamimetic versus magnesium (preterm birth and hospital admissions)

Outcome or subgroup title

No. of studies

No. of participants

Statistical method

Effect size

1 Maternal antenatal readmission to hospital Show forest plot

1

50

Risk Ratio (M‐H, Fixed, 95% CI)

1.09 [0.60, 1.99]

1.1 Ritodrine versus magnesium

1

50

Risk Ratio (M‐H, Fixed, 95% CI)

1.09 [0.60, 1.99]

Figuras y tablas -
Comparison 16. Betamimetic versus magnesium (preterm birth and hospital admissions)