Betamiméticos orales para el tratamiento de mantenimiento después de la amenaza de parto prematuro
Referencias
References to studies included in this review
References to studies excluded from this review
References to studies awaiting assessment
Additional references
References to other published versions of this review
Characteristics of studies
Characteristics of included studies [ordered by study ID]
| Methods | RCT. Randomisation by using a list from a random number table. | |
| Participants | 71 women with successful tocolysis (for at least 12 hours) after treatment with magnesium sulphate who met the following inclusion criteria: 26‐32 weeks' gestation; single, live uterine pregnancy; preterm labour (at least 4 contractions in 20 minutes and progressive cervical change OR single examination with cervix at least 2 cm dilated or at least 80% effaced); amniotic membranes intact. | |
| Interventions | After successful tocolysis with IV magnesium sulphate women were randomised to receive either oral indomethacin 25 mg every 6 hours or terbutaline sulphate 5 mg every 4 hours. | |
| Outcomes | Birth < 34 weeks, mean birthweight, mean length of stay in NICU, neonatal death, mean Apgar score at 5 min, baby requiring mechanical ventilation, intraventricular haemorrhage, side effects sufficient to cease medication, preterm birth within 48 hours, preterm birth within 1 week. | |
| Notes | 2 women in the terbutaline group stopped their medication, but their outcome data were included in the analysis. | |
| Risk of bias | ||
| Bias | Authors' judgement | Support for judgement |
| Random sequence generation (selection bias) | Low risk | Random number table. |
| Allocation concealment (selection bias) | Unclear risk | Not stated. |
| Blinding (performance bias and detection bias) | Unclear risk | Not stated. |
| Incomplete outcome data (attrition bias) | Low risk | 8.4% losses to follow‐up. |
| Selective reporting (reporting bias) | Unclear risk | Unable to assess. |
| Other bias | Low risk | |
| Methods | RCT. Randomisation was by the chief pharmacist 'randomly assigning' the participants to treatment groups. | |
| Participants | 51 women who met the following inclusion criteria: premature labour between 24 and 36 weeks of gestation, painful regular uterine contractions at intervals of < 5 min. | |
| Interventions | All women received ethanol IV for 12 hours and compazine. 2 hours before the ethanol dose ended, women were randomised to receive terbutaline sulphate 5 mg or placebo orally. Treatment was continued every 6 hours until the 38th week of gestation. Terbutaline = 20 mg/day. | |
| Outcomes | Mean birthweight, respiratory distress syndrome, perinatal death, tachycardia, low blood pressure, nausea. | |
| Notes | 2 twin pregnancies in the terbutaline group and 3 twin pregnancies in the placebo group. | |
| Risk of bias | ||
| Bias | Authors' judgement | Support for judgement |
| Random sequence generation (selection bias) | Unclear risk | Pharmacist "Randomly assigning participants to treatment groups". |
| Allocation concealment (selection bias) | Low risk | Allocation through pharmacy. |
| Blinding (performance bias and detection bias) | Low risk | Women and medical attendants blinded. |
| Incomplete outcome data (attrition bias) | Low risk | 9.8% losses to follow‐up. |
| Selective reporting (reporting bias) | Unclear risk | Unable to assess. |
| Other bias | Low risk | |
| Methods | RCT (method of randomisation unclear). Authors claim double blinding was present throughout the trial. | |
| Participants | 55 women who had been successfully treated with IM ritodrine and met the inclusion criteria. | |
| Interventions | All women received bedrest, monitoring and IM ritodrine. If uterine activity was then controlled, the women were given ritodrine tablets (10 to 20 mg every 3 to 4 hours) or placebo until 37 to 38 weeks' gestation. Ritodrine = 30‐80 mg/day. | |
| Outcomes | Mean birthweight, mean Apgar score at 5 min, preterm birth within 24 hours, preterm birth within 1 week, palpitations and flushing, perinatal death. | |
| Notes | 1 twin gestation in the ritodrine group and 4 twin gestations in the placebo group. | |
| Risk of bias | ||
| Bias | Authors' judgement | Support for judgement |
| Random sequence generation (selection bias) | Unclear risk | Not stated. |
| Allocation concealment (selection bias) | Unclear risk | Not stated. |
| Blinding (performance bias and detection bias) | Low risk | Stated to be "Double blinded". |
| Incomplete outcome data (attrition bias) | High risk | 21.4% losses to follow‐up. |
| Selective reporting (reporting bias) | Unclear risk | Unable to assess. |
| Other bias | Low risk | |
| Methods | RCT (multicentre). | |
| Participants | 95 women who met the following inclusion criteria: participated in a randomised comparison of 2 schedules of intravenous ritodrine administration (described elsewhere) where the arrest of active preterm labour occurred. | |
| Interventions | At the start of maintenance treatment, all women had been on an intravenous dose of 50 microg/min ritodrine for 12 to 24 hours following successful arrest of contractions. Maintenance therapy consisted of 2 40 mg ritodrine sustained released capsules or 2 identical placebo capsules 3 times per day for 7 days. Ritodrine = 240 mg/day. | |
| Outcomes | Perinatal death, birth at < 37 weeks, side‐effects sufficient to stop medication, vomiting, preterm birth within 1 week. | |
| Notes | 7 twin pregnancies and 1 triplet pregnancy in the ritodrine group; no multiple pregnancies in the placebo group. | |
| Risk of bias | ||
| Bias | Authors' judgement | Support for judgement |
| Random sequence generation (selection bias) | Low risk | Medication was distributed in pharmacy coded drug boxes. |
| Allocation concealment (selection bias) | Low risk | Allocation through pharmacy. |
| Blinding (performance bias and detection bias) | Low risk | Women blinded to treatment (use of placebo capsule). |
| Incomplete outcome data (attrition bias) | Low risk | 1% loss to follow‐up. |
| Selective reporting (reporting bias) | Unclear risk | Unable to assess. |
| Other bias | Low risk | |
| Methods | RCT. Randomisation was by sealed envelopes, generated from a table of random numbers. | |
| Participants | 212 women who met the following inclusion criteria: between 24 and 35 completed weeks of gestation, with at least one of the following: persistent uterine contractions (at least 6 contractions per hour), progressive cervical dilatation and/or effacement, dilatation at least 2 cm and 50% effacement on the initial cervical examination in the presence of uterine contractions. | |
| Interventions | All women were treated with intramuscular betamethasone and intravenous magnesium sulphate until uterine quiescence was achieved for 12‐24 hours, then treated with oral terbutaline for 24‐48 hours. The women were randomised to either terbutaline or bed rest and then divided into 4 groups: | |
| Outcomes | Neonatal death, respiratory distress syndrome, intraventricular haemorrhage, maternal readmission to hospital. | |
| Notes | 166 singleton gestations and 18 multiple gestations (11 twin pregnancies in the terbutaline group and 6 twin and 1 triplet pregnancy in the bed rest group). | |
| Risk of bias | ||
| Bias | Authors' judgement | Support for judgement |
| Random sequence generation (selection bias) | Low risk | Random number table. |
| Allocation concealment (selection bias) | Low risk | Sealed envelopes. |
| Blinding (performance bias and detection bias) | Unclear risk | Not stated (although blinding of women randomised to bed rest not possible). |
| Incomplete outcome data (attrition bias) | Low risk | 13% loss to follow‐up. |
| Selective reporting (reporting bias) | Unclear risk | Unable to assess. |
| Other bias | Low risk | |
| Methods | RCT. Randomisation from a random number table via sealed envelopes. | |
| Participants | 113 women who met the following inclusion criteria: singleton pregnancy; gestational age 20‐35 weeks; irregular uterine contractions with clear evidence of cervical dilatation and effacement; persistent, regular uterine contractions (min frequency 8/hr) with or without cervical change. | |
| Interventions | Parenteral tocolysis was given to all women (subcutaneous terbutaline and intravenous ritodrine) then women were randomly assigned to maintenance therapy with oral terbutaline (begun at 2.5 mg every 2 hours for 24 hours, then adjusted to 5 mg every 4 hours) or ritodrine (begun at 10 mg every 2 hours for 24 hours then adjusted to 20 mg every 4 hours). Terbutaline = 30 mg/day, ritodrine = 120 mg/ day. | |
| Outcomes | Mean birthweight, perinatal deaths, hyperbilirubinaemia, tachycardia, tachypnoea, nausea/vomiting, antenatal readmission. | |
| Notes | 1 woman in each group was switched to the alternate drug because of intolerable side effects. In addition, there were 6 noncompliant women ‐ 4 from the ritodrine group and 2 from the terbutaline group. 2 of the 6 women chose to give birth elsewhere and the remaining 4 elected not to continue their medication because of side effects. | |
| Risk of bias | ||
| Bias | Authors' judgement | Support for judgement |
| Random sequence generation (selection bias) | Low risk | Random number table. |
| Allocation concealment (selection bias) | Low risk | Sealed envelopes. |
| Blinding (performance bias and detection bias) | Unclear risk | Not stated. |
| Incomplete outcome data (attrition bias) | Low risk | 19% loss to follow‐up. |
| Selective reporting (reporting bias) | Unclear risk | Unable to assess. |
| Other bias | Low risk | |
| Methods | RCT. Randomisation was by a computer‐generated table of random numbers. | |
| Participants | 203 women who met the following inclusion criteria: admitted to the labour and delivery suite between December 1990 and June 1995 with the diagnosis of preterm labour (regular uterine contractions and documented cervical change). Women had been successfully treated with parenteral tocolysis. | |
| Interventions | Following successful parenteral tocolysis, women were randomly assigned to terbutaline (5 mg 5 times per day) or placebo. Terbutaline = 25 mg/day. | |
| Outcomes | Perinatal death, respiratory distress syndrome, intraventricular haemorrhage, mean birthweight, birth within 48 hours, birth within 1 week. | |
| Notes | 3 twin pregnancies in each of the terbutaline and placebo groups. | |
| Risk of bias | ||
| Bias | Authors' judgement | Support for judgement |
| Random sequence generation (selection bias) | Low risk | Computer‐generated random number table. |
| Allocation concealment (selection bias) | Unclear risk | Not stated. |
| Blinding (performance bias and detection bias) | Low risk | Women were blinded through the use of a placebo. |
| Incomplete outcome data (attrition bias) | Low risk | 1.5% loss to follow‐up. |
| Selective reporting (reporting bias) | Unclear risk | Unable to assess. |
| Other bias | Low risk | |
| Methods | Randomisation was by a computer‐generated table of random numbers. Allocation concealment through sealed opaque envelopes. | |
| Participants | 120 women who met the following inclusion criteria: singleton pregnancy; gestational age 24‐34 weeks; > 5 contractions per hour for 2 hours; modified bishop score > 3. | |
| Interventions | Following successful parenteral tocolysis, women were randomly assigned to ritodrine (80 mg 3 times per day) or placebo. | |
| Outcomes | Preterm birth < 34 weeks; preterm birth < 37 weeks; preterm birth in 72 hours; infant birthweight; perinatal mortality; NICU admission; Apgar score < 7 at 5 minutes; mechanical ventilation; maternal side effects (pulmonary oedema, tremor, tachycardia, shortness of breath). | |
| Notes | ||
| Risk of bias | ||
| Bias | Authors' judgement | Support for judgement |
| Random sequence generation (selection bias) | Low risk | Computer‐generated random number table. |
| Allocation concealment (selection bias) | Low risk | Sealed opaque envelopes. |
| Blinding (performance bias and detection bias) | Unclear risk | Not stated. |
| Incomplete outcome data (attrition bias) | Low risk | No reported losses to follow‐up. |
| Selective reporting (reporting bias) | Unclear risk | Unable to assess. |
| Other bias | Low risk | |
| Methods | RCT. Randomisation was based on a computer‐generated number table with use of opaque sealed envelopes. | |
| Participants | 55 women who met the following inclusion criteria: admitted for preterm labour between 28 and 35 weeks' gestation with the following cervical changes: at least 1 cm decrease in length and 1 cm increase in dilation; at least 1 cm increase in dilation if the cervix is already completely effaced; at least 2 cm decrease in length without dilation; or at least 2 cm increase in dilation at the internal os without effacement. Labour was successfully arrested with magnesium sulphate. | |
| Interventions | Intravenous magnesium sulphate was continued for 12 hours after the uterine contractions ceased. Women were then randomised to receive either no treatment or oral terbutaline (dose unspecified) (the first dose of which was given 30 minutes before the discontinuation of IV magnesium sulphate). | |
| Outcomes | Mean birthweight, preterm birth (< 37 weeks). | |
| Notes | 5 twin pregnancies in the terbutaline group and 3 twin pregnancies in the no treatment group. | |
| Risk of bias | ||
| Bias | Authors' judgement | Support for judgement |
| Random sequence generation (selection bias) | Low risk | Computer‐generated random number table. |
| Allocation concealment (selection bias) | Low risk | Sealed opaque envelopes. |
| Blinding (performance bias and detection bias) | Unclear risk | Not stated. |
| Incomplete outcome data (attrition bias) | Unclear risk | Not stated; do not appear to be any losses to follow‐up. |
| Selective reporting (reporting bias) | Unclear risk | Unable to assess. |
| Other bias | Low risk | |
| Methods | RCT. | |
| Participants | 75 women who met the following inclusion criteria: admitted with a diagnosis of preterm labour (initial pelvic exam of 2 cm dilatation in conjunction with 2 or more contractions per 10 minutes of at least 30 seconds' duration or a change in cervical examination detected by the same examiner over a 1‐hour period of at least 30 seconds' duration). | |
| Interventions | All women were given IV magnesium sulphate and randomised to 1 of 3 groups following a 12‐hour contraction‐free period. | |
| Outcomes | Preterm birth (< 36 weeks), headache, tachycardia, nausea, vomiting, chest pain. | |
| Notes | ||
| Risk of bias | ||
| Bias | Authors' judgement | Support for judgement |
| Random sequence generation (selection bias) | Unclear risk | Not stated. |
| Allocation concealment (selection bias) | Low risk | Sealed envelopes. |
| Blinding (performance bias and detection bias) | Low risk | Blinding of some physician visits. |
| Incomplete outcome data (attrition bias) | Unclear risk | Not stated. |
| Selective reporting (reporting bias) | Unclear risk | Unable to assess. |
| Other bias | Low risk | |
| Methods | RCT. | |
| Participants | 60 women who met the following inclusion criteria: preterm labour successfully arrested with parenteral treatment. Preterm labour is defined as: gestational age between 25 and 35 weeks, 3 contractions in 20 minutes that persisted despite IV hydration, or any cervical change. | |
| Interventions | Once there had been uterine quiescence for 12 to 24 hours, the women were allocated to 2 groups. Group 1: magnesium oxide 200 mg orally every 3‐4 hours. Group 2: 2.5‐5 mg of terbutaline sulphate orally every 3‐4 hours. Terbutaline = 15‐40 mg/ day. | |
| Outcomes | Mean birthweight, birth at < 36 weeks, tachypnoea, nausea, vomiting. | |
| Notes | One set of twins in each group. | |
| Risk of bias | ||
| Bias | Authors' judgement | Support for judgement |
| Random sequence generation (selection bias) | Unclear risk | Not stated. |
| Allocation concealment (selection bias) | Unclear risk | Not stated. |
| Blinding (performance bias and detection bias) | Unclear risk | Not stated. |
| Incomplete outcome data (attrition bias) | Low risk | 16.7% loss to follow‐up. |
| Selective reporting (reporting bias) | Unclear risk | Unable to assess. |
| Other bias | Low risk | |
| Methods | RCT. | |
| Participants | 248 women who met the following inclusion criteria: preterm labour (defined by gestational age 24‐34 weeks, regular contractions of > 4 per hour, documented cervical change on serial digital exams, intact membranes and absence of any medical or obstetric complications requiring delivery); arrest of preterm labour with parenteral tocolysis; uterine quiescence documented by tocodymometry; absence of further cervical change. | |
| Interventions | Following arrest of preterm labour with parenteral tocolysis the women were randomised to 1 of 3 groups: oral magnesium chloride (128 mg every 4 hours) ‐ 65 women, 69 infants; oral terbutaline sulphate (5 mg every 4 h) ‐ 72 women, 82 infants; placebo‐68 women, 71 infants. Terbutaline = 30 mg/ day. | |
| Outcomes | NICU, tachypnoea, nausea, vomiting, mean birthweight. | |
| Notes | Some results reported as being adjusted to account for multiple gestation (but no further details provided). | |
| Risk of bias | ||
| Bias | Authors' judgement | Support for judgement |
| Random sequence generation (selection bias) | Low risk | Computer‐generated random number table. |
| Allocation concealment (selection bias) | Low risk | Medication distributed through pharmacy. |
| Blinding (performance bias and detection bias) | Low risk | Women and caregivers blinded. |
| Incomplete outcome data (attrition bias) | Low risk | 17.3% loss to follow‐up. |
| Selective reporting (reporting bias) | Unclear risk | Unable to assess. |
| Other bias | Low risk | |
| Methods | Randomisation: "allocation of drugs carried out at random by the controlled with 2 subjects from each group for a total of 6 subjects per 1 set". | |
| Participants | 291 women who met the following inclusion criteria: preterm labour (defined by gestational age 24‐37 weeks, diagnosis of labour, dilation cervix < 3.5 cm and < 80% effacement); arrest of preterm labour with parenteral tocolysis. | |
| Interventions | Following arrest of preterm labour with parenteral tocolysis the women were randomised to 1 of 3 groups: oral ritodrine (15 mg daily) ‐ 98 women; oral medroxyprogesterone acetate (15 mg daily) ‐ 98 women (not included in this review); placebo ‐ 95 women. | |
| Outcomes | Preterm birth < 37 weeks; infant birthweight < 2500 grams; respiratory distress syndrome; maternal tachycardia, nausea. | |
| Notes | Comparison with medroxyprogesterone acetate not included in this review. | |
| Risk of bias | ||
| Bias | Authors' judgement | Support for judgement |
| Random sequence generation (selection bias) | Unclear risk | "allocation of drugs carried out at random by the controlled with 2 subjects from each group for a total of 6 subjects per 1 set." |
| Allocation concealment (selection bias) | Low risk | Medication distributed by pharmacy. |
| Blinding (performance bias and detection bias) | Low risk | Women and caregivers through use of placebo. |
| Incomplete outcome data (attrition bias) | Low risk | 7.7% loss to follow‐up. |
| Selective reporting (reporting bias) | Unclear risk | Unable to assess. |
| Other bias | Low risk | |
h: hour
IM: intramuscular
IUGR: intrauterine growth restriction
IV: intravenous
min: minute
NICU: neonatal intensive care unit
RCT: randomised controlled trial
ROM: rupture of membranes
w: weeks
Characteristics of excluded studies [ordered by study ID]
| Study | Reason for exclusion |
| The intervention is the use of IV, not oral, tocolytic therapy. | |
| The trial compared IV and oral ritodrine to oral indomethacin. | |
| The women in this study were randomised to oral betamimetics for treatment of an initial episode of threatened preterm labour not for maintenance therapy. | |
| Study compared 2 betamimetic agents (terbutaline and ritodrine) given intravenously rather than orally. | |
| The women in this study were randomised to oral betamimetics for treatment of an initial episode of threatened preterm labour not for maintenance therapy. | |
| Arrest of premature labour was randomised, but use of oral ritodrine as maintenance therapy was not. | |
| The trial compares 2 formulations of the same betamimetic tocolytic (ritodrine), rather than comparing a betamimetic with an alternative therapy. | |
| The trial compared IV and oral terbutaline to IV and oral placebo. | |
| The study assessed the effect of IM ritodrine on the arrest of premature labour, as well as the effect of oral ritodrine as maintenance therapy. The women had thus received "other treatment" in addition to the oral betamimetic. | |
| The population studied are women with premature rupture of membranes, not preterm labour. | |
| The women in this study were randomised to the ritodrine and magnesium gluconate groups according to attending staff preference. Thus it is not a RCT. | |
| Outcomes reported by the study were not those specified in the review protocol. | |
| The women in this study were randomised to oral betamimetics for treatment of an initial episode of threatened preterm labour not for maintenance therapy. | |
| The study assessed the effect of IV and IM ritodrine as well as the effect of oral ritodrine as maintenance therapy. | |
| The trial compared IV and oral ritodrine to IV and oral placebo. | |
| The women in this study were randomised to oral betamimetics for treatment of an initial episode of threatened preterm labour not for maintenance therapy. | |
| The women in this study were randomised to oral betamimetics for treatment of an initial episode of threatened preterm labour not for maintenance therapy. |
IM: intramuscular
IV: intravenous
RCT: randomised controlled trial
Characteristics of studies awaiting assessment [ordered by study ID]
| Methods | Stated that women were "randomly divided into two groups". |
| Participants | Women presenting with preterm labour whose contractions were controlled with parenteral ritodrine. |
| Interventions | Oral ritodrine versus no treatment. |
| Outcomes | Prolongation of pregnancy. |
| Notes | No results presented in abstract; awaiting full translation of manuscript. |
| Methods | Stated to be a "randomized controlled trial". |
| Participants | Women between 28 and 34 weeks' gestation presenting with preterm uterine contractions who have been successfully treated with parenteral terbutaline. |
| Interventions | Oral terbutaline (2.5 mg 4 times daily) versus no treatment. |
| Outcomes | Recurrence preterm labour; prolongation of pregnancy; birthweight; preterm birth; 5‐minute Apgar score; congenital anomaly. |
| Notes | Abstract only; recurrent preterm labour presented as percentage only; no other results presented. |
Data and analyses
| Outcome or subgroup title | No. of studies | No. of participants | Statistical method | Effect size |
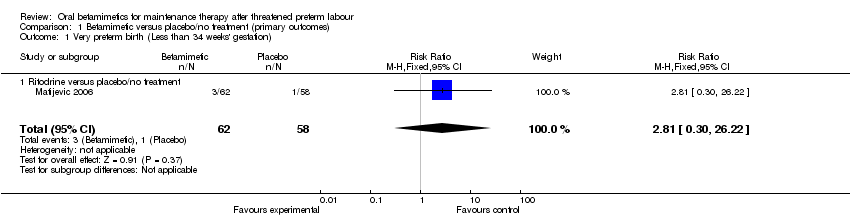
| 1 Very preterm birth (Less than 34 weeks' gestation) Show forest plot | 1 | 120 | Risk Ratio (M‐H, Fixed, 95% CI) | 2.81 [0.30, 26.22] |
| Analysis 1.1  Comparison 1 Betamimetic versus placebo/no treatment (primary outcomes), Outcome 1 Very preterm birth (Less than 34 weeks' gestation). | ||||
| 1.1 Ritodrine versus placebo/no treatment | 1 | 120 | Risk Ratio (M‐H, Fixed, 95% CI) | 2.81 [0.30, 26.22] |
| 2 Low birthweight (< 2500 grams) Show forest plot | 1 | 140 | Risk Ratio (M‐H, Fixed, 95% CI) | 0.15 [0.02, 1.25] |
| Analysis 1.2  Comparison 1 Betamimetic versus placebo/no treatment (primary outcomes), Outcome 2 Low birthweight (< 2500 grams). | ||||
| 2.1 Ritodrine versus placebo/no treatment | 1 | 140 | Risk Ratio (M‐H, Fixed, 95% CI) | 0.15 [0.02, 1.25] |
| 3 Neonatal intensive care unit admission Show forest plot | 2 | 260 | Risk Ratio (M‐H, Fixed, 95% CI) | 1.28 [0.68, 2.41] |
| Analysis 1.3  Comparison 1 Betamimetic versus placebo/no treatment (primary outcomes), Outcome 3 Neonatal intensive care unit admission. | ||||
| 3.1 Ritodrine versus placebo/no treatment | 1 | 120 | Risk Ratio (M‐H, Fixed, 95% CI) | 1.25 [0.29, 5.34] |
| 3.2 Terbutaline versus placebo/no treatment | 1 | 140 | Risk Ratio (M‐H, Fixed, 95% CI) | 1.29 [0.64, 2.60] |
| 4 Perinatal mortality Show forest plot | 6 | 681 | Risk Ratio (M‐H, Fixed, 95% CI) | 2.41 [0.86, 6.74] |
| Analysis 1.4  Comparison 1 Betamimetic versus placebo/no treatment (primary outcomes), Outcome 4 Perinatal mortality. | ||||
| 4.1 Ritodrine versus placebo/no treatment | 3 | 214 | Risk Ratio (M‐H, Fixed, 95% CI) | 1.85 [0.41, 8.39] |
| 4.2 Terbutaline versus placebo/no treatment | 3 | 467 | Risk Ratio (M‐H, Fixed, 95% CI) | 2.96 [0.72, 12.14] |
| 5 Maternal death or serious maternal morbidity | 0 | 0 | Risk Ratio (M‐H, Fixed, 95% CI) | 0.0 [0.0, 0.0] |
| Outcome or subgroup title | No. of studies | No. of participants | Statistical method | Effect size |
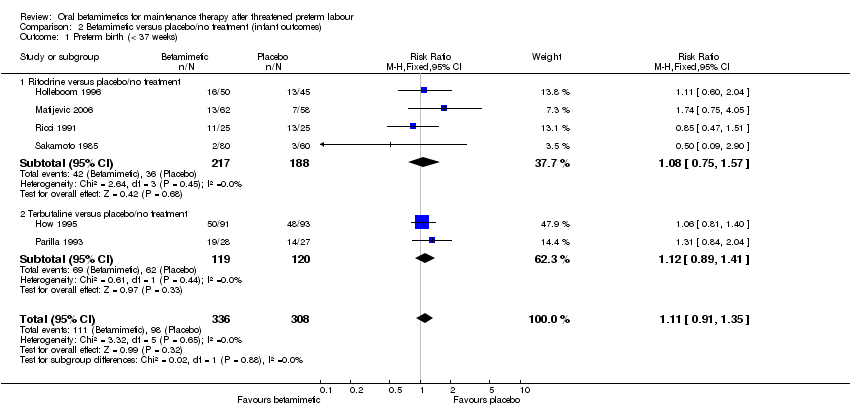
| 1 Preterm birth (< 37 weeks) Show forest plot | 6 | 644 | Risk Ratio (M‐H, Fixed, 95% CI) | 1.11 [0.91, 1.35] |
| Analysis 2.1  Comparison 2 Betamimetic versus placebo/no treatment (infant outcomes), Outcome 1 Preterm birth (< 37 weeks). | ||||
| 1.1 Ritodrine versus placebo/no treatment | 4 | 405 | Risk Ratio (M‐H, Fixed, 95% CI) | 1.08 [0.75, 1.57] |
| 1.2 Terbutaline versus placebo/no treatment | 2 | 239 | Risk Ratio (M‐H, Fixed, 95% CI) | 1.12 [0.89, 1.41] |
| 2 Birthweight Show forest plot | 7 | 780 | Mean Difference (IV, Fixed, 95% CI) | 4.13 [‐91.89, 100.16] |
| Analysis 2.2  Comparison 2 Betamimetic versus placebo/no treatment (infant outcomes), Outcome 2 Birthweight. | ||||
| 2.1 Ritodrine versus placebo/no treatment | 2 | 110 | Mean Difference (IV, Fixed, 95% CI) | ‐136.61 [‐395.85, 122.63] |
| 2.2 Terbutaline versus placebo/no treatment | 5 | 670 | Mean Difference (IV, Fixed, 95% CI) | 26.52 [‐76.87, 129.90] |
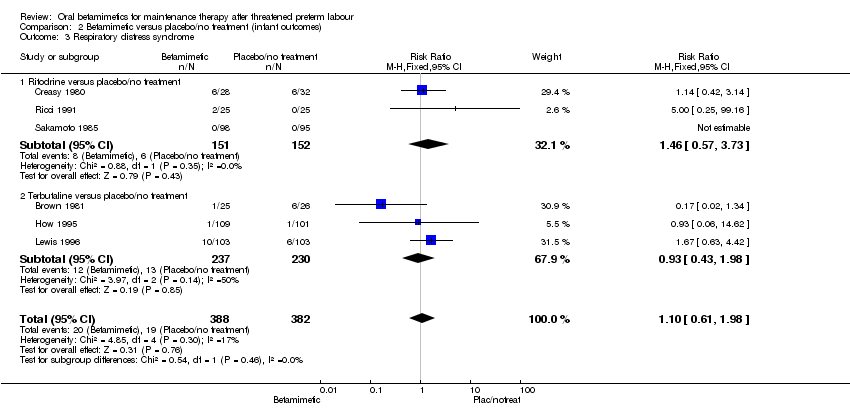
| 3 Respiratory distress syndrome Show forest plot | 6 | 770 | Risk Ratio (M‐H, Fixed, 95% CI) | 1.10 [0.61, 1.98] |
| Analysis 2.3  Comparison 2 Betamimetic versus placebo/no treatment (infant outcomes), Outcome 3 Respiratory distress syndrome. | ||||
| 3.1 Ritodrine versus placebo/no treatment | 3 | 303 | Risk Ratio (M‐H, Fixed, 95% CI) | 1.46 [0.57, 3.73] |
| 3.2 Terbutaline versus placebo/no treatment | 3 | 467 | Risk Ratio (M‐H, Fixed, 95% CI) | 0.93 [0.43, 1.98] |
| 4 Necrotising enterocolitis Show forest plot | 2 | 416 | Risk Ratio (M‐H, Fixed, 95% CI) | 0.98 [0.22, 4.28] |
| Analysis 2.4  Comparison 2 Betamimetic versus placebo/no treatment (infant outcomes), Outcome 4 Necrotising enterocolitis. | ||||
| 4.1 Terbutaline versus placebo/no treatment | 2 | 416 | Risk Ratio (M‐H, Fixed, 95% CI) | 0.98 [0.22, 4.28] |
| 5 Intraventricular haemorrhage Show forest plot | 3 | 466 | Risk Ratio (M‐H, Fixed, 95% CI) | 0.97 [0.27, 3.58] |
| Analysis 2.5  Comparison 2 Betamimetic versus placebo/no treatment (infant outcomes), Outcome 5 Intraventricular haemorrhage. | ||||
| 5.1 Ritodrine versus placebo/no treatment | 1 | 50 | Risk Ratio (M‐H, Fixed, 95% CI) | 3.0 [0.13, 70.30] |
| 5.2 Terbutaline versus placebo/no treatment | 2 | 416 | Risk Ratio (M‐H, Fixed, 95% CI) | 0.72 [0.16, 3.24] |
| 6 Neonatal jaundice Show forest plot | 1 | 50 | Risk Ratio (M‐H, Fixed, 95% CI) | 1.67 [0.71, 3.89] |
| Analysis 2.6  Comparison 2 Betamimetic versus placebo/no treatment (infant outcomes), Outcome 6 Neonatal jaundice. | ||||
| 6.1 Ritodrine versus no treatment | 1 | 50 | Risk Ratio (M‐H, Fixed, 95% CI) | 1.67 [0.71, 3.89] |
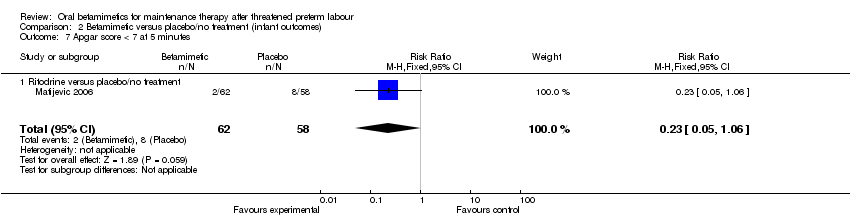
| 7 Apgar score < 7 at 5 minutes Show forest plot | 1 | 120 | Risk Ratio (M‐H, Fixed, 95% CI) | 0.23 [0.05, 1.06] |
| Analysis 2.7  Comparison 2 Betamimetic versus placebo/no treatment (infant outcomes), Outcome 7 Apgar score < 7 at 5 minutes. | ||||
| 7.1 Ritodrine versus placebo/no treatment | 1 | 120 | Risk Ratio (M‐H, Fixed, 95% CI) | 0.23 [0.05, 1.06] |
| 8 Need for mechanical ventilation Show forest plot | 1 | 120 | Risk Ratio (M‐H, Fixed, 95% CI) | 0.94 [0.06, 14.61] |
| Analysis 2.8  Comparison 2 Betamimetic versus placebo/no treatment (infant outcomes), Outcome 8 Need for mechanical ventilation. | ||||
| 8.1 Ritodrine versus placebo/no treatment | 1 | 120 | Risk Ratio (M‐H, Fixed, 95% CI) | 0.94 [0.06, 14.61] |
| Outcome or subgroup title | No. of studies | No. of participants | Statistical method | Effect size |
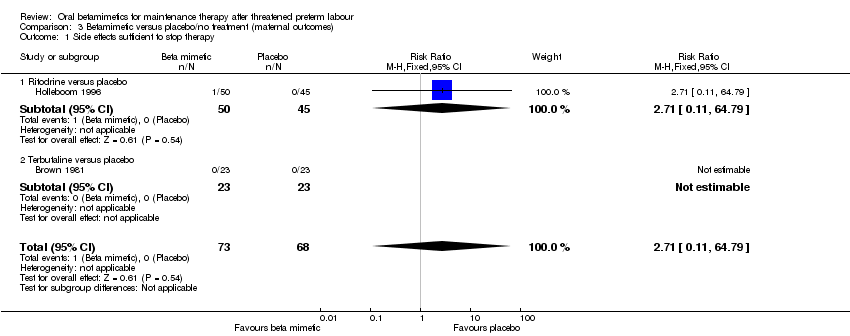
| 1 Side effects sufficient to stop therapy Show forest plot | 2 | 141 | Risk Ratio (M‐H, Fixed, 95% CI) | 2.71 [0.11, 64.79] |
| Analysis 3.1  Comparison 3 Betamimetic versus placebo/no treatment (maternal outcomes), Outcome 1 Side effects sufficient to stop therapy. | ||||
| 1.1 Ritodrine versus placebo | 1 | 95 | Risk Ratio (M‐H, Fixed, 95% CI) | 2.71 [0.11, 64.79] |
| 1.2 Terbutaline versus placebo | 1 | 46 | Risk Ratio (M‐H, Fixed, 95% CI) | 0.0 [0.0, 0.0] |
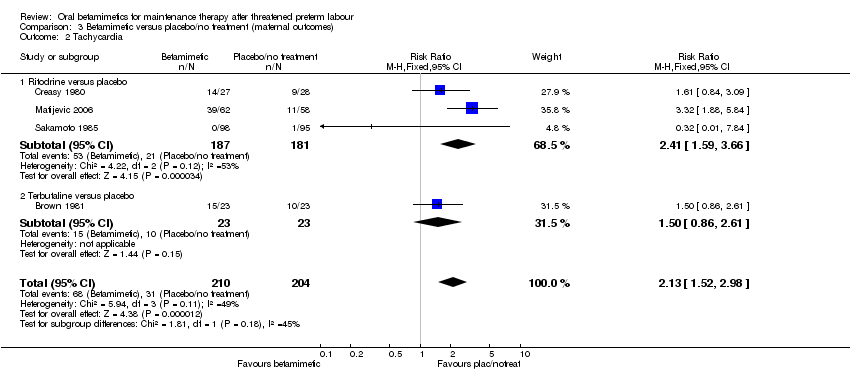
| 2 Tachycardia Show forest plot | 4 | 414 | Risk Ratio (M‐H, Fixed, 95% CI) | 2.13 [1.52, 2.98] |
| Analysis 3.2  Comparison 3 Betamimetic versus placebo/no treatment (maternal outcomes), Outcome 2 Tachycardia. | ||||
| 2.1 Ritodrine versus placebo | 3 | 368 | Risk Ratio (M‐H, Fixed, 95% CI) | 2.41 [1.59, 3.66] |
| 2.2 Terbutaline versus placebo | 1 | 46 | Risk Ratio (M‐H, Fixed, 95% CI) | 1.5 [0.86, 2.61] |
| 3 Tachypnoea Show forest plot | 2 | 260 | Risk Ratio (M‐H, Fixed, 95% CI) | 3.52 [1.20, 10.33] |
| Analysis 3.3  Comparison 3 Betamimetic versus placebo/no treatment (maternal outcomes), Outcome 3 Tachypnoea. | ||||
| 3.1 Ritodrine versus placebo | 1 | 120 | Risk Ratio (M‐H, Fixed, 95% CI) | 4.21 [0.95, 18.67] |
| 3.2 Terbutaline versus placebo | 1 | 140 | Risk Ratio (M‐H, Fixed, 95% CI) | 2.83 [0.59, 13.56] |
| 4 Hypotension Show forest plot | 2 | 166 | Risk Ratio (M‐H, Fixed, 95% CI) | 1.89 [1.13, 3.19] |
| Analysis 3.4  Comparison 3 Betamimetic versus placebo/no treatment (maternal outcomes), Outcome 4 Hypotension. | ||||
| 4.1 Ritodrine versus placebo | 1 | 120 | Risk Ratio (M‐H, Fixed, 95% CI) | 2.81 [0.30, 26.22] |
| 4.2 Terbutaline versus placebo | 1 | 46 | Risk Ratio (M‐H, Fixed, 95% CI) | 1.8 [1.08, 3.01] |
| 5 Nausea Show forest plot | 2 | 186 | Risk Ratio (M‐H, Fixed, 95% CI) | 0.95 [0.43, 2.13] |
| Analysis 3.5  Comparison 3 Betamimetic versus placebo/no treatment (maternal outcomes), Outcome 5 Nausea. | ||||
| 5.1 Terbutaline versus placebo | 2 | 186 | Risk Ratio (M‐H, Fixed, 95% CI) | 0.95 [0.43, 2.13] |
| 6 Vomiting Show forest plot | 2 | 235 | Risk Ratio (M‐H, Fixed, 95% CI) | 1.28 [0.44, 3.70] |
| Analysis 3.6  Comparison 3 Betamimetic versus placebo/no treatment (maternal outcomes), Outcome 6 Vomiting. | ||||
| 6.1 Ritodrine versus placebo | 1 | 95 | Risk Ratio (M‐H, Fixed, 95% CI) | 2.71 [0.11, 64.79] |
| 6.2 Terbutaline versus placebo | 1 | 140 | Risk Ratio (M‐H, Fixed, 95% CI) | 1.13 [0.36, 3.54] |
| 7 Palpitations Show forest plot | 1 | 140 | Risk Ratio (M‐H, Fixed, 95% CI) | 5.67 [1.32, 24.40] |
| Analysis 3.7  Comparison 3 Betamimetic versus placebo/no treatment (maternal outcomes), Outcome 7 Palpitations. | ||||
| 7.1 Terbutaline versus placebo | 1 | 140 | Risk Ratio (M‐H, Fixed, 95% CI) | 5.67 [1.32, 24.40] |
| 8 Headache Show forest plot | 1 | 95 | Risk Ratio (M‐H, Fixed, 95% CI) | 2.71 [0.11, 64.79] |
| Analysis 3.8  Comparison 3 Betamimetic versus placebo/no treatment (maternal outcomes), Outcome 8 Headache. | ||||
| 8.1 Ritodrine versus placebo/no treatment | 1 | 95 | Risk Ratio (M‐H, Fixed, 95% CI) | 2.71 [0.11, 64.79] |
| Outcome or subgroup title | No. of studies | No. of participants | Statistical method | Effect size |
| 1 Preterm birth within 24 hours Show forest plot | 1 | 46 | Risk Ratio (M‐H, Fixed, 95% CI) | 0.67 [0.12, 3.62] |
| Analysis 4.1  Comparison 4 Betamimetic versus placebo/no treatment (preterm birth and hospital admissions), Outcome 1 Preterm birth within 24 hours. | ||||
| 1.1 Terbutaline versus placebo/no treatment | 1 | 46 | Risk Ratio (M‐H, Fixed, 95% CI) | 0.67 [0.12, 3.62] |
| 2 Preterm birth within 48 hours Show forest plot | 1 | 200 | Risk Ratio (M‐H, Fixed, 95% CI) | 0.78 [0.30, 2.01] |
| Analysis 4.2  Comparison 4 Betamimetic versus placebo/no treatment (preterm birth and hospital admissions), Outcome 2 Preterm birth within 48 hours. | ||||
| 2.1 Terbutaline versus placebo/no treatment | 1 | 200 | Risk Ratio (M‐H, Fixed, 95% CI) | 0.78 [0.30, 2.01] |
| 3 Preterm birth within 1 week Show forest plot | 2 | 295 | Risk Ratio (M‐H, Fixed, 95% CI) | 0.67 [0.40, 1.13] |
| Analysis 4.3  Comparison 4 Betamimetic versus placebo/no treatment (preterm birth and hospital admissions), Outcome 3 Preterm birth within 1 week. | ||||
| 3.1 Ritodrine versus placebo | 1 | 95 | Risk Ratio (M‐H, Fixed, 95% CI) | 0.23 [0.03, 1.94] |
| 3.2 Terbutaline versus placebo | 1 | 200 | Risk Ratio (M‐H, Fixed, 95% CI) | 0.75 [0.44, 1.29] |
| 4 Maternal antenatal readmission to hospital Show forest plot | 4 | 335 | Risk Ratio (M‐H, Fixed, 95% CI) | 1.11 [0.76, 1.62] |
| Analysis 4.4  Comparison 4 Betamimetic versus placebo/no treatment (preterm birth and hospital admissions), Outcome 4 Maternal antenatal readmission to hospital. | ||||
| 4.1 Ritodrine versus placebo/no treatment | 1 | 50 | Risk Ratio (M‐H, Fixed, 95% CI) | 0.86 [0.50, 1.46] |
| 4.2 Terbutaline versus placebo/no treatment | 3 | 285 | Risk Ratio (M‐H, Fixed, 95% CI) | 1.27 [0.77, 2.10] |
| Outcome or subgroup title | No. of studies | No. of participants | Statistical method | Effect size |
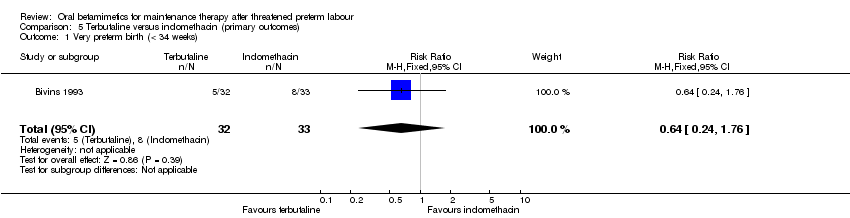
| 1 Very preterm birth (< 34 weeks) Show forest plot | 1 | 65 | Risk Ratio (M‐H, Fixed, 95% CI) | 0.64 [0.24, 1.76] |
| Analysis 5.1  Comparison 5 Terbutaline versus indomethacin (primary outcomes), Outcome 1 Very preterm birth (< 34 weeks). | ||||
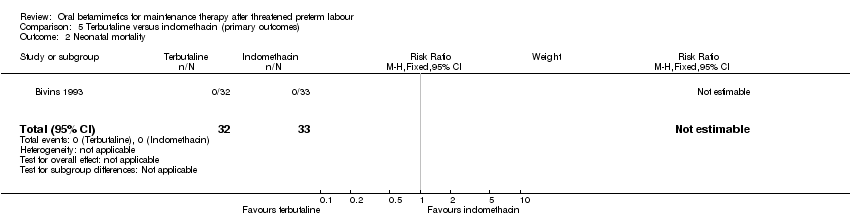
| 2 Neonatal mortality Show forest plot | 1 | 65 | Risk Ratio (M‐H, Fixed, 95% CI) | 0.0 [0.0, 0.0] |
| Analysis 5.2  Comparison 5 Terbutaline versus indomethacin (primary outcomes), Outcome 2 Neonatal mortality. | ||||
| Outcome or subgroup title | No. of studies | No. of participants | Statistical method | Effect size |
| 1 Birthweight Show forest plot | 1 | 65 | Mean Difference (IV, Fixed, 95% CI) | 52.0 [‐202.54, 306.54] |
| Analysis 6.1  Comparison 6 Terbutaline versus indomethacin (infant outcomes), Outcome 1 Birthweight. | ||||
| 2 Required mechanical ventilation Show forest plot | 1 | 65 | Risk Ratio (M‐H, Fixed, 95% CI) | 0.34 [0.01, 8.13] |
| Analysis 6.2  Comparison 6 Terbutaline versus indomethacin (infant outcomes), Outcome 2 Required mechanical ventilation. | ||||
| 3 Days stay in neonatal intensive care unit Show forest plot | 1 | 65 | Mean Difference (IV, Fixed, 95% CI) | ‐1.17 [‐2.93, 0.59] |
| Analysis 6.3  Comparison 6 Terbutaline versus indomethacin (infant outcomes), Outcome 3 Days stay in neonatal intensive care unit. | ||||
| 4 Intraventricular haemorrhage Show forest plot | 1 | 65 | Risk Ratio (M‐H, Fixed, 95% CI) | 0.0 [0.0, 0.0] |
| Analysis 6.4  Comparison 6 Terbutaline versus indomethacin (infant outcomes), Outcome 4 Intraventricular haemorrhage. | ||||
| Outcome or subgroup title | No. of studies | No. of participants | Statistical method | Effect size |
| 1 Side effects sufficient to stop therapy Show forest plot | 1 | 65 | Risk Ratio (M‐H, Fixed, 95% CI) | 3.09 [0.13, 73.19] |
| Analysis 7.1  Comparison 7 Terbutaline versus indomethacin (maternal outcomes), Outcome 1 Side effects sufficient to stop therapy. | ||||
| Outcome or subgroup title | No. of studies | No. of participants | Statistical method | Effect size |
| 1 Preterm birth Show forest plot | 1 | Risk Ratio (M‐H, Fixed, 95% CI) | Subtotals only | |
| Analysis 8.1  Comparison 8 Terbutaline versus indomethacin (preterm birth and hospital admissions), Outcome 1 Preterm birth. | ||||
| 1.1 Within 48 hours | 1 | 65 | Risk Ratio (M‐H, Fixed, 95% CI) | 0.0 [0.0, 0.0] |
| 1.2 Within 1 week | 1 | 65 | Risk Ratio (M‐H, Fixed, 95% CI) | 0.26 [0.03, 2.18] |
| 2 Maternal antenatal readmission to hospital Show forest plot | 1 | 65 | Risk Ratio (M‐H, Fixed, 95% CI) | 0.60 [0.34, 1.05] |
| Analysis 8.2  Comparison 8 Terbutaline versus indomethacin (preterm birth and hospital admissions), Outcome 2 Maternal antenatal readmission to hospital. | ||||
| Outcome or subgroup title | No. of studies | No. of participants | Statistical method | Effect size |
| 1 Very preterm birth (less than 34 weeks) Show forest plot | 1 | 91 | Risk Ratio (M‐H, Fixed, 95% CI) | 0.29 [0.01, 6.86] |
| Analysis 9.1  Comparison 9 Terbutaline versus ritodrine (primary outcomes), Outcome 1 Very preterm birth (less than 34 weeks). | ||||
| Outcome or subgroup title | No. of studies | No. of participants | Statistical method | Effect size |
| 1 Preterm birth (< 37 weeks) Show forest plot | 1 | 91 | Risk Ratio (M‐H, Fixed, 95% CI) | 0.8 [0.44, 1.46] |
| Analysis 10.1  Comparison 10 Terbutaline versus ritodrine (infant outcomes), Outcome 1 Preterm birth (< 37 weeks). | ||||
| 2 Mean birthweight Show forest plot | 1 | 91 | Mean Difference (IV, Fixed, 95% CI) | 38.30 [‐210.97, 287.57] |
| Analysis 10.2  Comparison 10 Terbutaline versus ritodrine (infant outcomes), Outcome 2 Mean birthweight. | ||||
| 3 Hyperbilirubinaemia (neonatal jaundice requiring phototherapy) Show forest plot | 1 | 91 | Risk Ratio (M‐H, Fixed, 95% CI) | 1.45 [0.84, 2.51] |
| Analysis 10.3  Comparison 10 Terbutaline versus ritodrine (infant outcomes), Outcome 3 Hyperbilirubinaemia (neonatal jaundice requiring phototherapy). | ||||
| Outcome or subgroup title | No. of studies | No. of participants | Statistical method | Effect size |
| 1 Tachycardia Show forest plot | 1 | 91 | Risk Ratio (M‐H, Fixed, 95% CI) | 0.57 [0.22, 1.47] |
| Analysis 11.1  Comparison 11 Terbutaline versus ritodrine (maternal outcomes), Outcome 1 Tachycardia. | ||||
| 2 Tachypnoea Show forest plot | 1 | 91 | Risk Ratio (M‐H, Fixed, 95% CI) | 2.57 [0.55, 12.07] |
| Analysis 11.2  Comparison 11 Terbutaline versus ritodrine (maternal outcomes), Outcome 2 Tachypnoea. | ||||
| 3 Nausea/vomiting Show forest plot | 1 | 91 | Risk Ratio (M‐H, Fixed, 95% CI) | 0.57 [0.17, 1.89] |
| Analysis 11.3  Comparison 11 Terbutaline versus ritodrine (maternal outcomes), Outcome 3 Nausea/vomiting. | ||||
| Outcome or subgroup title | No. of studies | No. of participants | Statistical method | Effect size |
| 1 Maternal antenatal readmission to hospital Show forest plot | 1 | 91 | Risk Ratio (M‐H, Fixed, 95% CI) | 1.71 [0.56, 5.29] |
| Analysis 12.1  Comparison 12 Terbutaline versus ritodrine (preterm birth and hospital admissions), Outcome 1 Maternal antenatal readmission to hospital. | ||||
| Outcome or subgroup title | No. of studies | No. of participants | Statistical method | Effect size |
| 1 Neonatal intensive care unit admission Show forest plot | 1 | 137 | Risk Ratio (M‐H, Fixed, 95% CI) | 0.80 [0.43, 1.46] |
| Analysis 13.1  Comparison 13 Betamimetic versus magnesium (primary outcomes), Outcome 1 Neonatal intensive care unit admission. | ||||
| 1.1 Terbutaline versus magnesium | 1 | 137 | Risk Ratio (M‐H, Fixed, 95% CI) | 0.80 [0.43, 1.46] |
| 2 Perinatal mortality Show forest plot | 1 | 50 | Risk Ratio (M‐H, Fixed, 95% CI) | 0.2 [0.01, 3.97] |
| Analysis 13.2  Comparison 13 Betamimetic versus magnesium (primary outcomes), Outcome 2 Perinatal mortality. | ||||
| 2.1 Ritodrine versus magnesium | 1 | 50 | Risk Ratio (M‐H, Fixed, 95% CI) | 0.2 [0.01, 3.97] |
| Outcome or subgroup title | No. of studies | No. of participants | Statistical method | Effect size |
| 1 Preterm birth (< 37 weeks) Show forest plot | 2 | 100 | Risk Ratio (M‐H, Fixed, 95% CI) | 1.02 [0.58, 1.79] |
| Analysis 14.1  Comparison 14 Betamimetic versus magnesium (infant outcomes), Outcome 1 Preterm birth (< 37 weeks). | ||||
| 1.1 Ritodrine versus magnesium | 1 | 50 | Risk Ratio (M‐H, Fixed, 95% CI) | 1.0 [0.54, 1.87] |
| 1.2 Terbutaline versus magnesium | 1 | 50 | Risk Ratio (M‐H, Fixed, 95% CI) | 1.06 [0.32, 3.50] |
| 2 Birthweight Show forest plot | 3 | 239 | Mean Difference (IV, Fixed, 95% CI) | ‐28.80 [‐187.41, 129.81] |
| Analysis 14.2  Comparison 14 Betamimetic versus magnesium (infant outcomes), Outcome 2 Birthweight. | ||||
| 2.1 Ritodrine versus magnesium | 1 | 50 | Mean Difference (IV, Fixed, 95% CI) | ‐82.0 [‐464.19, 300.19] |
| 2.2 Terbutaline versus magnesium | 2 | 189 | Mean Difference (IV, Fixed, 95% CI) | ‐17.73 [‐192.06, 156.60] |
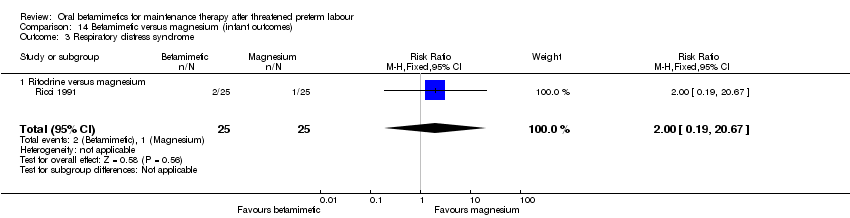
| 3 Respiratory distress syndrome Show forest plot | 1 | 50 | Risk Ratio (M‐H, Fixed, 95% CI) | 2.0 [0.19, 20.67] |
| Analysis 14.3  Comparison 14 Betamimetic versus magnesium (infant outcomes), Outcome 3 Respiratory distress syndrome. | ||||
| 3.1 Ritodrine versus magnesium | 1 | 50 | Risk Ratio (M‐H, Fixed, 95% CI) | 2.0 [0.19, 20.67] |
| 4 Intraventricular haemorrhage Show forest plot | 1 | 50 | Risk Ratio (M‐H, Fixed, 95% CI) | 1.0 [0.07, 15.12] |
| Analysis 14.4  Comparison 14 Betamimetic versus magnesium (infant outcomes), Outcome 4 Intraventricular haemorrhage. | ||||
| 4.1 Ritodrine versus magnesium | 1 | 50 | Risk Ratio (M‐H, Fixed, 95% CI) | 1.0 [0.07, 15.12] |
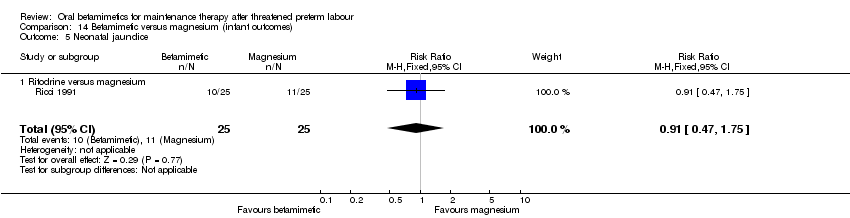
| 5 Neonatal jaundice Show forest plot | 1 | 50 | Risk Ratio (M‐H, Fixed, 95% CI) | 0.91 [0.47, 1.75] |
| Analysis 14.5  Comparison 14 Betamimetic versus magnesium (infant outcomes), Outcome 5 Neonatal jaundice. | ||||
| 5.1 Ritodrine versus magnesium | 1 | 50 | Risk Ratio (M‐H, Fixed, 95% CI) | 0.91 [0.47, 1.75] |
| Outcome or subgroup title | No. of studies | No. of participants | Statistical method | Effect size |
| 1 Side effects sufficient to stop medication Show forest plot | 2 | 100 | Risk Ratio (M‐H, Fixed, 95% CI) | 0.90 [0.24, 3.46] |
| Analysis 15.1  Comparison 15 Betamimetic versus magnesium (maternal outcomes), Outcome 1 Side effects sufficient to stop medication. | ||||
| 1.1 Ritodrine versus magnesium | 1 | 50 | Risk Ratio (M‐H, Fixed, 95% CI) | 0.5 [0.05, 5.17] |
| 1.2 Terbutaline versus magnesium | 1 | 50 | Risk Ratio (M‐H, Fixed, 95% CI) | 1.28 [0.23, 7.00] |
| 2 Tachycardia/palpitations Show forest plot | 3 | 237 | Risk Ratio (M‐H, Fixed, 95% CI) | 5.61 [2.41, 13.04] |
| Analysis 15.2  Comparison 15 Betamimetic versus magnesium (maternal outcomes), Outcome 2 Tachycardia/palpitations. | ||||
| 2.1 Ritodrine versus magnesium | 1 | 50 | Risk Ratio (M‐H, Fixed, 95% CI) | 17.0 [1.03, 279.53] |
| 2.2 Terbutaline versus magnesium | 2 | 187 | Risk Ratio (M‐H, Fixed, 95% CI) | 4.54 [1.86, 11.07] |
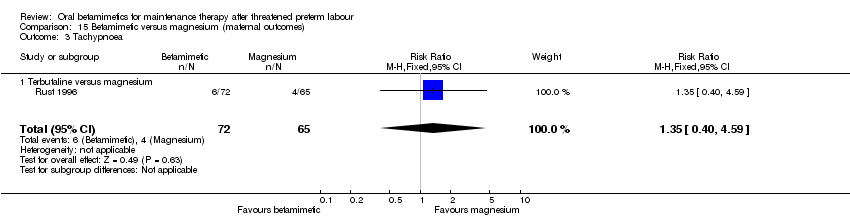
| 3 Tachypnoea Show forest plot | 1 | 137 | Risk Ratio (M‐H, Fixed, 95% CI) | 1.35 [0.40, 4.59] |
| Analysis 15.3  Comparison 15 Betamimetic versus magnesium (maternal outcomes), Outcome 3 Tachypnoea. | ||||
| 3.1 Terbutaline versus magnesium | 1 | 137 | Risk Ratio (M‐H, Fixed, 95% CI) | 1.35 [0.40, 4.59] |
| 4 Nausea Show forest plot | 3 | 237 | Risk Ratio (M‐H, Fixed, 95% CI) | 1.07 [0.57, 1.98] |
| Analysis 15.4  Comparison 15 Betamimetic versus magnesium (maternal outcomes), Outcome 4 Nausea. | ||||
| 4.1 Ritodrine versus magnesium | 1 | 50 | Risk Ratio (M‐H, Fixed, 95% CI) | 0.5 [0.05, 5.17] |
| 4.2 Terbutaline versus magnesium | 2 | 187 | Risk Ratio (M‐H, Fixed, 95% CI) | 1.15 [0.60, 2.19] |
| 5 Vomiting Show forest plot | 3 | 237 | Risk Ratio (M‐H, Fixed, 95% CI) | 0.88 [0.39, 1.98] |
| Analysis 15.5  Comparison 15 Betamimetic versus magnesium (maternal outcomes), Outcome 5 Vomiting. | ||||
| 5.1 Ritodrine versus magnesium | 1 | 50 | Risk Ratio (M‐H, Fixed, 95% CI) | 0.0 [0.0, 0.0] |
| 5.2 Terbutaline versus magnesium | 2 | 187 | Risk Ratio (M‐H, Fixed, 95% CI) | 0.88 [0.39, 1.98] |
| 6 Chest pain Show forest plot | 1 | 50 | Risk Ratio (M‐H, Fixed, 95% CI) | 0.0 [0.0, 0.0] |
| Analysis 15.6  Comparison 15 Betamimetic versus magnesium (maternal outcomes), Outcome 6 Chest pain. | ||||
| 6.1 Ritodrine versus magnesium | 1 | 50 | Risk Ratio (M‐H, Fixed, 95% CI) | 0.0 [0.0, 0.0] |
| Outcome or subgroup title | No. of studies | No. of participants | Statistical method | Effect size |
| 1 Maternal antenatal readmission to hospital Show forest plot | 1 | 50 | Risk Ratio (M‐H, Fixed, 95% CI) | 1.09 [0.60, 1.99] |
| Analysis 16.1  Comparison 16 Betamimetic versus magnesium (preterm birth and hospital admissions), Outcome 1 Maternal antenatal readmission to hospital. | ||||
| 1.1 Ritodrine versus magnesium | 1 | 50 | Risk Ratio (M‐H, Fixed, 95% CI) | 1.09 [0.60, 1.99] |
Comparison 1 Betamimetic versus placebo/no treatment (primary outcomes), Outcome 1 Very preterm birth (Less than 34 weeks' gestation).

Comparison 1 Betamimetic versus placebo/no treatment (primary outcomes), Outcome 2 Low birthweight (< 2500 grams).

Comparison 1 Betamimetic versus placebo/no treatment (primary outcomes), Outcome 3 Neonatal intensive care unit admission.

Comparison 1 Betamimetic versus placebo/no treatment (primary outcomes), Outcome 4 Perinatal mortality.
Comparison 2 Betamimetic versus placebo/no treatment (infant outcomes), Outcome 1 Preterm birth (< 37 weeks).

Comparison 2 Betamimetic versus placebo/no treatment (infant outcomes), Outcome 2 Birthweight.
Comparison 2 Betamimetic versus placebo/no treatment (infant outcomes), Outcome 3 Respiratory distress syndrome.

Comparison 2 Betamimetic versus placebo/no treatment (infant outcomes), Outcome 4 Necrotising enterocolitis.

Comparison 2 Betamimetic versus placebo/no treatment (infant outcomes), Outcome 5 Intraventricular haemorrhage.

Comparison 2 Betamimetic versus placebo/no treatment (infant outcomes), Outcome 6 Neonatal jaundice.
Comparison 2 Betamimetic versus placebo/no treatment (infant outcomes), Outcome 7 Apgar score < 7 at 5 minutes.

Comparison 2 Betamimetic versus placebo/no treatment (infant outcomes), Outcome 8 Need for mechanical ventilation.
Comparison 3 Betamimetic versus placebo/no treatment (maternal outcomes), Outcome 1 Side effects sufficient to stop therapy.
Comparison 3 Betamimetic versus placebo/no treatment (maternal outcomes), Outcome 2 Tachycardia.

Comparison 3 Betamimetic versus placebo/no treatment (maternal outcomes), Outcome 3 Tachypnoea.

Comparison 3 Betamimetic versus placebo/no treatment (maternal outcomes), Outcome 4 Hypotension.

Comparison 3 Betamimetic versus placebo/no treatment (maternal outcomes), Outcome 5 Nausea.

Comparison 3 Betamimetic versus placebo/no treatment (maternal outcomes), Outcome 6 Vomiting.

Comparison 3 Betamimetic versus placebo/no treatment (maternal outcomes), Outcome 7 Palpitations.

Comparison 3 Betamimetic versus placebo/no treatment (maternal outcomes), Outcome 8 Headache.

Comparison 4 Betamimetic versus placebo/no treatment (preterm birth and hospital admissions), Outcome 1 Preterm birth within 24 hours.

Comparison 4 Betamimetic versus placebo/no treatment (preterm birth and hospital admissions), Outcome 2 Preterm birth within 48 hours.

Comparison 4 Betamimetic versus placebo/no treatment (preterm birth and hospital admissions), Outcome 3 Preterm birth within 1 week.

Comparison 4 Betamimetic versus placebo/no treatment (preterm birth and hospital admissions), Outcome 4 Maternal antenatal readmission to hospital.
Comparison 5 Terbutaline versus indomethacin (primary outcomes), Outcome 1 Very preterm birth (< 34 weeks).
Comparison 5 Terbutaline versus indomethacin (primary outcomes), Outcome 2 Neonatal mortality.
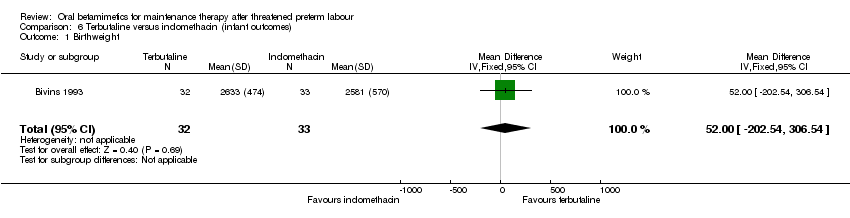
Comparison 6 Terbutaline versus indomethacin (infant outcomes), Outcome 1 Birthweight.

Comparison 6 Terbutaline versus indomethacin (infant outcomes), Outcome 2 Required mechanical ventilation.
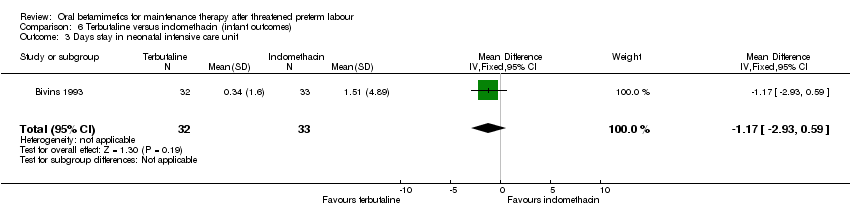
Comparison 6 Terbutaline versus indomethacin (infant outcomes), Outcome 3 Days stay in neonatal intensive care unit.

Comparison 6 Terbutaline versus indomethacin (infant outcomes), Outcome 4 Intraventricular haemorrhage.

Comparison 7 Terbutaline versus indomethacin (maternal outcomes), Outcome 1 Side effects sufficient to stop therapy.

Comparison 8 Terbutaline versus indomethacin (preterm birth and hospital admissions), Outcome 1 Preterm birth.
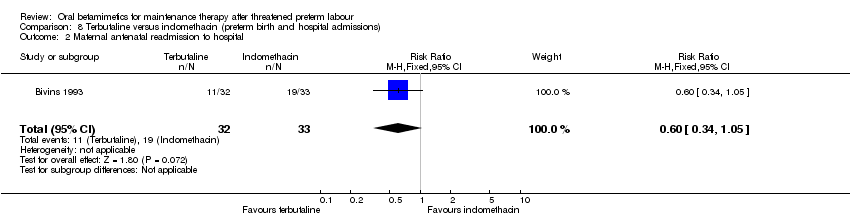
Comparison 8 Terbutaline versus indomethacin (preterm birth and hospital admissions), Outcome 2 Maternal antenatal readmission to hospital.

Comparison 9 Terbutaline versus ritodrine (primary outcomes), Outcome 1 Very preterm birth (less than 34 weeks).

Comparison 10 Terbutaline versus ritodrine (infant outcomes), Outcome 1 Preterm birth (< 37 weeks).
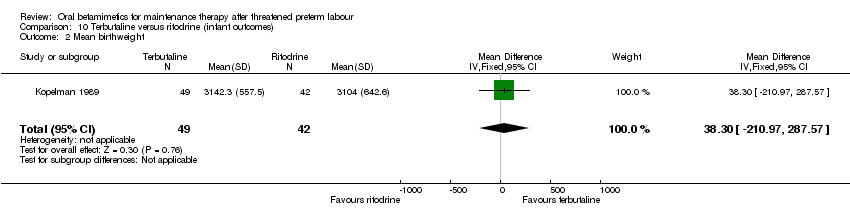
Comparison 10 Terbutaline versus ritodrine (infant outcomes), Outcome 2 Mean birthweight.

Comparison 10 Terbutaline versus ritodrine (infant outcomes), Outcome 3 Hyperbilirubinaemia (neonatal jaundice requiring phototherapy).

Comparison 11 Terbutaline versus ritodrine (maternal outcomes), Outcome 1 Tachycardia.

Comparison 11 Terbutaline versus ritodrine (maternal outcomes), Outcome 2 Tachypnoea.
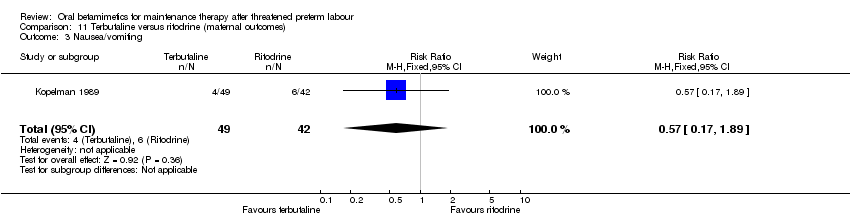
Comparison 11 Terbutaline versus ritodrine (maternal outcomes), Outcome 3 Nausea/vomiting.
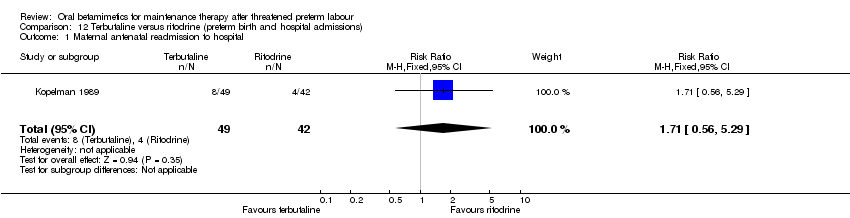
Comparison 12 Terbutaline versus ritodrine (preterm birth and hospital admissions), Outcome 1 Maternal antenatal readmission to hospital.

Comparison 13 Betamimetic versus magnesium (primary outcomes), Outcome 1 Neonatal intensive care unit admission.
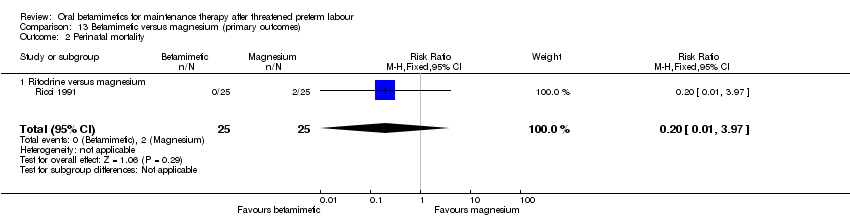
Comparison 13 Betamimetic versus magnesium (primary outcomes), Outcome 2 Perinatal mortality.

Comparison 14 Betamimetic versus magnesium (infant outcomes), Outcome 1 Preterm birth (< 37 weeks).
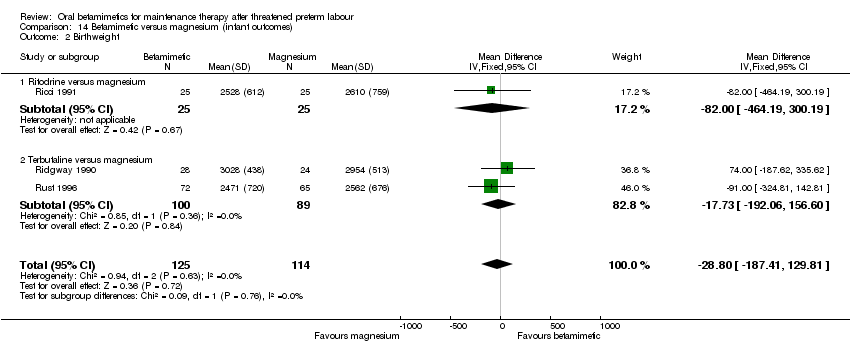
Comparison 14 Betamimetic versus magnesium (infant outcomes), Outcome 2 Birthweight.
Comparison 14 Betamimetic versus magnesium (infant outcomes), Outcome 3 Respiratory distress syndrome.

Comparison 14 Betamimetic versus magnesium (infant outcomes), Outcome 4 Intraventricular haemorrhage.
Comparison 14 Betamimetic versus magnesium (infant outcomes), Outcome 5 Neonatal jaundice.

Comparison 15 Betamimetic versus magnesium (maternal outcomes), Outcome 1 Side effects sufficient to stop medication.

Comparison 15 Betamimetic versus magnesium (maternal outcomes), Outcome 2 Tachycardia/palpitations.
Comparison 15 Betamimetic versus magnesium (maternal outcomes), Outcome 3 Tachypnoea.

Comparison 15 Betamimetic versus magnesium (maternal outcomes), Outcome 4 Nausea.

Comparison 15 Betamimetic versus magnesium (maternal outcomes), Outcome 5 Vomiting.

Comparison 15 Betamimetic versus magnesium (maternal outcomes), Outcome 6 Chest pain.

Comparison 16 Betamimetic versus magnesium (preterm birth and hospital admissions), Outcome 1 Maternal antenatal readmission to hospital.
| Outcome or subgroup title | No. of studies | No. of participants | Statistical method | Effect size |
| 1 Very preterm birth (Less than 34 weeks' gestation) Show forest plot | 1 | 120 | Risk Ratio (M‐H, Fixed, 95% CI) | 2.81 [0.30, 26.22] |
| 1.1 Ritodrine versus placebo/no treatment | 1 | 120 | Risk Ratio (M‐H, Fixed, 95% CI) | 2.81 [0.30, 26.22] |
| 2 Low birthweight (< 2500 grams) Show forest plot | 1 | 140 | Risk Ratio (M‐H, Fixed, 95% CI) | 0.15 [0.02, 1.25] |
| 2.1 Ritodrine versus placebo/no treatment | 1 | 140 | Risk Ratio (M‐H, Fixed, 95% CI) | 0.15 [0.02, 1.25] |
| 3 Neonatal intensive care unit admission Show forest plot | 2 | 260 | Risk Ratio (M‐H, Fixed, 95% CI) | 1.28 [0.68, 2.41] |
| 3.1 Ritodrine versus placebo/no treatment | 1 | 120 | Risk Ratio (M‐H, Fixed, 95% CI) | 1.25 [0.29, 5.34] |
| 3.2 Terbutaline versus placebo/no treatment | 1 | 140 | Risk Ratio (M‐H, Fixed, 95% CI) | 1.29 [0.64, 2.60] |
| 4 Perinatal mortality Show forest plot | 6 | 681 | Risk Ratio (M‐H, Fixed, 95% CI) | 2.41 [0.86, 6.74] |
| 4.1 Ritodrine versus placebo/no treatment | 3 | 214 | Risk Ratio (M‐H, Fixed, 95% CI) | 1.85 [0.41, 8.39] |
| 4.2 Terbutaline versus placebo/no treatment | 3 | 467 | Risk Ratio (M‐H, Fixed, 95% CI) | 2.96 [0.72, 12.14] |
| 5 Maternal death or serious maternal morbidity | 0 | 0 | Risk Ratio (M‐H, Fixed, 95% CI) | 0.0 [0.0, 0.0] |
| Outcome or subgroup title | No. of studies | No. of participants | Statistical method | Effect size |
| 1 Preterm birth (< 37 weeks) Show forest plot | 6 | 644 | Risk Ratio (M‐H, Fixed, 95% CI) | 1.11 [0.91, 1.35] |
| 1.1 Ritodrine versus placebo/no treatment | 4 | 405 | Risk Ratio (M‐H, Fixed, 95% CI) | 1.08 [0.75, 1.57] |
| 1.2 Terbutaline versus placebo/no treatment | 2 | 239 | Risk Ratio (M‐H, Fixed, 95% CI) | 1.12 [0.89, 1.41] |
| 2 Birthweight Show forest plot | 7 | 780 | Mean Difference (IV, Fixed, 95% CI) | 4.13 [‐91.89, 100.16] |
| 2.1 Ritodrine versus placebo/no treatment | 2 | 110 | Mean Difference (IV, Fixed, 95% CI) | ‐136.61 [‐395.85, 122.63] |
| 2.2 Terbutaline versus placebo/no treatment | 5 | 670 | Mean Difference (IV, Fixed, 95% CI) | 26.52 [‐76.87, 129.90] |
| 3 Respiratory distress syndrome Show forest plot | 6 | 770 | Risk Ratio (M‐H, Fixed, 95% CI) | 1.10 [0.61, 1.98] |
| 3.1 Ritodrine versus placebo/no treatment | 3 | 303 | Risk Ratio (M‐H, Fixed, 95% CI) | 1.46 [0.57, 3.73] |
| 3.2 Terbutaline versus placebo/no treatment | 3 | 467 | Risk Ratio (M‐H, Fixed, 95% CI) | 0.93 [0.43, 1.98] |
| 4 Necrotising enterocolitis Show forest plot | 2 | 416 | Risk Ratio (M‐H, Fixed, 95% CI) | 0.98 [0.22, 4.28] |
| 4.1 Terbutaline versus placebo/no treatment | 2 | 416 | Risk Ratio (M‐H, Fixed, 95% CI) | 0.98 [0.22, 4.28] |
| 5 Intraventricular haemorrhage Show forest plot | 3 | 466 | Risk Ratio (M‐H, Fixed, 95% CI) | 0.97 [0.27, 3.58] |
| 5.1 Ritodrine versus placebo/no treatment | 1 | 50 | Risk Ratio (M‐H, Fixed, 95% CI) | 3.0 [0.13, 70.30] |
| 5.2 Terbutaline versus placebo/no treatment | 2 | 416 | Risk Ratio (M‐H, Fixed, 95% CI) | 0.72 [0.16, 3.24] |
| 6 Neonatal jaundice Show forest plot | 1 | 50 | Risk Ratio (M‐H, Fixed, 95% CI) | 1.67 [0.71, 3.89] |
| 6.1 Ritodrine versus no treatment | 1 | 50 | Risk Ratio (M‐H, Fixed, 95% CI) | 1.67 [0.71, 3.89] |
| 7 Apgar score < 7 at 5 minutes Show forest plot | 1 | 120 | Risk Ratio (M‐H, Fixed, 95% CI) | 0.23 [0.05, 1.06] |
| 7.1 Ritodrine versus placebo/no treatment | 1 | 120 | Risk Ratio (M‐H, Fixed, 95% CI) | 0.23 [0.05, 1.06] |
| 8 Need for mechanical ventilation Show forest plot | 1 | 120 | Risk Ratio (M‐H, Fixed, 95% CI) | 0.94 [0.06, 14.61] |
| 8.1 Ritodrine versus placebo/no treatment | 1 | 120 | Risk Ratio (M‐H, Fixed, 95% CI) | 0.94 [0.06, 14.61] |
| Outcome or subgroup title | No. of studies | No. of participants | Statistical method | Effect size |
| 1 Side effects sufficient to stop therapy Show forest plot | 2 | 141 | Risk Ratio (M‐H, Fixed, 95% CI) | 2.71 [0.11, 64.79] |
| 1.1 Ritodrine versus placebo | 1 | 95 | Risk Ratio (M‐H, Fixed, 95% CI) | 2.71 [0.11, 64.79] |
| 1.2 Terbutaline versus placebo | 1 | 46 | Risk Ratio (M‐H, Fixed, 95% CI) | 0.0 [0.0, 0.0] |
| 2 Tachycardia Show forest plot | 4 | 414 | Risk Ratio (M‐H, Fixed, 95% CI) | 2.13 [1.52, 2.98] |
| 2.1 Ritodrine versus placebo | 3 | 368 | Risk Ratio (M‐H, Fixed, 95% CI) | 2.41 [1.59, 3.66] |
| 2.2 Terbutaline versus placebo | 1 | 46 | Risk Ratio (M‐H, Fixed, 95% CI) | 1.5 [0.86, 2.61] |
| 3 Tachypnoea Show forest plot | 2 | 260 | Risk Ratio (M‐H, Fixed, 95% CI) | 3.52 [1.20, 10.33] |
| 3.1 Ritodrine versus placebo | 1 | 120 | Risk Ratio (M‐H, Fixed, 95% CI) | 4.21 [0.95, 18.67] |
| 3.2 Terbutaline versus placebo | 1 | 140 | Risk Ratio (M‐H, Fixed, 95% CI) | 2.83 [0.59, 13.56] |
| 4 Hypotension Show forest plot | 2 | 166 | Risk Ratio (M‐H, Fixed, 95% CI) | 1.89 [1.13, 3.19] |
| 4.1 Ritodrine versus placebo | 1 | 120 | Risk Ratio (M‐H, Fixed, 95% CI) | 2.81 [0.30, 26.22] |
| 4.2 Terbutaline versus placebo | 1 | 46 | Risk Ratio (M‐H, Fixed, 95% CI) | 1.8 [1.08, 3.01] |
| 5 Nausea Show forest plot | 2 | 186 | Risk Ratio (M‐H, Fixed, 95% CI) | 0.95 [0.43, 2.13] |
| 5.1 Terbutaline versus placebo | 2 | 186 | Risk Ratio (M‐H, Fixed, 95% CI) | 0.95 [0.43, 2.13] |
| 6 Vomiting Show forest plot | 2 | 235 | Risk Ratio (M‐H, Fixed, 95% CI) | 1.28 [0.44, 3.70] |
| 6.1 Ritodrine versus placebo | 1 | 95 | Risk Ratio (M‐H, Fixed, 95% CI) | 2.71 [0.11, 64.79] |
| 6.2 Terbutaline versus placebo | 1 | 140 | Risk Ratio (M‐H, Fixed, 95% CI) | 1.13 [0.36, 3.54] |
| 7 Palpitations Show forest plot | 1 | 140 | Risk Ratio (M‐H, Fixed, 95% CI) | 5.67 [1.32, 24.40] |
| 7.1 Terbutaline versus placebo | 1 | 140 | Risk Ratio (M‐H, Fixed, 95% CI) | 5.67 [1.32, 24.40] |
| 8 Headache Show forest plot | 1 | 95 | Risk Ratio (M‐H, Fixed, 95% CI) | 2.71 [0.11, 64.79] |
| 8.1 Ritodrine versus placebo/no treatment | 1 | 95 | Risk Ratio (M‐H, Fixed, 95% CI) | 2.71 [0.11, 64.79] |
| Outcome or subgroup title | No. of studies | No. of participants | Statistical method | Effect size |
| 1 Preterm birth within 24 hours Show forest plot | 1 | 46 | Risk Ratio (M‐H, Fixed, 95% CI) | 0.67 [0.12, 3.62] |
| 1.1 Terbutaline versus placebo/no treatment | 1 | 46 | Risk Ratio (M‐H, Fixed, 95% CI) | 0.67 [0.12, 3.62] |
| 2 Preterm birth within 48 hours Show forest plot | 1 | 200 | Risk Ratio (M‐H, Fixed, 95% CI) | 0.78 [0.30, 2.01] |
| 2.1 Terbutaline versus placebo/no treatment | 1 | 200 | Risk Ratio (M‐H, Fixed, 95% CI) | 0.78 [0.30, 2.01] |
| 3 Preterm birth within 1 week Show forest plot | 2 | 295 | Risk Ratio (M‐H, Fixed, 95% CI) | 0.67 [0.40, 1.13] |
| 3.1 Ritodrine versus placebo | 1 | 95 | Risk Ratio (M‐H, Fixed, 95% CI) | 0.23 [0.03, 1.94] |
| 3.2 Terbutaline versus placebo | 1 | 200 | Risk Ratio (M‐H, Fixed, 95% CI) | 0.75 [0.44, 1.29] |
| 4 Maternal antenatal readmission to hospital Show forest plot | 4 | 335 | Risk Ratio (M‐H, Fixed, 95% CI) | 1.11 [0.76, 1.62] |
| 4.1 Ritodrine versus placebo/no treatment | 1 | 50 | Risk Ratio (M‐H, Fixed, 95% CI) | 0.86 [0.50, 1.46] |
| 4.2 Terbutaline versus placebo/no treatment | 3 | 285 | Risk Ratio (M‐H, Fixed, 95% CI) | 1.27 [0.77, 2.10] |
| Outcome or subgroup title | No. of studies | No. of participants | Statistical method | Effect size |
| 1 Very preterm birth (< 34 weeks) Show forest plot | 1 | 65 | Risk Ratio (M‐H, Fixed, 95% CI) | 0.64 [0.24, 1.76] |
| 2 Neonatal mortality Show forest plot | 1 | 65 | Risk Ratio (M‐H, Fixed, 95% CI) | 0.0 [0.0, 0.0] |
| Outcome or subgroup title | No. of studies | No. of participants | Statistical method | Effect size |
| 1 Birthweight Show forest plot | 1 | 65 | Mean Difference (IV, Fixed, 95% CI) | 52.0 [‐202.54, 306.54] |
| 2 Required mechanical ventilation Show forest plot | 1 | 65 | Risk Ratio (M‐H, Fixed, 95% CI) | 0.34 [0.01, 8.13] |
| 3 Days stay in neonatal intensive care unit Show forest plot | 1 | 65 | Mean Difference (IV, Fixed, 95% CI) | ‐1.17 [‐2.93, 0.59] |
| 4 Intraventricular haemorrhage Show forest plot | 1 | 65 | Risk Ratio (M‐H, Fixed, 95% CI) | 0.0 [0.0, 0.0] |
| Outcome or subgroup title | No. of studies | No. of participants | Statistical method | Effect size |
| 1 Side effects sufficient to stop therapy Show forest plot | 1 | 65 | Risk Ratio (M‐H, Fixed, 95% CI) | 3.09 [0.13, 73.19] |
| Outcome or subgroup title | No. of studies | No. of participants | Statistical method | Effect size |
| 1 Preterm birth Show forest plot | 1 | Risk Ratio (M‐H, Fixed, 95% CI) | Subtotals only | |
| 1.1 Within 48 hours | 1 | 65 | Risk Ratio (M‐H, Fixed, 95% CI) | 0.0 [0.0, 0.0] |
| 1.2 Within 1 week | 1 | 65 | Risk Ratio (M‐H, Fixed, 95% CI) | 0.26 [0.03, 2.18] |
| 2 Maternal antenatal readmission to hospital Show forest plot | 1 | 65 | Risk Ratio (M‐H, Fixed, 95% CI) | 0.60 [0.34, 1.05] |
| Outcome or subgroup title | No. of studies | No. of participants | Statistical method | Effect size |
| 1 Very preterm birth (less than 34 weeks) Show forest plot | 1 | 91 | Risk Ratio (M‐H, Fixed, 95% CI) | 0.29 [0.01, 6.86] |
| Outcome or subgroup title | No. of studies | No. of participants | Statistical method | Effect size |
| 1 Preterm birth (< 37 weeks) Show forest plot | 1 | 91 | Risk Ratio (M‐H, Fixed, 95% CI) | 0.8 [0.44, 1.46] |
| 2 Mean birthweight Show forest plot | 1 | 91 | Mean Difference (IV, Fixed, 95% CI) | 38.30 [‐210.97, 287.57] |
| 3 Hyperbilirubinaemia (neonatal jaundice requiring phototherapy) Show forest plot | 1 | 91 | Risk Ratio (M‐H, Fixed, 95% CI) | 1.45 [0.84, 2.51] |
| Outcome or subgroup title | No. of studies | No. of participants | Statistical method | Effect size |
| 1 Tachycardia Show forest plot | 1 | 91 | Risk Ratio (M‐H, Fixed, 95% CI) | 0.57 [0.22, 1.47] |
| 2 Tachypnoea Show forest plot | 1 | 91 | Risk Ratio (M‐H, Fixed, 95% CI) | 2.57 [0.55, 12.07] |
| 3 Nausea/vomiting Show forest plot | 1 | 91 | Risk Ratio (M‐H, Fixed, 95% CI) | 0.57 [0.17, 1.89] |
| Outcome or subgroup title | No. of studies | No. of participants | Statistical method | Effect size |
| 1 Maternal antenatal readmission to hospital Show forest plot | 1 | 91 | Risk Ratio (M‐H, Fixed, 95% CI) | 1.71 [0.56, 5.29] |
| Outcome or subgroup title | No. of studies | No. of participants | Statistical method | Effect size |
| 1 Neonatal intensive care unit admission Show forest plot | 1 | 137 | Risk Ratio (M‐H, Fixed, 95% CI) | 0.80 [0.43, 1.46] |
| 1.1 Terbutaline versus magnesium | 1 | 137 | Risk Ratio (M‐H, Fixed, 95% CI) | 0.80 [0.43, 1.46] |
| 2 Perinatal mortality Show forest plot | 1 | 50 | Risk Ratio (M‐H, Fixed, 95% CI) | 0.2 [0.01, 3.97] |
| 2.1 Ritodrine versus magnesium | 1 | 50 | Risk Ratio (M‐H, Fixed, 95% CI) | 0.2 [0.01, 3.97] |
| Outcome or subgroup title | No. of studies | No. of participants | Statistical method | Effect size |
| 1 Preterm birth (< 37 weeks) Show forest plot | 2 | 100 | Risk Ratio (M‐H, Fixed, 95% CI) | 1.02 [0.58, 1.79] |
| 1.1 Ritodrine versus magnesium | 1 | 50 | Risk Ratio (M‐H, Fixed, 95% CI) | 1.0 [0.54, 1.87] |
| 1.2 Terbutaline versus magnesium | 1 | 50 | Risk Ratio (M‐H, Fixed, 95% CI) | 1.06 [0.32, 3.50] |
| 2 Birthweight Show forest plot | 3 | 239 | Mean Difference (IV, Fixed, 95% CI) | ‐28.80 [‐187.41, 129.81] |
| 2.1 Ritodrine versus magnesium | 1 | 50 | Mean Difference (IV, Fixed, 95% CI) | ‐82.0 [‐464.19, 300.19] |
| 2.2 Terbutaline versus magnesium | 2 | 189 | Mean Difference (IV, Fixed, 95% CI) | ‐17.73 [‐192.06, 156.60] |
| 3 Respiratory distress syndrome Show forest plot | 1 | 50 | Risk Ratio (M‐H, Fixed, 95% CI) | 2.0 [0.19, 20.67] |
| 3.1 Ritodrine versus magnesium | 1 | 50 | Risk Ratio (M‐H, Fixed, 95% CI) | 2.0 [0.19, 20.67] |
| 4 Intraventricular haemorrhage Show forest plot | 1 | 50 | Risk Ratio (M‐H, Fixed, 95% CI) | 1.0 [0.07, 15.12] |
| 4.1 Ritodrine versus magnesium | 1 | 50 | Risk Ratio (M‐H, Fixed, 95% CI) | 1.0 [0.07, 15.12] |
| 5 Neonatal jaundice Show forest plot | 1 | 50 | Risk Ratio (M‐H, Fixed, 95% CI) | 0.91 [0.47, 1.75] |
| 5.1 Ritodrine versus magnesium | 1 | 50 | Risk Ratio (M‐H, Fixed, 95% CI) | 0.91 [0.47, 1.75] |
| Outcome or subgroup title | No. of studies | No. of participants | Statistical method | Effect size |
| 1 Side effects sufficient to stop medication Show forest plot | 2 | 100 | Risk Ratio (M‐H, Fixed, 95% CI) | 0.90 [0.24, 3.46] |
| 1.1 Ritodrine versus magnesium | 1 | 50 | Risk Ratio (M‐H, Fixed, 95% CI) | 0.5 [0.05, 5.17] |
| 1.2 Terbutaline versus magnesium | 1 | 50 | Risk Ratio (M‐H, Fixed, 95% CI) | 1.28 [0.23, 7.00] |
| 2 Tachycardia/palpitations Show forest plot | 3 | 237 | Risk Ratio (M‐H, Fixed, 95% CI) | 5.61 [2.41, 13.04] |
| 2.1 Ritodrine versus magnesium | 1 | 50 | Risk Ratio (M‐H, Fixed, 95% CI) | 17.0 [1.03, 279.53] |
| 2.2 Terbutaline versus magnesium | 2 | 187 | Risk Ratio (M‐H, Fixed, 95% CI) | 4.54 [1.86, 11.07] |
| 3 Tachypnoea Show forest plot | 1 | 137 | Risk Ratio (M‐H, Fixed, 95% CI) | 1.35 [0.40, 4.59] |
| 3.1 Terbutaline versus magnesium | 1 | 137 | Risk Ratio (M‐H, Fixed, 95% CI) | 1.35 [0.40, 4.59] |
| 4 Nausea Show forest plot | 3 | 237 | Risk Ratio (M‐H, Fixed, 95% CI) | 1.07 [0.57, 1.98] |
| 4.1 Ritodrine versus magnesium | 1 | 50 | Risk Ratio (M‐H, Fixed, 95% CI) | 0.5 [0.05, 5.17] |
| 4.2 Terbutaline versus magnesium | 2 | 187 | Risk Ratio (M‐H, Fixed, 95% CI) | 1.15 [0.60, 2.19] |
| 5 Vomiting Show forest plot | 3 | 237 | Risk Ratio (M‐H, Fixed, 95% CI) | 0.88 [0.39, 1.98] |
| 5.1 Ritodrine versus magnesium | 1 | 50 | Risk Ratio (M‐H, Fixed, 95% CI) | 0.0 [0.0, 0.0] |
| 5.2 Terbutaline versus magnesium | 2 | 187 | Risk Ratio (M‐H, Fixed, 95% CI) | 0.88 [0.39, 1.98] |
| 6 Chest pain Show forest plot | 1 | 50 | Risk Ratio (M‐H, Fixed, 95% CI) | 0.0 [0.0, 0.0] |
| 6.1 Ritodrine versus magnesium | 1 | 50 | Risk Ratio (M‐H, Fixed, 95% CI) | 0.0 [0.0, 0.0] |
| Outcome or subgroup title | No. of studies | No. of participants | Statistical method | Effect size |
| 1 Maternal antenatal readmission to hospital Show forest plot | 1 | 50 | Risk Ratio (M‐H, Fixed, 95% CI) | 1.09 [0.60, 1.99] |
| 1.1 Ritodrine versus magnesium | 1 | 50 | Risk Ratio (M‐H, Fixed, 95% CI) | 1.09 [0.60, 1.99] |