Scolaris Content Display Scolaris Content Display

Comparison 1 More versus less chemotherapy, Outcome 1 Survival.
Figuras y tablas -
Analysis 1.1

Comparison 1 More versus less chemotherapy, Outcome 1 Survival.

Comparison 1 More versus less chemotherapy, Outcome 2 Progression‐free survival.
Figuras y tablas -
Analysis 1.2

Comparison 1 More versus less chemotherapy, Outcome 2 Progression‐free survival.

Comparison 1 More versus less chemotherapy, Outcome 3 G3‐4 Nausea/vomiting.
Figuras y tablas -
Analysis 1.3

Comparison 1 More versus less chemotherapy, Outcome 3 G3‐4 Nausea/vomiting.

Comparison 1 More versus less chemotherapy, Outcome 4 G3‐4 Diarrhoea/Other GI.
Figuras y tablas -
Analysis 1.4

Comparison 1 More versus less chemotherapy, Outcome 4 G3‐4 Diarrhoea/Other GI.

Comparison 1 More versus less chemotherapy, Outcome 5 G3‐4 Leukopenia.
Figuras y tablas -
Analysis 1.5

Comparison 1 More versus less chemotherapy, Outcome 5 G3‐4 Leukopenia.

Comparison 1 More versus less chemotherapy, Outcome 6 G3‐4 Thrombocytopenia.
Figuras y tablas -
Analysis 1.6

Comparison 1 More versus less chemotherapy, Outcome 6 G3‐4 Thrombocytopenia.

Comparison 1 More versus less chemotherapy, Outcome 7 G3‐4 Anaemia.
Figuras y tablas -
Analysis 1.7

Comparison 1 More versus less chemotherapy, Outcome 7 G3‐4 Anaemia.

Comparison 1 More versus less chemotherapy, Outcome 8 G3‐4 Alopecia.
Figuras y tablas -
Analysis 1.8

Comparison 1 More versus less chemotherapy, Outcome 8 G3‐4 Alopecia.

Comparison 1 More versus less chemotherapy, Outcome 9 G3‐4 Cardiotoxicity.
Figuras y tablas -
Analysis 1.9

Comparison 1 More versus less chemotherapy, Outcome 9 G3‐4 Cardiotoxicity.

Comparison 1 More versus less chemotherapy, Outcome 10 G3‐4 Fever/infection.
Figuras y tablas -
Analysis 1.10

Comparison 1 More versus less chemotherapy, Outcome 10 G3‐4 Fever/infection.

Comparison 1 More versus less chemotherapy, Outcome 11 G3‐4 Stomatitis/mucositis.
Figuras y tablas -
Analysis 1.11

Comparison 1 More versus less chemotherapy, Outcome 11 G3‐4 Stomatitis/mucositis.

Comparison 1 More versus less chemotherapy, Outcome 12 G3‐4 Neurological toxicity.
Figuras y tablas -
Analysis 1.12

Comparison 1 More versus less chemotherapy, Outcome 12 G3‐4 Neurological toxicity.

Comparison 1 More versus less chemotherapy, Outcome 13 G3‐4 Renal/GU.
Figuras y tablas -
Analysis 1.13

Comparison 1 More versus less chemotherapy, Outcome 13 G3‐4 Renal/GU.

Table 1. RCTs: Response rates, progression‐free survival and overall survival

Study

No. randomised

No. evaluable

Complete response

Partial reponse

Stable disease

Progressive disease

ORR (%)

Median PFS

Median OS

EDMONDSON 1987

Cisplatin

14

14

1

2

6

5

21%

56 days

226 days

Cisplatin, doxorubicin, cyclophosphamide

16

16

0

5

6

5

31%

88 days

202 days

AAPRO 2003

Doxorubicin

87

87

8

7

20

32

17%

7 mths

7 mths

Doxorubicin & cisplatin

90

90

13

26

21

13

43%

8 mths

9 mths

THIGPEN 1994

Doxorubicin

169

132

7

22

73

30

22%

3.2 mths

6.9 mths

Doxorubicin & cyclophosphamide

90

90

18

25

75

26

30%

3.9 mths

7.3 mths

THIGPEN 2004

Doxorubicin

NS

150

12

26

NS

NS

25%

5.7 mths

9.0 mths

Doxorubicin & cisplatin

NS

131

25

30

NS

NS

42%

3.8 mths

9.2 nths

LONG 1995

Doxorubicin & cyclophosphamide

15

15

2

2

NS

NS

26%

6.2 mths

15 mths

Doxorubicin, cyclophosphamide, methotrexate & vinblastine,

13

13

4

5

NS

NS

69%

6.9 mths

15 mths

FLEMING 2004A

Doxorubicin & cisplatin

136

129

7%

26%

NS

NS

34%

5.3 mths

12.3 mths

Doxorubicin, cisplatin & paclitaxel

137

134

22%

35%

NS

NS

57%

8.3 mths

15.3 mths

HORTON 1978

Doxorubicin

21

21

1

3

6

11

19%

NS

NS

Cyclophosphamide

19

19

0

0

7

12

0%

NS

NS

PAWINSKI 1999

Cyclophosphamide

29

28

0

2

6

20

7%

7 wks

NS

Ifosfamide

32

31

2

2

10

17

12%

8 wks

NS

FLEMMING 2004B

Doxorubicin & cisplatin

160

157

NS

NS

NS

NS

40%

7.2 mths

12.6 mths

Doxorubicin, paclitaxel & filgrastim

168

160

NS

NS

NS

NS

43%

6.0 mths

13.6 mths

GALLION 2003

Standard timed doxorubicin

175

169

25

52

NS

NS

46%

6.5 mths

11.2 mths

Circadian timed doxorubicin

177

173

30

55

NS

NS

49%

5.9 mths

13.2 mths

COHEN 1984

Melphalan, 5‐FU, megestrol acetate

146

77

12

17

27

21

37.7%

6.1m

10.6m

Doxorubicin, cyclophosphamide, 5‐FU, megestrol acetate

149

78

13

15

30

20

35.9%

5.2m

10.1m

ORR= Objective response rate, PFS= Progression‐free survival, OS=overall survival

Figuras y tablas -
Table 1. RCTs: Response rates, progression‐free survival and overall survival
Table 2. Phase II studies: Cisplatin containing combinations

Study

Year

Drug name

Dose

Number in Study

Prior chemo (No.)

ORR (%)

Median PFS

Median OS

Seski

1982

cisplatin

50‐100mg/m2

26

yes (5)

42.3

5m

NS

Thigpen

1984

cisplatin

50mg/m2

31

yes (24)

4

NS

NS

Thigpen

1989

cisplatin

50mg/m2

56

no

20.4

2.9m

8.2m

Barrett

1993

cisplatin

60mg/m2

33

no

60

7.5m

14m

doxorubicin

60mg/m2

Deppe

1994

cisplatin

50mg/m2

19

NS

36.8

NS

NS

doxorubicin

50mg/m2

Trope

1984

cisplatin

50mg/m2

19

no

60

ns

ns

doxorubicin

50mg/m2

Pasmantier

1985

cisplatin

60mg/m2

16

yes (4)

81.2

ns

10m

doxorubicin

60mg/m2

Lovecchio

1984

cisplatin

50mg/m2

15

no

60

ns

ns

doxorubicin

30mg/m2

cyclophosphamide

300mg/m2

megace

120mg/day

Turbow

1995

cisplatin

60mg/m2

21

no

47.3

ns

10m

doxorubicin

50mg/m2

cyclophosphamide

600mg/m2

Hancock

1986

cisplatin

50mg/m2

18

no

56

ns

ns

doxorubicin

50mg/m2

cyclophosphamide

500mg/m2

Hoffman

1989

cisplatin

50mg/m2

15

ns

33

17wks

38wks

doxorubicin

30mg/m2

cyclophosphamide

500mg/m2

megace

160mg/day

Burke

1991

cisplatin

50mg/m2

102

no

45

ns

ns

doxorubicin

50mg/m2

cyclophosphamide

500mg/m2

Pietrzak

1995

cisplatin

50mg/m2

41

ns

12.2

ns

ns

doxorubicin

50mg/m2

cyclophosphamide

500mg/m2

Alberts

1987

cisplatin

50mg/m2

64

no

30.9

ns

6.5m

doxorubicin

30mg/m2

vinblastine

0.15mg/m2

Piver

1991

cisplatin

60mg/m2

20

yes (2)

75

ns

15m

doxorubicin

40mg/m2

etoposide

225mg/m2

megace

160mg/day

Cornelison

1995

cisplatin

60mg/m2

50

no

54

11.9

16.4

doxorubicin

40mg/m2

etoposide

225mg/m2

megace

160mg/day

Long

1995

cisplatin

70mg/m2

30

no

67

7.2m

9.9m

doxorubicin

40mg/m2

vinblastine

9mg/m2

methotrexate

90mg/m2

Pierga

1997

cisplatin

105mg/m2

20

no

45

8m

17m

doxorubicin

30mg/m2

etoposide

240mg/m2

5‐FU

1800mg/m2

Lissoni

1997

cisplatin

50mg/m2

30

no

73

ns

ns

paclitaxel

175mg/m2

epirubicin

70mg/m2

Dimopoulos

2000

cisplatin

75mg/m2

24

no

67

8.4

17.6

paclitaxel

175mg/m2

Sorbe

1989

cisplatin

60mg/m2

44

ns

52.3

ns

7m

vincristine

1.5mg/m2

VM‐26

100mg/m2

megace

500mg/day

Gebbia

2001

cisplatin

80mg/m2

35

no

57

ns

240days

vinorelbine

50mg/m2

Pierga

1996

cisplatin

105mg/m2

49

yes (2)

41

ns

14m

etoposide

240mg/m2

5‐FU

1800mg/m2

Figuras y tablas -
Table 2. Phase II studies: Cisplatin containing combinations
Table 3. Phase II studies: Carboplatin containing combinations

Study

Year

Drug

Dose

Number in Study

Prior chemo (No.)

ORR (%)

Median PFS

Median OS

Green

1990

carboplatin

400mg/m2

32

no

30

ns

282 days

Burke

1993

carboplatin

360 ‐ 450mg/m2

33

no

33

4 ‐ 5m

8 ‐ 10m

Long

1998

carboplatin

400mg/m2

25

no

28

117 days

215 days

Bafaloukos

1999

carboplatin

300mg/m2

23

no

74

ns

16m

methotrexate

30mg/m2

5‐FU

500mg/m2

megace

300mg/day

Hoskins

2001

carboplatin

AUC 5‐7

67

no

60.9

ns

15‐26m

paclitaxel

175mg/m2

Figuras y tablas -
Table 3. Phase II studies: Carboplatin containing combinations
Table 4. Phase II studies: Anthracycline containing combinations

Study

Date

Drug

Dose

Number in study

Prior chemo (No.)

ORR (%)

Median PFS

Median OS

Thigpen

1979

doxorubicin

60mg/m2

55

yes (2)

37.2

ns

6.8m

Seski

1981

doxorubicin

40‐50mg/m2

26

ns

30.7

ns

ns

cyclophosphamide

500‐600mg/m2

Deppe

1981

doxorubicin

40mg/m2

29

ns

44.9

ns

6.7‐12.5m

cyclophosphamide

400mg/m2

5‐FU

400mg/m2

megace

160mg/day

Muggia

2002

pegylated liposomal doxorubicin

50mg/m2

46

yes (40)

9.5

ns

8.2m

Calero

1991

epirubicin

80mg/m2

27

no

25.9

6m

9.5m

Figuras y tablas -
Table 4. Phase II studies: Anthracycline containing combinations
Table 5. Phase II studies: Taxane containing combinations

Study

Date

Drug

Dose

Number in study

Prior chemo (No.)

ORR (%)

Median PFS

Median OS

Ball

1996

Paclitaxel

250mg/m2

30

no

35.7

3.8m

9.5m

Lissoni

1996

Paclitaxel

175mg/m2

19

yes (19)

37

ns

ns

Ramondetta

2001

Paclitaxel

200mg/m2

13

no

77

ns

ns

Hornreich

2000

Paclitaxel

225mg/m2

27

no

40.7

ns

ns

Liposomal Doxorubicin

30mg/m2

Figuras y tablas -
Table 5. Phase II studies: Taxane containing combinations
Table 6. Phase II studies: Miscellaneous single agents

Study

Date

Drug

Dose

Number in Study

ORR (%)

Median PFS

Median OS

Barton

1990

ifosfamide

5g/m2

16

12.5

ns

5m

Sutton

1994

ifosfamide

6g/m2

52

15

ns

ns

Sutton

1996

ifosfamide

6g/m2

37

24

ns

ns

Seski

1981

hexamethylmelamine

8mg/kg/day

20

30

ns

ns

Thigpen

1988

hexamethylmelamine

3920mg/m2

38

8

ns

ns

Slayton

1982

etoposide

300mg/m2

29

3

ns

ns

Rose

1996

etoposide

1050mg/m2

26

0

ns

ns

Poplin

1999

etoposide

1050mg

47

13.6

4m

11m

Muss

1991

teniposide

160mg/m2

26

9

1.9m

6.4m

Hilgers

1985

mitoxantrone

10‐12mg/m2

15

0

ns

17wks

Muss

1987

mitoxantrone

12mg/m2

19

5

1.8m

2.1m

Veenhof

1990

mitoxantrone

14mg/m2

20

0

ns

ns

Malviya

1996

piroxantrone

150mg/m2

22

6

ns

11m

Thigpen

1987

vinblastine

7.5mg/m2

41

11

ns

4m

Broun

1993

vincristine

1.4mg/m2

36

18

ns

ns

Chauvergne

1993

pirarubicin

25mg/m2

28

9

ns

ns

Green

1991

esorubicin

30mg/m2

31

0

ns

154days

Hakes

1987

idarubicin

12.5mg/m2

25

9

ns

ns

Muss

1990

methotrexate

40mg/m2

33

6

2.9m

6.7m

Von Hoff

1991

fludarabine

90mg/m2

20

0

ns

ns

Malviya

1994

amonafide

1500mg/m2

38

5

ns

8m

Moore

1999

dactinomycin

2mg/m2

27

12

ns

ns

Muss

1993

echinomycin

1.5mg/m2

25

4

ns

ns

Homesley

1986

razoxane

1.5g/m2

24

0

ns

ns

Asbury

1990

aminothiadiazole

125mg/m2

22

0

ns

ns

Stehman

1983

dianhydrogalactitol

60mg/m2

21

5

ns

ns

Plaxe

2002

pyrazoloacridine

560mg/m2

28

4

ns

ns

Thigpen

1986

piperazinedione

9mg/m2

23

5

ns

ns

Figuras y tablas -
Table 6. Phase II studies: Miscellaneous single agents
Comparison 1. More versus less chemotherapy

Outcome or subgroup title

No. of studies

No. of participants

Statistical method

Effect size

1 Survival Show forest plot

6

1135

Peto Odds Ratio (95% CI)

0.91 [0.80, 1.03]

1.1 Cisplatin in combination versus cisplatin

1

30

Peto Odds Ratio (95% CI)

0.76 [0.36, 1.58]

1.2 Doxorubicin in combination versus doxorubicin

3

814

Peto Odds Ratio (95% CI)

0.97 [0.84, 1.11]

1.3 Doxorubicin/cisplatin plus other drugs versus doxorubicin/cisplatin

2

291

Peto Odds Ratio (95% CI)

0.75 [0.58, 0.97]

2 Progression‐free survival Show forest plot

6

1132

Peto Odds Ratio (95% CI)

0.80 [0.71, 0.90]

2.1 Cisplatin in combination versus cisplatin

1

30

Peto Odds Ratio (95% CI)

0.85 [0.37, 1.92]

2.2 Doxorubicin in combination versus doxorubicin

3

811

Peto Odds Ratio (95% CI)

0.86 [0.75, 0.99]

2.3 Doxorubicin/cisplatin plus other drugs versus doxorubicin/cisplatin

2

291

Peto Odds Ratio (95% CI)

0.64 [0.49, 0.82]

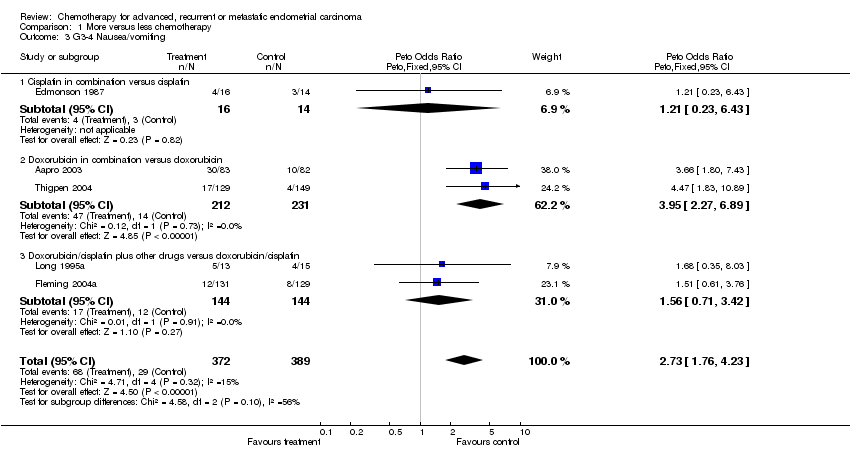
3 G3‐4 Nausea/vomiting Show forest plot

5

761

Peto Odds Ratio (Peto, Fixed, 95% CI)

2.73 [1.76, 4.23]

3.1 Cisplatin in combination versus cisplatin

1

30

Peto Odds Ratio (Peto, Fixed, 95% CI)

1.21 [0.23, 6.43]

3.2 Doxorubicin in combination versus doxorubicin

2

443

Peto Odds Ratio (Peto, Fixed, 95% CI)

3.95 [2.27, 6.89]

3.3 Doxorubicin/cisplatin plus other drugs versus doxorubicin/cisplatin

2

288

Peto Odds Ratio (Peto, Fixed, 95% CI)

1.56 [0.71, 3.42]

4 G3‐4 Diarrhoea/Other GI Show forest plot

5

761

Peto Odds Ratio (Peto, Fixed, 95% CI)

2.48 [1.19, 5.17]

4.1 Cisplatin in combination versus cisplatin

1

30

Peto Odds Ratio (Peto, Fixed, 95% CI)

6.52 [0.13, 331.51]

4.2 Doxorubicin in combination versus doxorubicin

2

443

Peto Odds Ratio (Peto, Fixed, 95% CI)

2.36 [0.83, 6.68]

4.3 Doxorubicin/cisplatin plus other drugs versus doxorubicin/cisplatin

2

288

Peto Odds Ratio (Peto, Fixed, 95% CI)

2.44 [0.84, 7.12]

5 G3‐4 Leukopenia Show forest plot

5

761

Peto Odds Ratio (Peto, Fixed, 95% CI)

1.30 [0.98, 1.73]

5.1 Cisplatin in combination versus cisplatin

1

30

Peto Odds Ratio (Peto, Fixed, 95% CI)

3.28 [0.76, 14.19]

5.2 Doxorubicin in combination versus doxorubicin

2

443

Peto Odds Ratio (Peto, Fixed, 95% CI)

2.51 [1.73, 3.65]

5.3 Doxorubicin/cisplatin plus other drugs versus doxorubicin/cisplatin

2

288

Peto Odds Ratio (Peto, Fixed, 95% CI)

0.43 [0.27, 0.68]

6 G3‐4 Thrombocytopenia Show forest plot

5

761

Peto Odds Ratio (Peto, Fixed, 95% CI)

4.44 [2.67, 7.38]

6.1 Cisplatin in combination versus cisplatin

1

30

Peto Odds Ratio (Peto, Fixed, 95% CI)

0.12 [0.00, 5.96]

6.2 Doxorubicin in combination versus doxorubicin

2

443

Peto Odds Ratio (Peto, Fixed, 95% CI)

4.12 [2.08, 8.14]

6.3 Doxorubicin/cisplatin plus other drugs versus doxorubicin/cisplatin

2

288

Peto Odds Ratio (Peto, Fixed, 95% CI)

5.65 [2.60, 12.28]

7 G3‐4 Anaemia Show forest plot

3

336

Peto Odds Ratio (Peto, Fixed, 95% CI)

5.32 [2.62, 10.81]

7.1 Cisplatin in combination versus cisplatin

1

30

Peto Odds Ratio (Peto, Fixed, 95% CI)

0.0 [0.0, 0.0]

7.2 Doxorubicin in combination versus doxorubicin

1

278

Peto Odds Ratio (Peto, Fixed, 95% CI)

5.32 [2.62, 10.81]

7.3 Doxorubicin/cisplatin plus other drugs versus doxorubicin/cisplatin

1

28

Peto Odds Ratio (Peto, Fixed, 95% CI)

0.0 [0.0, 0.0]

8 G3‐4 Alopecia Show forest plot

3

223

Peto Odds Ratio (Peto, Fixed, 95% CI)

1.86 [1.01, 3.42]

8.1 Cisplatin in combination versus cisplatin

1

30

Peto Odds Ratio (Peto, Fixed, 95% CI)

10.63 [2.01, 56.35]

8.2 Doxorubicin in combination versus doxorubicin

1

165

Peto Odds Ratio (Peto, Fixed, 95% CI)

1.42 [0.74, 2.74]

8.3 Doxorubicin/cisplatin plus other drugs versus doxorubicin/cisplatin

1

28

Peto Odds Ratio (Peto, Fixed, 95% CI)

0.0 [0.0, 0.0]

9 G3‐4 Cardiotoxicity Show forest plot

3

471

Peto Odds Ratio (Peto, Fixed, 95% CI)

1.14 [0.42, 3.10]

9.1 Doxorubicin in combination versus doxorubicin

2

443

Peto Odds Ratio (Peto, Fixed, 95% CI)

1.31 [0.46, 3.68]

9.2 Doxorubicin/cisplatin plus other drugs versus doxorubicin/cisplatin

1

28

Peto Odds Ratio (Peto, Fixed, 95% CI)

0.15 [0.00, 7.87]

10 G3‐4 Fever/infection Show forest plot

4

501

Peto Odds Ratio (Peto, Fixed, 95% CI)

4.36 [1.39, 13.71]

10.1 Cisplatin in combination versus cisplatin

1

30

Peto Odds Ratio (Peto, Fixed, 95% CI)

0.0 [0.0, 0.0]

10.2 Doxorubicin in combination versus doxorubicin

2

443

Peto Odds Ratio (Peto, Fixed, 95% CI)

5.95 [1.80, 19.69]

10.3 Doxorubicin/cisplatin plus other drugs versus doxorubicin/cisplatin

1

28

Peto Odds Ratio (Peto, Fixed, 95% CI)

0.15 [0.00, 7.87]

11 G3‐4 Stomatitis/mucositis Show forest plot

3

318

Peto Odds Ratio (Peto, Fixed, 95% CI)

2.92 [0.61, 14.06]

11.1 Cisplatin in combination versus cisplatin

1

30

Peto Odds Ratio (Peto, Fixed, 95% CI)

0.0 [0.0, 0.0]

11.2 Doxorubicin/cisplatin plus other drugs versus doxorubicin/cisplatin

2

288

Peto Odds Ratio (Peto, Fixed, 95% CI)

2.92 [0.61, 14.06]

12 G3‐4 Neurological toxicity Show forest plot

5

761

Peto Odds Ratio (Peto, Fixed, 95% CI)

5.81 [1.91, 17.61]

12.1 Cisplatin in combination versus cisplatin

1

30

Peto Odds Ratio (Peto, Fixed, 95% CI)

0.0 [0.0, 0.0]

12.2 Doxorubicin in combination versus doxorubicin

2

443

Peto Odds Ratio (Peto, Fixed, 95% CI)

0.15 [0.00, 7.88]

12.3 Doxorubicin/cisplatin plus other drugs versus doxorubicin/cisplatin

2

288

Peto Odds Ratio (Peto, Fixed, 95% CI)

7.95 [2.50, 25.26]

13 G3‐4 Renal/GU Show forest plot

3

566

Peto Odds Ratio (Peto, Fixed, 95% CI)

3.55 [1.02, 12.40]

13.1 Doxorubicin in combination versus doxorubicin

1

278

Peto Odds Ratio (Peto, Fixed, 95% CI)

8.76 [0.90, 85.46]

13.2 Doxorubicin/cisplatin plus other drugs versus doxorubicin/cisplatin

2

288

Peto Odds Ratio (Peto, Fixed, 95% CI)

2.41 [0.54, 10.74]

Figuras y tablas -
Comparison 1. More versus less chemotherapy