Psicoterapia individual para el tratamiento ambulatorio de adultos con anorexia nerviosa
Información
- DOI:
- https://doi.org/10.1002/14651858.CD003909.pub2Copiar DOI

- Base de datos:
-
- Cochrane Database of Systematic Reviews
- Versión publicada:
-
- 27 julio 2015see what's new
- Tipo:
-
- Intervention
- Etapa:
-
- Review
- Grupo Editorial Cochrane:
-
Grupo Cochrane de Trastornos mentales comunes
- Copyright:
-
- Copyright © 2018 The Cochrane Collaboration. Published by John Wiley & Sons, Ltd.
Cifras del artículo
Altmetric:
Citado por:
Autores
Contributions of authors
Phillipa Hay prepared the protocol for this review, was responsible for the initial data searches, and together with Angélica Claudino and Stephen Touyz (2006 update) for quality checking of data extraction and entry. This updated review is written by Phillipa Hay, and all the co‐review authors provided commentary on the findings and the conclusions. Phillipa Hay was responsible for the data searches, and all review authors for critical appraisal of newly‐identified trials and text of the 2015 update.
Sources of support
Internal sources
-
The University of Adelaide, Department of Psychiatry, Australia.
-
University of Western Sydney School of Medicine 2008 summer scholarship to Mr Ekmejian, Australia.
External sources
-
No sources of support supplied
Declarations of interest
In the past PH has received reimbursement of expenses for speaking at medical meetings and attending symposia from Astra‐Zeneca, Solvay Pharmaceuticals, Bristol‐Myers Squibb, and Pfizer Pharmaceuticals, and for educational training for family doctors from Bristol‐Myers Squibb, Pfizer Pharmaceuticals and Lundbeck and has been funded by Jansen‐Cilag to attend educational symposia (none in the past 10 years).
PH and ST receive royalties from McGraw Hill Pubs and honoraria from Biomed Central.
ST has received honoraria for consultancy to a Shire Pharmaceuticals Advisory Board.
AC has received reimbursement for speaking at medical meetings or attending symposia from Eli‐Lilly and Lundbeck in the past (last in 2010).
GAB has no conflicts to declare.
PH and ST are authors on a trial deemed ineligible (Touyz 2013) and two ongoing trials referenced in this review (ACTRN12610000585022; ACTRN12611000725965).
Acknowledgements
We thank Dr Kay Walker and Natalia Blumenfeld who provided invaluable help with searches and initial data extraction in the first version of this review. The Royal Australian and New Zealand College of Psychiatrists' funding for the development of Practice Guidelines for the treatment of anorexia nervosa provided the impetus for Professor Hay and Professor Ben‐Tovim in the first stages of this review. We thank Josue Bacaltchuk, Roanna Byrne, Avedis Ekmejian and Poh Yee Yong, who were authors in earlier versions of this review.
Version history
| Published | Title | Stage | Authors | Version |
| 2015 Jul 27 | Individual psychological therapy in the outpatient treatment of adults with anorexia nervosa | Review | Phillipa J Hay, Angélica M Claudino, Stephen Touyz, Ghada Abd Elbaky | |
| 2003 Oct 20 | Individual psychotherapy in the outpatient treatment of adults with anorexia nervosa | Review | Phillipa PJ Hay, Josué Bacaltchuk, Roanna T Byrnes, Angélica M Claudino, Avedis A Ekmejian, Poh Yee Yong | |
Differences between protocol and review
For the 2006 update, we altered the inclusion criteria to exclude studies with greater than 50% non‐completion rate.
For the 2015 update, the methods of this review have applied the current 'Risk of bias' tool. We have provided more detail on the types of studies, participants and outcomes.
We amended the Types of participants section to clarify that at least 50% of a study's participants had to be older than16 years old for the study to be included.
We added information to the Methods on the timing of outcome assessment and how we implemented a hierarchy for choosing outcome measures.
We have removed the subgroup analyses listed in the protocol as we decided they were not relevant to anorexia nervosa.
We have added a reference to denote the 2013 edition of DSM diagnostic criteria and have modified Appendix 1 to depict these current criteria.
The Zipfel 2014 trial had two arms of an individual psychotherapy as defined in this review, i.e. focal psychodynamic therapy (FPDT) and cognitive behavioural therapy (CBT). Although our option in the protocol was to combine these two relevant experimental intervention groups into a single group, this would have resulted in loss of information for a meta‐analysis of CBT versus a control therapy. We therefore elected to do a third option (as described by Higgins 2011 section 16.5.4) and divided the data from the control therapy, Optimised TAU, evenly among the comparisons, keeping the means and SD constant to avoid double‐counting of Optimised TAU. The same procedure was followed in the three‐armed McIntosh 2005 study.
We have added 'Summary of findings' tables.
Keywords
MeSH
Medical Subject Headings (MeSH) Keywords
Medical Subject Headings Check Words
Adolescent; Adult; Female; Humans; Male;
PICO

Study flow diagram.

Risk of bias graph: review authors' judgements about each risk of bias item presented as percentages across all included studies.

Risk of bias summary: review authors' judgements about each risk of bias item for each included study.
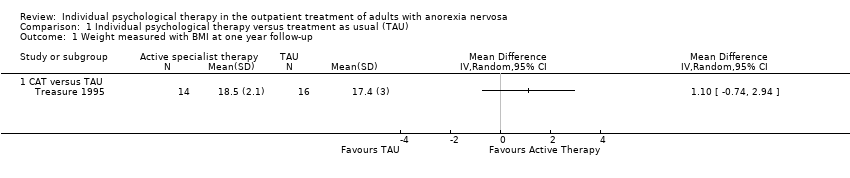
Comparison 1 Individual psychological therapy versus treatment as usual (TAU), Outcome 1 Weight measured with BMI at one year follow‐up.

Comparison 1 Individual psychological therapy versus treatment as usual (TAU), Outcome 2 Recovery not achieved according to Morgan and Russell narrow categories or similar.

Comparison 1 Individual psychological therapy versus treatment as usual (TAU), Outcome 3 N participants not completing the trial for any reason.

Comparison 1 Individual psychological therapy versus treatment as usual (TAU), Outcome 4 Recovery not achieved according to the Morgan 1988 broader scale ratings of average outcome or similar.
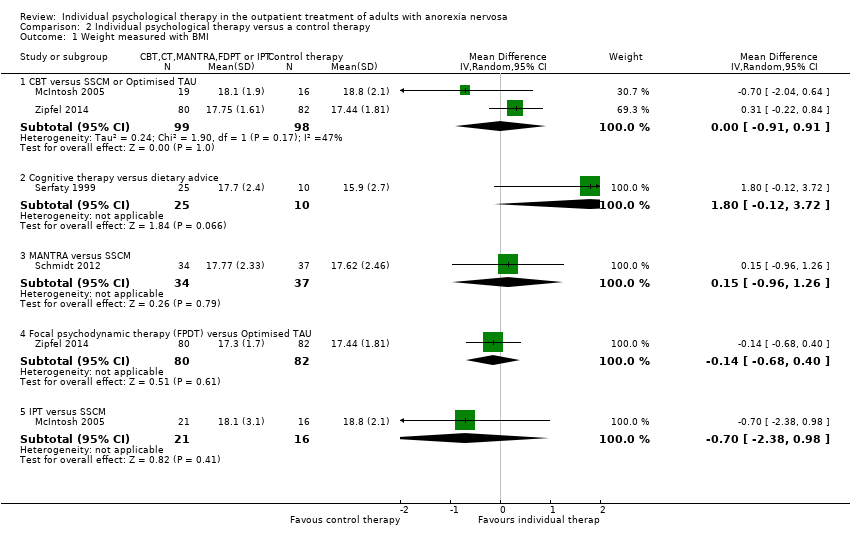
Comparison 2 Individual psychological therapy versus a control therapy, Outcome 1 Weight measured with BMI.

Comparison 2 Individual psychological therapy versus a control therapy, Outcome 2 Recovery not achieved according to Morgan and Russell narrow categories or similar.
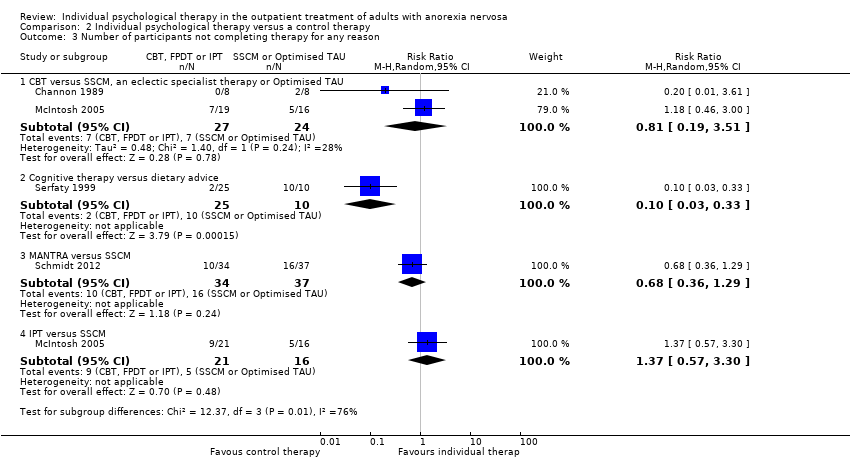
Comparison 2 Individual psychological therapy versus a control therapy, Outcome 3 Number of participants not completing therapy for any reason.

Comparison 2 Individual psychological therapy versus a control therapy, Outcome 4 Mean eating disorder symptoms score.

Comparison 2 Individual psychological therapy versus a control therapy, Outcome 5 General psychiatric symptoms.

Comparison 2 Individual psychological therapy versus a control therapy, Outcome 6 Level of depression measured with the Hamilton Depression Rating Scale (HDRS).

Comparison 2 Individual psychological therapy versus a control therapy, Outcome 7 Recovery not achieved according to the Morgan and Russell categories or similar at long term follow‐up.

Comparison 2 Individual psychological therapy versus a control therapy, Outcome 8 Weight measured with BMI at long‐term follow‐up.

Comparison 2 Individual psychological therapy versus a control therapy, Outcome 9 Mean eating disorder symptom score at long term follow‐up.

Comparison 2 Individual psychological therapy versus a control therapy, Outcome 10 General psychiatric symptoms at long‐term follow‐up.
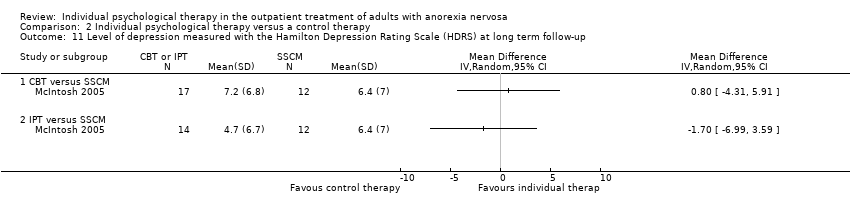
Comparison 2 Individual psychological therapy versus a control therapy, Outcome 11 Level of depression measured with the Hamilton Depression Rating Scale (HDRS) at long term follow‐up.

Comparison 3 Individual psychological therapy versus another individual psychological therapy, Outcome 1 Weight measured with BMI, or change in BMI.
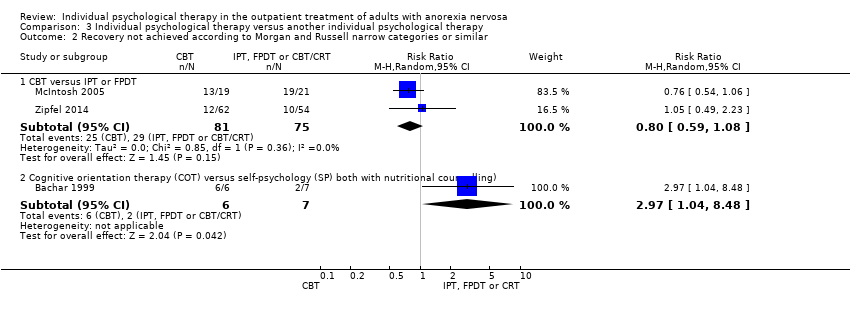
Comparison 3 Individual psychological therapy versus another individual psychological therapy, Outcome 2 Recovery not achieved according to Morgan and Russell narrow categories or similar.
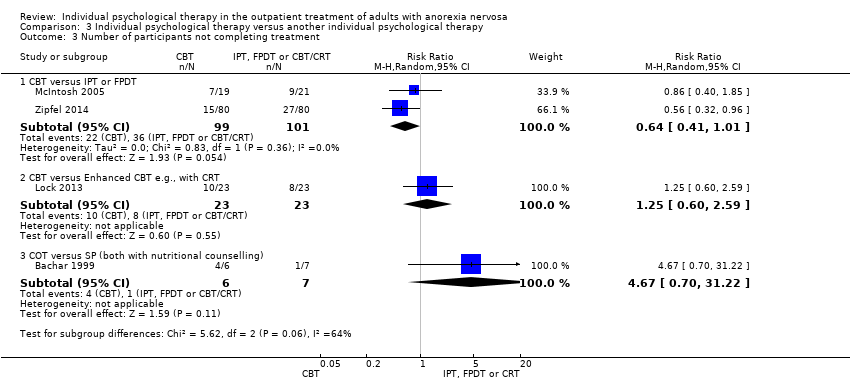
Comparison 3 Individual psychological therapy versus another individual psychological therapy, Outcome 3 Number of participants not completing treatment.

Comparison 3 Individual psychological therapy versus another individual psychological therapy, Outcome 4 Mean eating disorder symptom scores at end of treatment.

Comparison 3 Individual psychological therapy versus another individual psychological therapy, Outcome 5 General psychiatric symptoms.
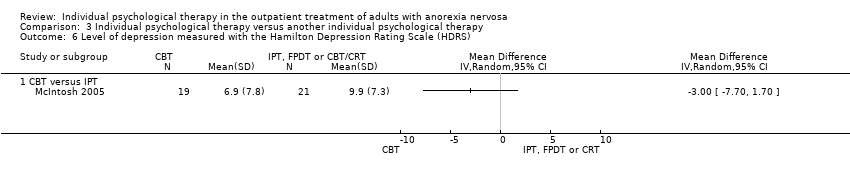
Comparison 3 Individual psychological therapy versus another individual psychological therapy, Outcome 6 Level of depression measured with the Hamilton Depression Rating Scale (HDRS).

Comparison 3 Individual psychological therapy versus another individual psychological therapy, Outcome 7 Mean eating disorder symptoms scores at long term follow‐up.
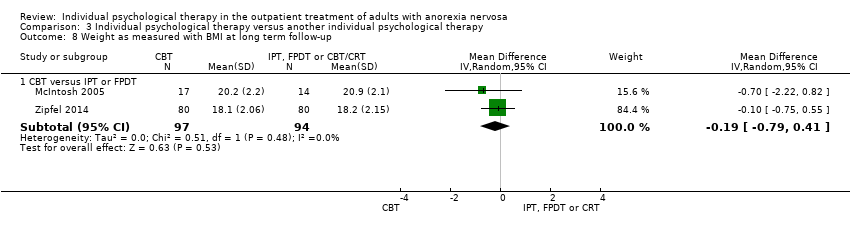
Comparison 3 Individual psychological therapy versus another individual psychological therapy, Outcome 8 Weight as measured with BMI at long term follow‐up.

Comparison 3 Individual psychological therapy versus another individual psychological therapy, Outcome 9 Recovery not achieved according to the Morgan and Russell categorical outcome or similar at long term follow‐up.
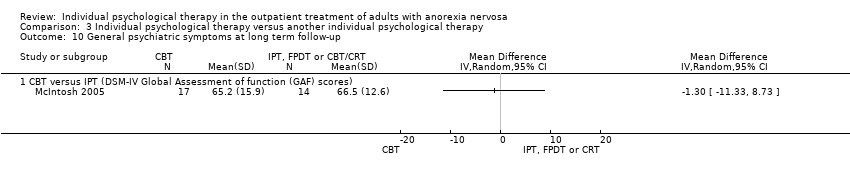
Comparison 3 Individual psychological therapy versus another individual psychological therapy, Outcome 10 General psychiatric symptoms at long term follow‐up.

Comparison 3 Individual psychological therapy versus another individual psychological therapy, Outcome 11 Level of depression measured with the Hamilton Depression Rating Scale (HDRS) at long term follow‐up.

Comparison 4 Individual psychological therapy versus wait‐list control, Outcome 1 Number not achieving remission defined by normal: body weight, psychology, test results, eating behaviour & social activities.
| Individual psychological therapy compared to treatment as usual (TAU) in the outpatient treatment of adults with anorexia nervosa | ||||||
| Patient or population: Adults and older adolescents with anorexia nervosa Settings: Outpatients Intervention: Cognitive Analytic Therapy (CAT) or Focal Psychoanalytic Psychotherapy (FPT) Comparison: Treatment as Usual (TAU) | ||||||
| Outcomes | Anticipated absolute effects (95% CI) | Relative effect | No of Participants | Quality of the evidence | Comments | |
| Assumed risk | Corresponding risk | |||||
| TAU | CAT or FPT | |||||
| Weight measured with BMI at one year follow‐up ‐ CAT versus TAU | The mean weight measured with BMI at 12 months follow‐up in the control group was 17.4 kg/m² | The mean weight measured with BMI at 12 months follow‐up in the CAT group was 1.1 higher (0.74 lower to 2.94 higher) | ‐ | 30 (1 RCT) | ⊕⊝⊝⊝ | This difference in BMI was not significant. |
| Recovery not achieved according to Morgan and Russell narrow categories or similar at end of 1 year FPT treatment ‐ FPT versus TAU | Study population | RR 0.70 (0.51 to 0.97) | 40 (1 RCT) | ⊕⊝⊝⊝ | This difference was significant. | |
| 947 per 1000 | 663 per 1000 | |||||
| Recovery not achieved according to Morgan and Russell narrow categories or similar at end of 1 year follow‐up‐ CAT versus TAU | Study population | RR RR 0.78 (0.61 to 1.00) | 71 | ⊕⊝⊝⊝ | This difference was not significant.There was consistency across RCTs | |
| 829 per 1000 | 646 per 1000 | |||||
| *The basis for the assumed risk (e.g. the median control group risk across studies) is provided in footnotes. The corresponding risk (and its 95% confidence interval) is based on the assumed risk in the comparison group and the relative effect of the intervention (and its 95% CI). | ||||||
| GRADE Working Group grades of evidence | ||||||
| 1. In both RCTs risk of bias was high, samples were small and small effects reported: downgraded the evidence by 3 points | ||||||
| Individual psychological therapy compared to a control therapy in the outpatient treatment of adults with anorexia nervosa | ||||||
| Patient or population: Adults and older adolescents with anorexia nervosa Settings: Outpatients Interventions: Cognitive Behavioural Therapy (CBT), MANTRA, Focal psychodynamic Psychotherapy (FPDT), Interpersonal Psychotherapy (IPT) Comparisons: Specialist Supportive Clinical Managment (SSCM), Optimised treatment as usual (TAU) | ||||||
| Outcomes | Anticipated absolute effects (95% CI) | Relative effect | No of Participants | Quality of the evidence | Comments | |
| Assumed risk | Corresponding risk | |||||
| Control therapy | Individual psychological therapy | |||||
| Weight measured with BMI ‐ CBT versus SSCM or Optimised TAU at end of treatment periods | The mean BMI ranged across control groups from | The mean BMI in the intervention groups was (‐0.91 to 0.91) | ‐ | 197 (2 RCTs) | ⊕⊕⊝⊝ low1 | This difference was not significant. |
| Weight measured with BMI ‐ Cognitive therapy versus dietary advice at end of treatment periods | The mean weight measured with BMI was 15.9 kg/m². | The mean BMI in the intervention group was | ‐ | 35 (1 RCT) | ⊕⊝⊝⊝ | This difference was not significant. |
| Weight measured with BMI ‐ MANTRA versus SSCM at end of treatment periods | The mean weight measured with BMI was 17.62 kg/m². | The mean BMI in the intervention group was 0.15 higher (‐0.04 to 0.34) | ‐ | 71 (1 RCT) | ⊕⊝⊝⊝ | This difference was not significant. |
| Weight measured with BMI ‐ Focal psychodynamic therapy (FPDT) versus Optimised TAU at end of treatment periods | The mean weight measured with BMI was 17.44 kg/m². | The mean BMI in the intervention group was | ‐ | 162 (1 RCT) | ⊕⊕⊝⊝ low4 | This difference was not significant.Low risk of bias, a large RCT |
| Weight measured with BMI ‐ IPT versus SSCM at end of treatment periods | The mean weight measured with BMI was 18.8 kg/m². | The mean BMI in the intervention group was 0.70 lower (‐2.38 to 0.98). | ‐ | 37(1 RCT) | ⊕⊝⊝⊝ | This difference was not significant. |
| Recovery according to Morgan and Russell narrow categories or similar ‐ CBT versus SSCM (Global outcome rated 3 or 4) at end of treatment periods | Study population | RR 1.56 (0.83 to 2.95) | 37 (1 RCT) | ⊕⊝⊝⊝ | This difference was not significant. No data available on CBT versus Optimised TAU | |
| 357 per 1000 | 325 per 1000 | |||||
| Recovery not achieved according to Morgan and Russell narrow categories or similar ‐ FPDT versus Optimised TAU at end of treatment periods | Study population | RR 0.57 (0.28 to 1.17) | 94 | ⊕⊕⊕⊝moderate4 | This difference was not significant. | |
| 325 per 1000 | 185 per 1000 | |||||
| Recovery not achieved according to Morgan and Russell narrow categories or similar ‐ IPT versus SSCM at end of treatment periods | Study population | RR 2.07 (1.17 to 3.67) | 37 | ⊕⊝⊝⊝ | This difference favouring SSCM was significant. | |
| 438 per 1000 | 906 per 1000 | |||||
| *The basis for the assumed risk (e.g. the median control group risk across studies) is provided in footnotes. The corresponding risk (and its 95% confidence interval) is based on the assumed risk in the comparison group and the relative effect of the intervention (and its 95% CI). | ||||||
| GRADE Working Group grades of evidence | ||||||
| 1. Risk of bias low in both RCTs, 1 RCT was very small, the findings were not consistent across the 2 RCTs for benefit of CBT and effects were small. 2. Risk of bias high and in only 1 small RCT 3. Low risk of bias but only 1 small RCT 4. Low risk of bias but only 1 RCT | ||||||
| Individual psychological therapy compared with another individual psychological therapy for anorexia nervosa. | ||||||
| Patient or population: Adults and older adolescents with anorexia nervosa Settings: Outpatients Interventions: Cognitive Behavioural Therapy (CBT) or Cognitive Orientation Therapy (COT) Comparisons: Focal Psychodynamic Psychotherapy (FPDT), Interpersonal Psychotherapy (IPT), CBT enhanced with cognitive remediation therapy (CRT) or Self psychology | ||||||
| Outcomes | Illustrative comparative risks* (95% CI) | Relative effect | No of Participants | Quality of the evidence | Comments | |
| Assumed risk | Corresponding risk | |||||
| Alternate therapy | CBT or COT | |||||
| Weight measured with BMI ‐ CBT versus IPT or FPDT at end of treatment periods | The mean weight measured with BMI ‐ CBT versus IPT or FPDT in the control group was 17.3 kg/m². | The mean weight measured with BMI ‐ CBT versus IPT or FPDT in the intervention group was 0.41 higher (‐0.08 to 0.89). | ‐ | 200 | ⊕⊕⊝⊝ | This difference was not significant. |
| Weight measured with change in BMI ‐ CBT versus Enhanced CBT e.g., with CRT at end of treatment periods | The mean BMI change ‐ CBT versus CBT enhanced with CRT in the control group was 0.512. | The mean BMI change ‐ CBT versus CBT enhanced with CRT, in the intervention group was 0.17 higher (‐0.64 to 0.99). | ‐ | 46 | ⊕⊝⊝⊝ | This difference was not significant. |
| Recovery not achieved according to Morgan and Russell narrow categories or similar ‐ CBT versus IPT or FPDT at end of treatment periods | Study population | RR 0.80 (0.59 to 1.08) | 156 (2 RCTs) | ⊕⊕⊝⊝ | This difference was not significant. | |
| 387 per 1000 | 309 per 1000 | |||||
| Recovery not achieved according to Morgan and Russell narrow categories or similar ‐ Cognitive orientation therapy (COT) versus self psychology (SP) both with nutritional counselling) at end of treatment periods | Study population | RR 2.97 (1.04 to 8.48) | 13 | ⊕⊝⊝⊝ | This difference favouring COT was significant. | |
| 286 per 1000 | 849 per 1000 | |||||
| *The basis for the assumed risk (e.g. the median control group risk across studies) is provided in footnotes. The corresponding risk (and its 95% confidence interval) is based on the assumed risk in the comparison group and the relative effect of the intervention (and its 95% CI). | ||||||
| GRADE Working Group grades of evidence | ||||||
| 1. Risk of bias low in both RCTs, 1 RCT was very small, the findings were not consistent across the 2 RCTs for benefit of CBT and effects were small. 2. Risk of bias unclear (allocation concealment) and only 1 small RCT. 3. Risk of bias high and only 1 small RCT. | ||||||
| Outcome or subgroup title | No. of studies | No. of participants | Statistical method | Effect size |
| 1 Weight measured with BMI at one year follow‐up Show forest plot | 1 | Mean Difference (IV, Random, 95% CI) | Totals not selected | |
| 1.1 CAT versus TAU | 1 | Mean Difference (IV, Random, 95% CI) | 0.0 [0.0, 0.0] | |
| 2 Recovery not achieved according to Morgan and Russell narrow categories or similar Show forest plot | 2 | Risk Ratio (M‐H, Random, 95% CI) | Subtotals only | |
| 2.1 FPT versus TAU | 1 | 40 | Risk Ratio (M‐H, Random, 95% CI) | 0.70 [0.51, 0.97] |
| 2.2 CAT versus TAU | 2 | 71 | Risk Ratio (M‐H, Random, 95% CI) | 0.78 [0.61, 1.00] |
| 3 N participants not completing the trial for any reason Show forest plot | 2 | Risk Ratio (M‐H, Random, 95% CI) | Subtotals only | |
| 3.1 FPT versus TAU | 1 | 40 | Risk Ratio (M‐H, Random, 95% CI) | 1.36 [0.59, 3.10] |
| 3.2 CAT versus TAU | 2 | 71 | Risk Ratio (M‐H, Random, 95% CI) | 1.05 [0.55, 2.02] |
| 4 Recovery not achieved according to the Morgan 1988 broader scale ratings of average outcome or similar Show forest plot | 1 | Mean Difference (IV, Random, 95% CI) | Totals not selected | |
| 4.1 CAT versus TAU | 1 | Mean Difference (IV, Random, 95% CI) | 0.0 [0.0, 0.0] | |
| Outcome or subgroup title | No. of studies | No. of participants | Statistical method | Effect size |
| 1 Weight measured with BMI Show forest plot | 4 | Mean Difference (IV, Random, 95% CI) | Subtotals only | |
| 1.1 CBT versus SSCM or Optimised TAU | 2 | 197 | Mean Difference (IV, Random, 95% CI) | ‐0.00 [‐0.91, 0.91] |
| 1.2 Cognitive therapy versus dietary advice | 1 | 35 | Mean Difference (IV, Random, 95% CI) | 1.80 [‐0.12, 3.72] |
| 1.3 MANTRA versus SSCM | 1 | 71 | Mean Difference (IV, Random, 95% CI) | 0.15 [‐0.96, 1.26] |
| 1.4 Focal psychodynamic therapy (FPDT) versus Optimised TAU | 1 | 162 | Mean Difference (IV, Random, 95% CI) | ‐0.14 [‐0.68, 0.40] |
| 1.5 IPT versus SSCM | 1 | 37 | Mean Difference (IV, Random, 95% CI) | ‐0.70 [‐2.38, 0.98] |
| 2 Recovery not achieved according to Morgan and Russell narrow categories or similar Show forest plot | 2 | Risk Ratio (M‐H, Random, 95% CI) | Subtotals only | |
| 2.1 CBT versus SSCM (Global outcome rated 3 or 4) or optimised TAU | 2 | 137 | Risk Ratio (M‐H, Random, 95% CI) | 0.97 [0.37, 2.54] |
| 2.2 FPDT versus Optimised TAU | 1 | 94 | Risk Ratio (M‐H, Random, 95% CI) | 0.57 [0.28, 1.17] |
| 2.3 IPT versus SSCM | 1 | 37 | Risk Ratio (M‐H, Random, 95% CI) | 2.07 [1.17, 3.67] |
| 3 Number of participants not completing therapy for any reason Show forest plot | 4 | Risk Ratio (M‐H, Random, 95% CI) | Subtotals only | |
| 3.1 CBT versus SSCM, an eclectic specialist therapy or Optimised TAU | 2 | 51 | Risk Ratio (M‐H, Random, 95% CI) | 0.81 [0.19, 3.51] |
| 3.2 Cognitive therapy versus dietary advice | 1 | 35 | Risk Ratio (M‐H, Random, 95% CI) | 0.10 [0.03, 0.33] |
| 3.3 MANTRA versus SSCM | 1 | 71 | Risk Ratio (M‐H, Random, 95% CI) | 0.68 [0.36, 1.29] |
| 3.4 IPT versus SSCM | 1 | 37 | Risk Ratio (M‐H, Random, 95% CI) | 1.37 [0.57, 3.30] |
| 4 Mean eating disorder symptoms score Show forest plot | 3 | Std. Mean Difference (IV, Random, 95% CI) | Subtotals only | |
| 4.1 CBT versus SSCM or Optimised TAU | 2 | 197 | Std. Mean Difference (IV, Random, 95% CI) | 0.05 [‐0.44, 0.54] |
| 4.2 MANTRA versus SSCM | 1 | 71 | Std. Mean Difference (IV, Random, 95% CI) | ‐0.11 [‐0.58, 0.35] |
| 4.3 FPDT versus Optimised TAU | 1 | 162 | Std. Mean Difference (IV, Random, 95% CI) | ‐0.09 [‐0.40, 0.22] |
| 4.4 IPT versus SSCM | 1 | 37 | Std. Mean Difference (IV, Random, 95% CI) | 1.17 [0.46, 1.88] |
| 5 General psychiatric symptoms Show forest plot | 1 | Mean Difference (IV, Random, 95% CI) | Totals not selected | |
| 5.1 CBT versus SSCM (DSM‐IV Global Assessment of function (GAF) scores) | 1 | Mean Difference (IV, Random, 95% CI) | 0.0 [0.0, 0.0] | |
| 5.2 IPT versus SSCM | 1 | Mean Difference (IV, Random, 95% CI) | 0.0 [0.0, 0.0] | |
| 6 Level of depression measured with the Hamilton Depression Rating Scale (HDRS) Show forest plot | 2 | Mean Difference (IV, Random, 95% CI) | Subtotals only | |
| 6.1 CBT versus SSCM | 1 | 35 | Mean Difference (IV, Random, 95% CI) | 0.10 [‐4.84, 5.04] |
| 6.2 MANTRA versus SSCM | 1 | 71 | Mean Difference (IV, Random, 95% CI) | ‐0.53 [‐4.03, 2.97] |
| 6.3 IPT versus SSCM | 1 | 37 | Mean Difference (IV, Random, 95% CI) | 3.1 [‐1.57, 7.77] |
| 7 Recovery not achieved according to the Morgan and Russell categories or similar at long term follow‐up Show forest plot | 1 | Risk Ratio (M‐H, Random, 95% CI) | Totals not selected | |
| 7.1 CBT versus SSCM | 1 | Risk Ratio (M‐H, Random, 95% CI) | 0.0 [0.0, 0.0] | |
| 7.2 IPT versus SSCM | 1 | Risk Ratio (M‐H, Random, 95% CI) | 0.0 [0.0, 0.0] | |
| 8 Weight measured with BMI at long‐term follow‐up Show forest plot | 2 | Mean Difference (IV, Random, 95% CI) | Subtotals only | |
| 8.1 CBT versus SSCM or Optimised TAU | 2 | 191 | Mean Difference (IV, Random, 95% CI) | ‐0.02 [‐0.87, 0.82] |
| 8.2 FPDT versus Optimised TAU | 1 | 162 | Mean Difference (IV, Random, 95% CI) | 0.25 [‐0.44, 0.94] |
| 8.3 IPT versus SSCM | 1 | 26 | Mean Difference (IV, Random, 95% CI) | ‐0.40 [‐2.62, 1.82] |
| 9 Mean eating disorder symptom score at long term follow‐up Show forest plot | 2 | Std. Mean Difference (IV, Random, 95% CI) | Subtotals only | |
| 9.1 CBT versus SSCM or optimised TAU | 2 | 191 | Std. Mean Difference (IV, Random, 95% CI) | ‐0.23 [‐0.93, 0.47] |
| 9.2 FPDT versus Optimised TAU | 1 | 162 | Std. Mean Difference (IV, Random, 95% CI) | ‐0.05 [‐0.36, 0.26] |
| 9.3 IPT versus SSCM | 1 | 26 | Std. Mean Difference (IV, Random, 95% CI) | ‐0.73 [‐1.54, 0.07] |
| 10 General psychiatric symptoms at long‐term follow‐up Show forest plot | 1 | Mean Difference (IV, Random, 95% CI) | Totals not selected | |
| 10.1 CBT versus SSCM (DSM‐IV Global Assessment of function (GAF) scores) | 1 | Mean Difference (IV, Random, 95% CI) | 0.0 [0.0, 0.0] | |
| 10.2 IPT versus SSCM | 1 | Mean Difference (IV, Random, 95% CI) | 0.0 [0.0, 0.0] | |
| 11 Level of depression measured with the Hamilton Depression Rating Scale (HDRS) at long term follow‐up Show forest plot | 1 | Mean Difference (IV, Random, 95% CI) | Totals not selected | |
| 11.1 CBT versus SSCM | 1 | Mean Difference (IV, Random, 95% CI) | 0.0 [0.0, 0.0] | |
| 11.2 IPT versus SSCM | 1 | Mean Difference (IV, Random, 95% CI) | 0.0 [0.0, 0.0] | |
| Outcome or subgroup title | No. of studies | No. of participants | Statistical method | Effect size |
| 1 Weight measured with BMI, or change in BMI Show forest plot | 3 | Mean Difference (IV, Random, 95% CI) | Subtotals only | |
| 1.1 CBT versus IPT or FPDT | 2 | 200 | Mean Difference (IV, Random, 95% CI) | 0.41 [‐0.08, 0.89] |
| 1.2 CBT versus Enhanced CBT e.g., with CRT | 1 | 46 | Mean Difference (IV, Random, 95% CI) | 0.17 [‐0.64, 0.99] |
| 2 Recovery not achieved according to Morgan and Russell narrow categories or similar Show forest plot | 3 | Risk Ratio (M‐H, Random, 95% CI) | Subtotals only | |
| 2.1 CBT versus IPT or FPDT | 2 | 156 | Risk Ratio (M‐H, Random, 95% CI) | 0.80 [0.59, 1.08] |
| 2.2 Cognitive orientation therapy (COT) versus self‐psychology (SP) both with nutritional counselling) | 1 | 13 | Risk Ratio (M‐H, Random, 95% CI) | 2.97 [1.04, 8.48] |
| 3 Number of participants not completing treatment Show forest plot | 4 | Risk Ratio (M‐H, Random, 95% CI) | Subtotals only | |
| 3.1 CBT versus IPT or FPDT | 2 | 200 | Risk Ratio (M‐H, Random, 95% CI) | 0.64 [0.41, 1.01] |
| 3.2 CBT versus Enhanced CBT e.g., with CRT | 1 | 46 | Risk Ratio (M‐H, Random, 95% CI) | 1.25 [0.60, 2.59] |
| 3.3 COT versus SP (both with nutritional counselling) | 1 | 13 | Risk Ratio (M‐H, Random, 95% CI) | 4.67 [0.70, 31.22] |
| 4 Mean eating disorder symptom scores at end of treatment Show forest plot | 3 | Std. Mean Difference (IV, Random, 95% CI) | Subtotals only | |
| 4.1 CBT versus IPT (EDE Restraint score) or FPDT (EDI total score) | 2 | 200 | Std. Mean Difference (IV, Random, 95% CI) | ‐0.33 [‐1.00, 0.35] |
| 4.2 CBT versus Enhanced CBT e.g., with CRT (EDE Restraint scores) | 1 | 46 | Std. Mean Difference (IV, Random, 95% CI) | 0.33 [‐0.26, 0.91] |
| 5 General psychiatric symptoms Show forest plot | 1 | Mean Difference (IV, Random, 95% CI) | Totals not selected | |
| 5.1 CBT versus IPT (DSM‐IV Global Assessment of function (GAF) scores) | 1 | Mean Difference (IV, Random, 95% CI) | 0.0 [0.0, 0.0] | |
| 6 Level of depression measured with the Hamilton Depression Rating Scale (HDRS) Show forest plot | 1 | Mean Difference (IV, Random, 95% CI) | Totals not selected | |
| 6.1 CBT versus IPT | 1 | Mean Difference (IV, Random, 95% CI) | 0.0 [0.0, 0.0] | |
| 7 Mean eating disorder symptoms scores at long term follow‐up Show forest plot | 2 | Std. Mean Difference (IV, Random, 95% CI) | Subtotals only | |
| 7.1 CBT versus IPT (EDE restraint) or FPDT (EDI total scores) | 2 | 191 | Std. Mean Difference (IV, Random, 95% CI) | 0.07 [‐0.21, 0.36] |
| 8 Weight as measured with BMI at long term follow‐up Show forest plot | 2 | Mean Difference (IV, Random, 95% CI) | Subtotals only | |
| 8.1 CBT versus IPT or FPDT | 2 | 191 | Mean Difference (IV, Random, 95% CI) | ‐0.19 [‐0.79, 0.41] |
| 9 Recovery not achieved according to the Morgan and Russell categorical outcome or similar at long term follow‐up Show forest plot | 1 | Risk Ratio (M‐H, Random, 95% CI) | Totals not selected | |
| 9.1 CBT versus IPT (Global outcome rated 3 or 4) | 1 | Risk Ratio (M‐H, Random, 95% CI) | 0.0 [0.0, 0.0] | |
| 10 General psychiatric symptoms at long term follow‐up Show forest plot | 1 | Mean Difference (IV, Random, 95% CI) | Totals not selected | |
| 10.1 CBT versus IPT (DSM‐IV Global Assessment of function (GAF) scores) | 1 | Mean Difference (IV, Random, 95% CI) | 0.0 [0.0, 0.0] | |
| 11 Level of depression measured with the Hamilton Depression Rating Scale (HDRS) at long term follow‐up Show forest plot | 1 | Mean Difference (IV, Random, 95% CI) | Totals not selected | |
| 11.1 CBT versus IPT | 1 | Mean Difference (IV, Random, 95% CI) | 0.0 [0.0, 0.0] | |
| Outcome or subgroup title | No. of studies | No. of participants | Statistical method | Effect size |
| 1 Number not achieving remission defined by normal: body weight, psychology, test results, eating behaviour & social activities Show forest plot | 1 | Risk Ratio (M‐H, Random, 95% CI) | Totals not selected | |
| 1.1 Karolinski Institute Mandometer outpatient treatment versus wait‐list control group | 1 | Risk Ratio (M‐H, Random, 95% CI) | 0.0 [0.0, 0.0] | |