Psicoterapia individual para el tratamiento ambulatorio de adultos con anorexia nerviosa
Appendices
Appendix 1. DSM 5 criteria for anorexia nervosa
| DSM‐5 criteria adapted from APA 2013 |
| a. Restriction of energy intake relative to requirements leading to a significantly low body weight and/or failure to make expected weight gain during period of growth. |
Appendix 2. Searches for earlier versions of the review
Earlier searches were conducted in 2003, 2008 and 2012.
CCDANCTR Search (Studies and References) 2012
Free‐text = anorexi*
An additional search was also conducted at this time for eating disorders not otherwise specified.
CCDANCTR 2008:
CCDANCTR‐Studies:
Diagnosis = (Anorexia or "Eating Disorder*") and Intervention = (*therapy or counselling or educat*)
CCDANCTR‐References:
Keyword = ("Anorexia Nervosa" or "Eating Disorder*") and Free‐text = (*therap* or treatment or intervention* or counsel* or *educat* or training)
Other databases:
Supplementary searches were also conducted (2003, 2008) on the following databases:
-
Cochrane Central Register of Controlled Trials (CENTRAL)
-
CURRENT CONTENTS
-
EMBASE
-
EXTRAMED
-
MEDLINE
-
PSYCLIT
-
SCOPUS
Results:
For the first version of this review published in 2003, a total of 4673 studies, including papers and abstracts on therapy for people with anorexia nervosa were identified from the first searches. 839 studies were found from Current Contents, 2438 from MEDLINE, 1215 studies from PSYCLIT, 51 studies from the International Journal of Eating Disorders, and 130 studies found from the CCDANCTR search. After screening, we considered 46 of these studies potentially eligible and were published randomised controlled trials, and we included six.
The second updated search (2002 to December 2005) identified 4539 studies in the MEDLINE search and 58 in the CCDANCTR search, from which we identified one new trial for inclusion (McIntosh 2005), and we excluded one (Ball 2004). We excluded three trials identified from the MEDLINE search (Halmi 2005, Kong 2005, Pike 2003).
Appendix 3. Data extraction
Whether objectives and specification of main outcomes were determined a priori.
The sample size per group
The duration of treatment (weeks) and duration of follow‐up (months)
Whether a power calculation was reported
The method of random allocation
The concealment of randomisation (this refers to protecting details on how the allocation code from those involved in participant recruitment)
Whether there was a clear description of treatment (and what was the therapy involved)
Blinding method
The source of participants, whether this reflected a representative sample
The diagnostic criteria used
The recording of exclusion criteria, number of exclusions and refusals
Demographic information of participants (age, gender, etc.)
Information on compliance, treatment integrity adherence, dropouts, and adverse side effects
Outcome assessments and measures
Outcomes of the randomisation
What happened to withdrawals in the analyses and how analyses were presented and appropriateness of statistical methods
Whether conclusions appears justified
Whether author interests were declared
Outcome data, including numbers per group meeting criteria for recovery and/or significant improvement, completing treatment, mean BMI per group, remission rates, global treatment and functional outcomes and mean scores on any quantitative continuous data outcome measure.

Study flow diagram.

Risk of bias graph: review authors' judgements about each risk of bias item presented as percentages across all included studies.

Risk of bias summary: review authors' judgements about each risk of bias item for each included study.
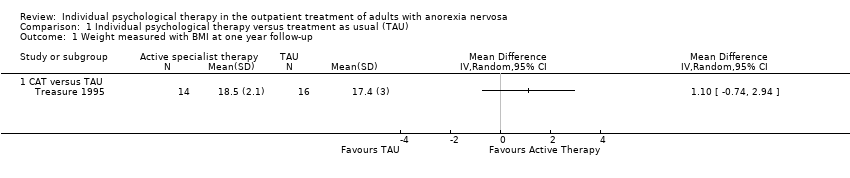
Comparison 1 Individual psychological therapy versus treatment as usual (TAU), Outcome 1 Weight measured with BMI at one year follow‐up.

Comparison 1 Individual psychological therapy versus treatment as usual (TAU), Outcome 2 Recovery not achieved according to Morgan and Russell narrow categories or similar.

Comparison 1 Individual psychological therapy versus treatment as usual (TAU), Outcome 3 N participants not completing the trial for any reason.

Comparison 1 Individual psychological therapy versus treatment as usual (TAU), Outcome 4 Recovery not achieved according to the Morgan 1988 broader scale ratings of average outcome or similar.
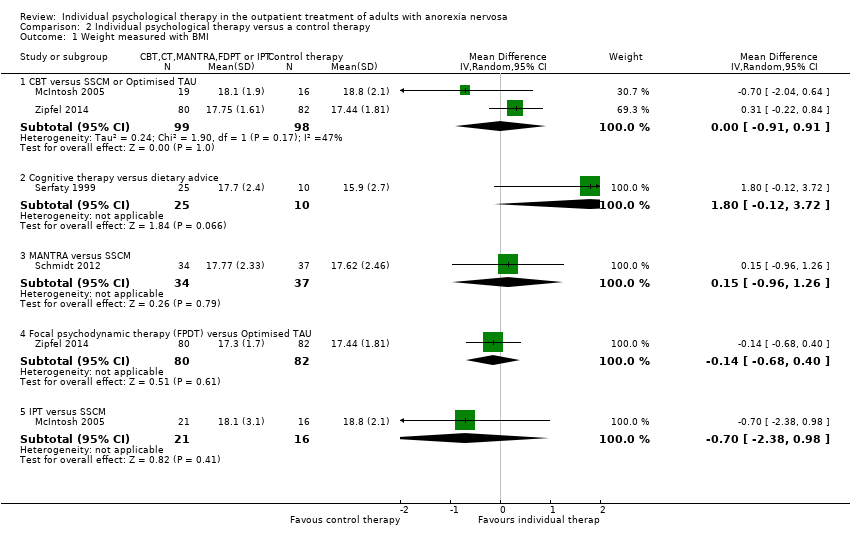
Comparison 2 Individual psychological therapy versus a control therapy, Outcome 1 Weight measured with BMI.

Comparison 2 Individual psychological therapy versus a control therapy, Outcome 2 Recovery not achieved according to Morgan and Russell narrow categories or similar.
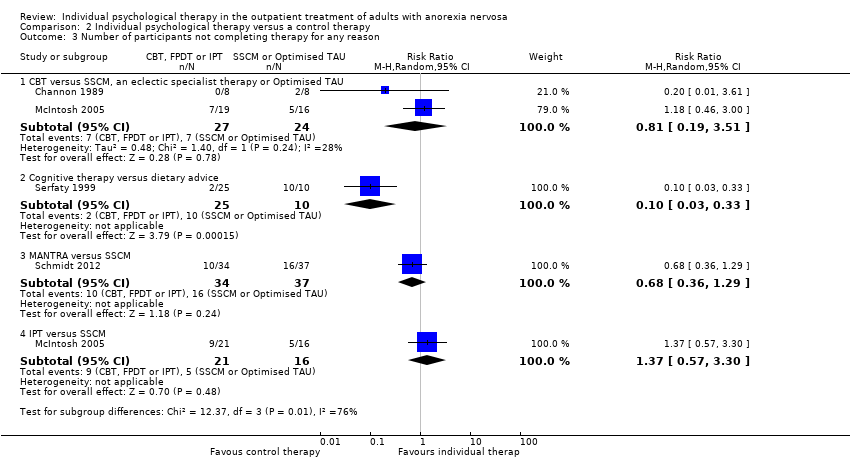
Comparison 2 Individual psychological therapy versus a control therapy, Outcome 3 Number of participants not completing therapy for any reason.

Comparison 2 Individual psychological therapy versus a control therapy, Outcome 4 Mean eating disorder symptoms score.

Comparison 2 Individual psychological therapy versus a control therapy, Outcome 5 General psychiatric symptoms.

Comparison 2 Individual psychological therapy versus a control therapy, Outcome 6 Level of depression measured with the Hamilton Depression Rating Scale (HDRS).

Comparison 2 Individual psychological therapy versus a control therapy, Outcome 7 Recovery not achieved according to the Morgan and Russell categories or similar at long term follow‐up.

Comparison 2 Individual psychological therapy versus a control therapy, Outcome 8 Weight measured with BMI at long‐term follow‐up.

Comparison 2 Individual psychological therapy versus a control therapy, Outcome 9 Mean eating disorder symptom score at long term follow‐up.

Comparison 2 Individual psychological therapy versus a control therapy, Outcome 10 General psychiatric symptoms at long‐term follow‐up.
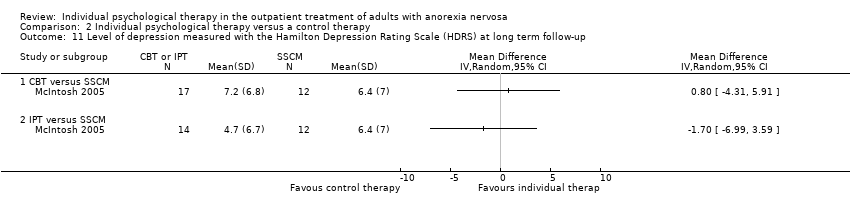
Comparison 2 Individual psychological therapy versus a control therapy, Outcome 11 Level of depression measured with the Hamilton Depression Rating Scale (HDRS) at long term follow‐up.

Comparison 3 Individual psychological therapy versus another individual psychological therapy, Outcome 1 Weight measured with BMI, or change in BMI.
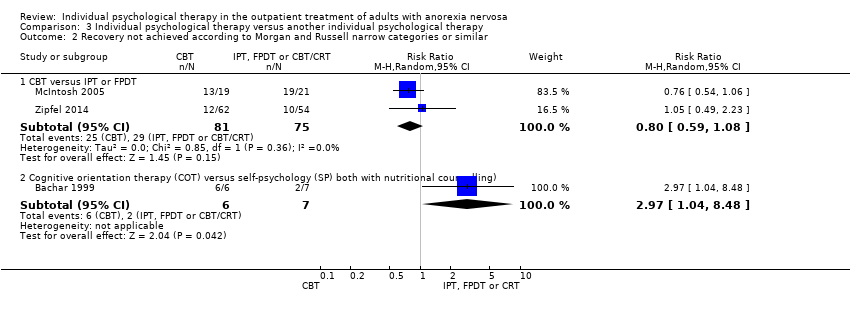
Comparison 3 Individual psychological therapy versus another individual psychological therapy, Outcome 2 Recovery not achieved according to Morgan and Russell narrow categories or similar.
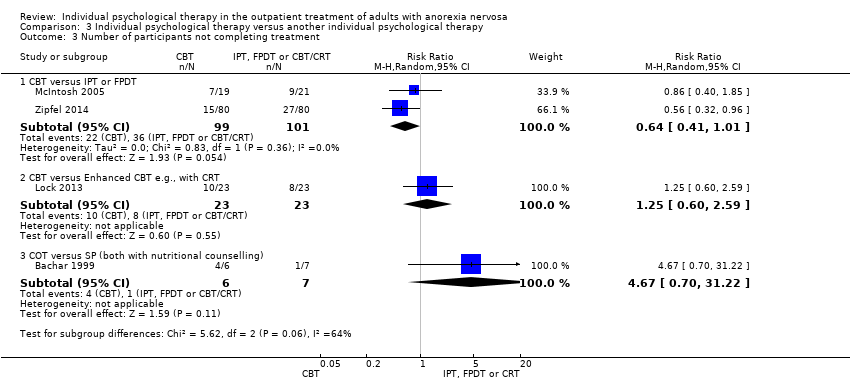
Comparison 3 Individual psychological therapy versus another individual psychological therapy, Outcome 3 Number of participants not completing treatment.

Comparison 3 Individual psychological therapy versus another individual psychological therapy, Outcome 4 Mean eating disorder symptom scores at end of treatment.

Comparison 3 Individual psychological therapy versus another individual psychological therapy, Outcome 5 General psychiatric symptoms.
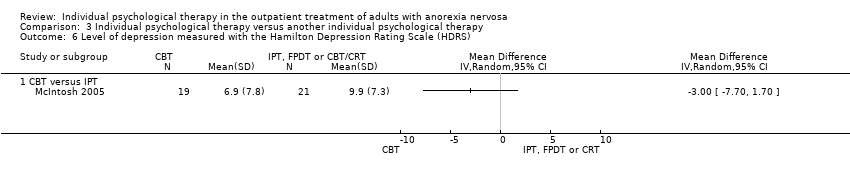
Comparison 3 Individual psychological therapy versus another individual psychological therapy, Outcome 6 Level of depression measured with the Hamilton Depression Rating Scale (HDRS).

Comparison 3 Individual psychological therapy versus another individual psychological therapy, Outcome 7 Mean eating disorder symptoms scores at long term follow‐up.
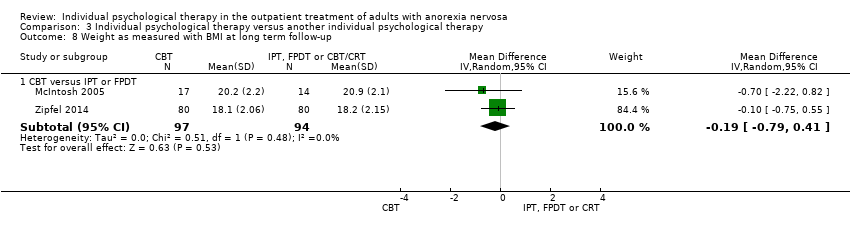
Comparison 3 Individual psychological therapy versus another individual psychological therapy, Outcome 8 Weight as measured with BMI at long term follow‐up.

Comparison 3 Individual psychological therapy versus another individual psychological therapy, Outcome 9 Recovery not achieved according to the Morgan and Russell categorical outcome or similar at long term follow‐up.
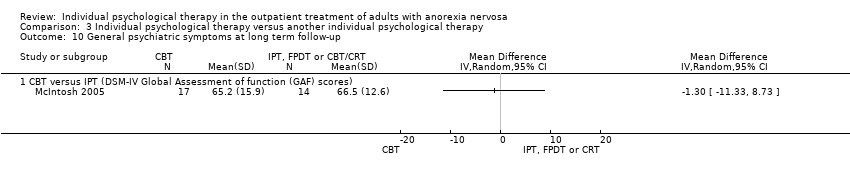
Comparison 3 Individual psychological therapy versus another individual psychological therapy, Outcome 10 General psychiatric symptoms at long term follow‐up.

Comparison 3 Individual psychological therapy versus another individual psychological therapy, Outcome 11 Level of depression measured with the Hamilton Depression Rating Scale (HDRS) at long term follow‐up.

Comparison 4 Individual psychological therapy versus wait‐list control, Outcome 1 Number not achieving remission defined by normal: body weight, psychology, test results, eating behaviour & social activities.
| Individual psychological therapy compared to treatment as usual (TAU) in the outpatient treatment of adults with anorexia nervosa | ||||||
| Patient or population: Adults and older adolescents with anorexia nervosa Settings: Outpatients Intervention: Cognitive Analytic Therapy (CAT) or Focal Psychoanalytic Psychotherapy (FPT) Comparison: Treatment as Usual (TAU) | ||||||
| Outcomes | Anticipated absolute effects (95% CI) | Relative effect | No of Participants | Quality of the evidence | Comments | |
| Assumed risk | Corresponding risk | |||||
| TAU | CAT or FPT | |||||
| Weight measured with BMI at one year follow‐up ‐ CAT versus TAU | The mean weight measured with BMI at 12 months follow‐up in the control group was 17.4 kg/m² | The mean weight measured with BMI at 12 months follow‐up in the CAT group was 1.1 higher (0.74 lower to 2.94 higher) | ‐ | 30 (1 RCT) | ⊕⊝⊝⊝ | This difference in BMI was not significant. |
| Recovery not achieved according to Morgan and Russell narrow categories or similar at end of 1 year FPT treatment ‐ FPT versus TAU | Study population | RR 0.70 (0.51 to 0.97) | 40 (1 RCT) | ⊕⊝⊝⊝ | This difference was significant. | |
| 947 per 1000 | 663 per 1000 | |||||
| Recovery not achieved according to Morgan and Russell narrow categories or similar at end of 1 year follow‐up‐ CAT versus TAU | Study population | RR RR 0.78 (0.61 to 1.00) | 71 | ⊕⊝⊝⊝ | This difference was not significant.There was consistency across RCTs | |
| 829 per 1000 | 646 per 1000 | |||||
| *The basis for the assumed risk (e.g. the median control group risk across studies) is provided in footnotes. The corresponding risk (and its 95% confidence interval) is based on the assumed risk in the comparison group and the relative effect of the intervention (and its 95% CI). | ||||||
| GRADE Working Group grades of evidence | ||||||
| 1. In both RCTs risk of bias was high, samples were small and small effects reported: downgraded the evidence by 3 points | ||||||
| Individual psychological therapy compared to a control therapy in the outpatient treatment of adults with anorexia nervosa | ||||||
| Patient or population: Adults and older adolescents with anorexia nervosa Settings: Outpatients Interventions: Cognitive Behavioural Therapy (CBT), MANTRA, Focal psychodynamic Psychotherapy (FPDT), Interpersonal Psychotherapy (IPT) Comparisons: Specialist Supportive Clinical Managment (SSCM), Optimised treatment as usual (TAU) | ||||||
| Outcomes | Anticipated absolute effects (95% CI) | Relative effect | No of Participants | Quality of the evidence | Comments | |
| Assumed risk | Corresponding risk | |||||
| Control therapy | Individual psychological therapy | |||||
| Weight measured with BMI ‐ CBT versus SSCM or Optimised TAU at end of treatment periods | The mean BMI ranged across control groups from | The mean BMI in the intervention groups was (‐0.91 to 0.91) | ‐ | 197 (2 RCTs) | ⊕⊕⊝⊝ low1 | This difference was not significant. |
| Weight measured with BMI ‐ Cognitive therapy versus dietary advice at end of treatment periods | The mean weight measured with BMI was 15.9 kg/m². | The mean BMI in the intervention group was | ‐ | 35 (1 RCT) | ⊕⊝⊝⊝ | This difference was not significant. |
| Weight measured with BMI ‐ MANTRA versus SSCM at end of treatment periods | The mean weight measured with BMI was 17.62 kg/m². | The mean BMI in the intervention group was 0.15 higher (‐0.04 to 0.34) | ‐ | 71 (1 RCT) | ⊕⊝⊝⊝ | This difference was not significant. |
| Weight measured with BMI ‐ Focal psychodynamic therapy (FPDT) versus Optimised TAU at end of treatment periods | The mean weight measured with BMI was 17.44 kg/m². | The mean BMI in the intervention group was | ‐ | 162 (1 RCT) | ⊕⊕⊝⊝ low4 | This difference was not significant.Low risk of bias, a large RCT |
| Weight measured with BMI ‐ IPT versus SSCM at end of treatment periods | The mean weight measured with BMI was 18.8 kg/m². | The mean BMI in the intervention group was 0.70 lower (‐2.38 to 0.98). | ‐ | 37(1 RCT) | ⊕⊝⊝⊝ | This difference was not significant. |
| Recovery according to Morgan and Russell narrow categories or similar ‐ CBT versus SSCM (Global outcome rated 3 or 4) at end of treatment periods | Study population | RR 1.56 (0.83 to 2.95) | 37 (1 RCT) | ⊕⊝⊝⊝ | This difference was not significant. No data available on CBT versus Optimised TAU | |
| 357 per 1000 | 325 per 1000 | |||||
| Recovery not achieved according to Morgan and Russell narrow categories or similar ‐ FPDT versus Optimised TAU at end of treatment periods | Study population | RR 0.57 (0.28 to 1.17) | 94 | ⊕⊕⊕⊝moderate4 | This difference was not significant. | |
| 325 per 1000 | 185 per 1000 | |||||
| Recovery not achieved according to Morgan and Russell narrow categories or similar ‐ IPT versus SSCM at end of treatment periods | Study population | RR 2.07 (1.17 to 3.67) | 37 | ⊕⊝⊝⊝ | This difference favouring SSCM was significant. | |
| 438 per 1000 | 906 per 1000 | |||||
| *The basis for the assumed risk (e.g. the median control group risk across studies) is provided in footnotes. The corresponding risk (and its 95% confidence interval) is based on the assumed risk in the comparison group and the relative effect of the intervention (and its 95% CI). | ||||||
| GRADE Working Group grades of evidence | ||||||
| 1. Risk of bias low in both RCTs, 1 RCT was very small, the findings were not consistent across the 2 RCTs for benefit of CBT and effects were small. 2. Risk of bias high and in only 1 small RCT 3. Low risk of bias but only 1 small RCT 4. Low risk of bias but only 1 RCT | ||||||
| Individual psychological therapy compared with another individual psychological therapy for anorexia nervosa. | ||||||
| Patient or population: Adults and older adolescents with anorexia nervosa Settings: Outpatients Interventions: Cognitive Behavioural Therapy (CBT) or Cognitive Orientation Therapy (COT) Comparisons: Focal Psychodynamic Psychotherapy (FPDT), Interpersonal Psychotherapy (IPT), CBT enhanced with cognitive remediation therapy (CRT) or Self psychology | ||||||
| Outcomes | Illustrative comparative risks* (95% CI) | Relative effect | No of Participants | Quality of the evidence | Comments | |
| Assumed risk | Corresponding risk | |||||
| Alternate therapy | CBT or COT | |||||
| Weight measured with BMI ‐ CBT versus IPT or FPDT at end of treatment periods | The mean weight measured with BMI ‐ CBT versus IPT or FPDT in the control group was 17.3 kg/m². | The mean weight measured with BMI ‐ CBT versus IPT or FPDT in the intervention group was 0.41 higher (‐0.08 to 0.89). | ‐ | 200 | ⊕⊕⊝⊝ | This difference was not significant. |
| Weight measured with change in BMI ‐ CBT versus Enhanced CBT e.g., with CRT at end of treatment periods | The mean BMI change ‐ CBT versus CBT enhanced with CRT in the control group was 0.512. | The mean BMI change ‐ CBT versus CBT enhanced with CRT, in the intervention group was 0.17 higher (‐0.64 to 0.99). | ‐ | 46 | ⊕⊝⊝⊝ | This difference was not significant. |
| Recovery not achieved according to Morgan and Russell narrow categories or similar ‐ CBT versus IPT or FPDT at end of treatment periods | Study population | RR 0.80 (0.59 to 1.08) | 156 (2 RCTs) | ⊕⊕⊝⊝ | This difference was not significant. | |
| 387 per 1000 | 309 per 1000 | |||||
| Recovery not achieved according to Morgan and Russell narrow categories or similar ‐ Cognitive orientation therapy (COT) versus self psychology (SP) both with nutritional counselling) at end of treatment periods | Study population | RR 2.97 (1.04 to 8.48) | 13 | ⊕⊝⊝⊝ | This difference favouring COT was significant. | |
| 286 per 1000 | 849 per 1000 | |||||
| *The basis for the assumed risk (e.g. the median control group risk across studies) is provided in footnotes. The corresponding risk (and its 95% confidence interval) is based on the assumed risk in the comparison group and the relative effect of the intervention (and its 95% CI). | ||||||
| GRADE Working Group grades of evidence | ||||||
| 1. Risk of bias low in both RCTs, 1 RCT was very small, the findings were not consistent across the 2 RCTs for benefit of CBT and effects were small. 2. Risk of bias unclear (allocation concealment) and only 1 small RCT. 3. Risk of bias high and only 1 small RCT. | ||||||
| Outcome or subgroup title | No. of studies | No. of participants | Statistical method | Effect size |
| 1 Weight measured with BMI at one year follow‐up Show forest plot | 1 | Mean Difference (IV, Random, 95% CI) | Totals not selected | |
| 1.1 CAT versus TAU | 1 | Mean Difference (IV, Random, 95% CI) | 0.0 [0.0, 0.0] | |
| 2 Recovery not achieved according to Morgan and Russell narrow categories or similar Show forest plot | 2 | Risk Ratio (M‐H, Random, 95% CI) | Subtotals only | |
| 2.1 FPT versus TAU | 1 | 40 | Risk Ratio (M‐H, Random, 95% CI) | 0.70 [0.51, 0.97] |
| 2.2 CAT versus TAU | 2 | 71 | Risk Ratio (M‐H, Random, 95% CI) | 0.78 [0.61, 1.00] |
| 3 N participants not completing the trial for any reason Show forest plot | 2 | Risk Ratio (M‐H, Random, 95% CI) | Subtotals only | |
| 3.1 FPT versus TAU | 1 | 40 | Risk Ratio (M‐H, Random, 95% CI) | 1.36 [0.59, 3.10] |
| 3.2 CAT versus TAU | 2 | 71 | Risk Ratio (M‐H, Random, 95% CI) | 1.05 [0.55, 2.02] |
| 4 Recovery not achieved according to the Morgan 1988 broader scale ratings of average outcome or similar Show forest plot | 1 | Mean Difference (IV, Random, 95% CI) | Totals not selected | |
| 4.1 CAT versus TAU | 1 | Mean Difference (IV, Random, 95% CI) | 0.0 [0.0, 0.0] | |
| Outcome or subgroup title | No. of studies | No. of participants | Statistical method | Effect size |
| 1 Weight measured with BMI Show forest plot | 4 | Mean Difference (IV, Random, 95% CI) | Subtotals only | |
| 1.1 CBT versus SSCM or Optimised TAU | 2 | 197 | Mean Difference (IV, Random, 95% CI) | ‐0.00 [‐0.91, 0.91] |
| 1.2 Cognitive therapy versus dietary advice | 1 | 35 | Mean Difference (IV, Random, 95% CI) | 1.80 [‐0.12, 3.72] |
| 1.3 MANTRA versus SSCM | 1 | 71 | Mean Difference (IV, Random, 95% CI) | 0.15 [‐0.96, 1.26] |
| 1.4 Focal psychodynamic therapy (FPDT) versus Optimised TAU | 1 | 162 | Mean Difference (IV, Random, 95% CI) | ‐0.14 [‐0.68, 0.40] |
| 1.5 IPT versus SSCM | 1 | 37 | Mean Difference (IV, Random, 95% CI) | ‐0.70 [‐2.38, 0.98] |
| 2 Recovery not achieved according to Morgan and Russell narrow categories or similar Show forest plot | 2 | Risk Ratio (M‐H, Random, 95% CI) | Subtotals only | |
| 2.1 CBT versus SSCM (Global outcome rated 3 or 4) or optimised TAU | 2 | 137 | Risk Ratio (M‐H, Random, 95% CI) | 0.97 [0.37, 2.54] |
| 2.2 FPDT versus Optimised TAU | 1 | 94 | Risk Ratio (M‐H, Random, 95% CI) | 0.57 [0.28, 1.17] |
| 2.3 IPT versus SSCM | 1 | 37 | Risk Ratio (M‐H, Random, 95% CI) | 2.07 [1.17, 3.67] |
| 3 Number of participants not completing therapy for any reason Show forest plot | 4 | Risk Ratio (M‐H, Random, 95% CI) | Subtotals only | |
| 3.1 CBT versus SSCM, an eclectic specialist therapy or Optimised TAU | 2 | 51 | Risk Ratio (M‐H, Random, 95% CI) | 0.81 [0.19, 3.51] |
| 3.2 Cognitive therapy versus dietary advice | 1 | 35 | Risk Ratio (M‐H, Random, 95% CI) | 0.10 [0.03, 0.33] |
| 3.3 MANTRA versus SSCM | 1 | 71 | Risk Ratio (M‐H, Random, 95% CI) | 0.68 [0.36, 1.29] |
| 3.4 IPT versus SSCM | 1 | 37 | Risk Ratio (M‐H, Random, 95% CI) | 1.37 [0.57, 3.30] |
| 4 Mean eating disorder symptoms score Show forest plot | 3 | Std. Mean Difference (IV, Random, 95% CI) | Subtotals only | |
| 4.1 CBT versus SSCM or Optimised TAU | 2 | 197 | Std. Mean Difference (IV, Random, 95% CI) | 0.05 [‐0.44, 0.54] |
| 4.2 MANTRA versus SSCM | 1 | 71 | Std. Mean Difference (IV, Random, 95% CI) | ‐0.11 [‐0.58, 0.35] |
| 4.3 FPDT versus Optimised TAU | 1 | 162 | Std. Mean Difference (IV, Random, 95% CI) | ‐0.09 [‐0.40, 0.22] |
| 4.4 IPT versus SSCM | 1 | 37 | Std. Mean Difference (IV, Random, 95% CI) | 1.17 [0.46, 1.88] |
| 5 General psychiatric symptoms Show forest plot | 1 | Mean Difference (IV, Random, 95% CI) | Totals not selected | |
| 5.1 CBT versus SSCM (DSM‐IV Global Assessment of function (GAF) scores) | 1 | Mean Difference (IV, Random, 95% CI) | 0.0 [0.0, 0.0] | |
| 5.2 IPT versus SSCM | 1 | Mean Difference (IV, Random, 95% CI) | 0.0 [0.0, 0.0] | |
| 6 Level of depression measured with the Hamilton Depression Rating Scale (HDRS) Show forest plot | 2 | Mean Difference (IV, Random, 95% CI) | Subtotals only | |
| 6.1 CBT versus SSCM | 1 | 35 | Mean Difference (IV, Random, 95% CI) | 0.10 [‐4.84, 5.04] |
| 6.2 MANTRA versus SSCM | 1 | 71 | Mean Difference (IV, Random, 95% CI) | ‐0.53 [‐4.03, 2.97] |
| 6.3 IPT versus SSCM | 1 | 37 | Mean Difference (IV, Random, 95% CI) | 3.1 [‐1.57, 7.77] |
| 7 Recovery not achieved according to the Morgan and Russell categories or similar at long term follow‐up Show forest plot | 1 | Risk Ratio (M‐H, Random, 95% CI) | Totals not selected | |
| 7.1 CBT versus SSCM | 1 | Risk Ratio (M‐H, Random, 95% CI) | 0.0 [0.0, 0.0] | |
| 7.2 IPT versus SSCM | 1 | Risk Ratio (M‐H, Random, 95% CI) | 0.0 [0.0, 0.0] | |
| 8 Weight measured with BMI at long‐term follow‐up Show forest plot | 2 | Mean Difference (IV, Random, 95% CI) | Subtotals only | |
| 8.1 CBT versus SSCM or Optimised TAU | 2 | 191 | Mean Difference (IV, Random, 95% CI) | ‐0.02 [‐0.87, 0.82] |
| 8.2 FPDT versus Optimised TAU | 1 | 162 | Mean Difference (IV, Random, 95% CI) | 0.25 [‐0.44, 0.94] |
| 8.3 IPT versus SSCM | 1 | 26 | Mean Difference (IV, Random, 95% CI) | ‐0.40 [‐2.62, 1.82] |
| 9 Mean eating disorder symptom score at long term follow‐up Show forest plot | 2 | Std. Mean Difference (IV, Random, 95% CI) | Subtotals only | |
| 9.1 CBT versus SSCM or optimised TAU | 2 | 191 | Std. Mean Difference (IV, Random, 95% CI) | ‐0.23 [‐0.93, 0.47] |
| 9.2 FPDT versus Optimised TAU | 1 | 162 | Std. Mean Difference (IV, Random, 95% CI) | ‐0.05 [‐0.36, 0.26] |
| 9.3 IPT versus SSCM | 1 | 26 | Std. Mean Difference (IV, Random, 95% CI) | ‐0.73 [‐1.54, 0.07] |
| 10 General psychiatric symptoms at long‐term follow‐up Show forest plot | 1 | Mean Difference (IV, Random, 95% CI) | Totals not selected | |
| 10.1 CBT versus SSCM (DSM‐IV Global Assessment of function (GAF) scores) | 1 | Mean Difference (IV, Random, 95% CI) | 0.0 [0.0, 0.0] | |
| 10.2 IPT versus SSCM | 1 | Mean Difference (IV, Random, 95% CI) | 0.0 [0.0, 0.0] | |
| 11 Level of depression measured with the Hamilton Depression Rating Scale (HDRS) at long term follow‐up Show forest plot | 1 | Mean Difference (IV, Random, 95% CI) | Totals not selected | |
| 11.1 CBT versus SSCM | 1 | Mean Difference (IV, Random, 95% CI) | 0.0 [0.0, 0.0] | |
| 11.2 IPT versus SSCM | 1 | Mean Difference (IV, Random, 95% CI) | 0.0 [0.0, 0.0] | |
| Outcome or subgroup title | No. of studies | No. of participants | Statistical method | Effect size |
| 1 Weight measured with BMI, or change in BMI Show forest plot | 3 | Mean Difference (IV, Random, 95% CI) | Subtotals only | |
| 1.1 CBT versus IPT or FPDT | 2 | 200 | Mean Difference (IV, Random, 95% CI) | 0.41 [‐0.08, 0.89] |
| 1.2 CBT versus Enhanced CBT e.g., with CRT | 1 | 46 | Mean Difference (IV, Random, 95% CI) | 0.17 [‐0.64, 0.99] |
| 2 Recovery not achieved according to Morgan and Russell narrow categories or similar Show forest plot | 3 | Risk Ratio (M‐H, Random, 95% CI) | Subtotals only | |
| 2.1 CBT versus IPT or FPDT | 2 | 156 | Risk Ratio (M‐H, Random, 95% CI) | 0.80 [0.59, 1.08] |
| 2.2 Cognitive orientation therapy (COT) versus self‐psychology (SP) both with nutritional counselling) | 1 | 13 | Risk Ratio (M‐H, Random, 95% CI) | 2.97 [1.04, 8.48] |
| 3 Number of participants not completing treatment Show forest plot | 4 | Risk Ratio (M‐H, Random, 95% CI) | Subtotals only | |
| 3.1 CBT versus IPT or FPDT | 2 | 200 | Risk Ratio (M‐H, Random, 95% CI) | 0.64 [0.41, 1.01] |
| 3.2 CBT versus Enhanced CBT e.g., with CRT | 1 | 46 | Risk Ratio (M‐H, Random, 95% CI) | 1.25 [0.60, 2.59] |
| 3.3 COT versus SP (both with nutritional counselling) | 1 | 13 | Risk Ratio (M‐H, Random, 95% CI) | 4.67 [0.70, 31.22] |
| 4 Mean eating disorder symptom scores at end of treatment Show forest plot | 3 | Std. Mean Difference (IV, Random, 95% CI) | Subtotals only | |
| 4.1 CBT versus IPT (EDE Restraint score) or FPDT (EDI total score) | 2 | 200 | Std. Mean Difference (IV, Random, 95% CI) | ‐0.33 [‐1.00, 0.35] |
| 4.2 CBT versus Enhanced CBT e.g., with CRT (EDE Restraint scores) | 1 | 46 | Std. Mean Difference (IV, Random, 95% CI) | 0.33 [‐0.26, 0.91] |
| 5 General psychiatric symptoms Show forest plot | 1 | Mean Difference (IV, Random, 95% CI) | Totals not selected | |
| 5.1 CBT versus IPT (DSM‐IV Global Assessment of function (GAF) scores) | 1 | Mean Difference (IV, Random, 95% CI) | 0.0 [0.0, 0.0] | |
| 6 Level of depression measured with the Hamilton Depression Rating Scale (HDRS) Show forest plot | 1 | Mean Difference (IV, Random, 95% CI) | Totals not selected | |
| 6.1 CBT versus IPT | 1 | Mean Difference (IV, Random, 95% CI) | 0.0 [0.0, 0.0] | |
| 7 Mean eating disorder symptoms scores at long term follow‐up Show forest plot | 2 | Std. Mean Difference (IV, Random, 95% CI) | Subtotals only | |
| 7.1 CBT versus IPT (EDE restraint) or FPDT (EDI total scores) | 2 | 191 | Std. Mean Difference (IV, Random, 95% CI) | 0.07 [‐0.21, 0.36] |
| 8 Weight as measured with BMI at long term follow‐up Show forest plot | 2 | Mean Difference (IV, Random, 95% CI) | Subtotals only | |
| 8.1 CBT versus IPT or FPDT | 2 | 191 | Mean Difference (IV, Random, 95% CI) | ‐0.19 [‐0.79, 0.41] |
| 9 Recovery not achieved according to the Morgan and Russell categorical outcome or similar at long term follow‐up Show forest plot | 1 | Risk Ratio (M‐H, Random, 95% CI) | Totals not selected | |
| 9.1 CBT versus IPT (Global outcome rated 3 or 4) | 1 | Risk Ratio (M‐H, Random, 95% CI) | 0.0 [0.0, 0.0] | |
| 10 General psychiatric symptoms at long term follow‐up Show forest plot | 1 | Mean Difference (IV, Random, 95% CI) | Totals not selected | |
| 10.1 CBT versus IPT (DSM‐IV Global Assessment of function (GAF) scores) | 1 | Mean Difference (IV, Random, 95% CI) | 0.0 [0.0, 0.0] | |
| 11 Level of depression measured with the Hamilton Depression Rating Scale (HDRS) at long term follow‐up Show forest plot | 1 | Mean Difference (IV, Random, 95% CI) | Totals not selected | |
| 11.1 CBT versus IPT | 1 | Mean Difference (IV, Random, 95% CI) | 0.0 [0.0, 0.0] | |
| Outcome or subgroup title | No. of studies | No. of participants | Statistical method | Effect size |
| 1 Number not achieving remission defined by normal: body weight, psychology, test results, eating behaviour & social activities Show forest plot | 1 | Risk Ratio (M‐H, Random, 95% CI) | Totals not selected | |
| 1.1 Karolinski Institute Mandometer outpatient treatment versus wait‐list control group | 1 | Risk Ratio (M‐H, Random, 95% CI) | 0.0 [0.0, 0.0] | |