| Study | Presentation to which department? | Origin | Primary outcome(s) | Total n randomised | Side effects (patients in study) | Pharmaceutical exclusions | Other Interventions |
| MgSO₄ and SABA and Ipratropium bromide versus SABA and Ipratropium |
| Ashtekar 2008 | Children’s Assessment Unit after GP referral | Cardiff, Wales | ASS (Yung) | 17 | 1 tingling in fingers and 1 transient hypotension | None stated | All management followed the BTS/SIGN guidelines; all children received 2 mg/kg prednisolone |
| Drobina 2006 | ED | USA | PEF, admissions | 110 | No comment on side effects in paper | Not stated | All subjects received 50 mg of oral prednisone at the onset of the treatment |
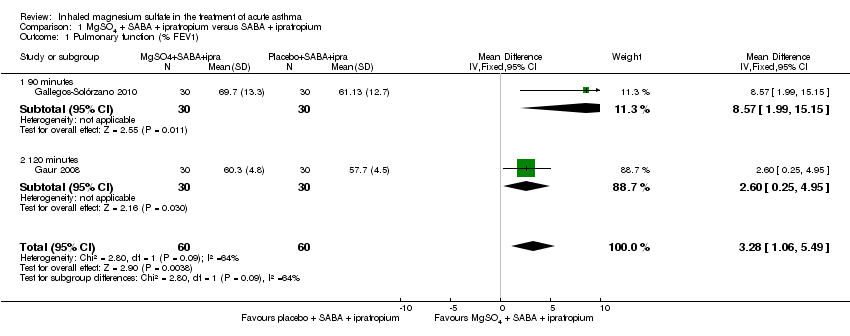
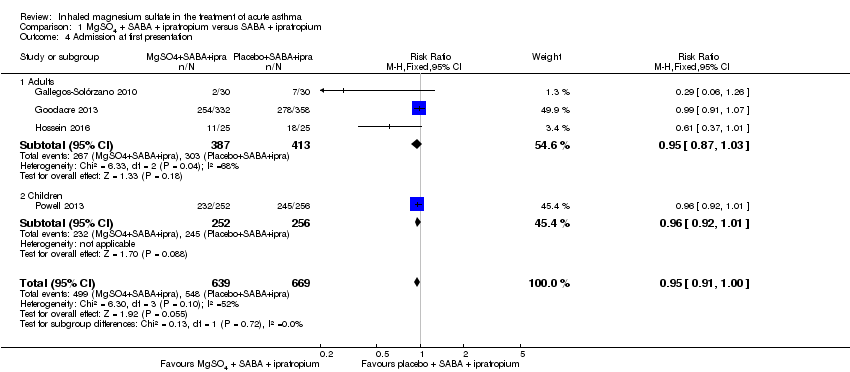
| Gallegos‐Solórzano 2010 | ED | Mexico City, Mexico | % change FEV1, O₂ post treatment, admission rates | 112 | Dry and bitter mouth (MgSO₄ group 1), dizziness (MgSO₄ 1; placebo 1) | Use of steroids prior to presentation | All participants received one IV dose of 125 mg methylprednisolone at admission and 1 mg/kg/day for 10 days prednisolone,on discharge. Other treatments were administered according to the treating physician |
| Gaur 2008 | ED | Delhi, India | FEV1 | 60 | None reported | None stated | All participants received IV hydrocortisone on arrival |
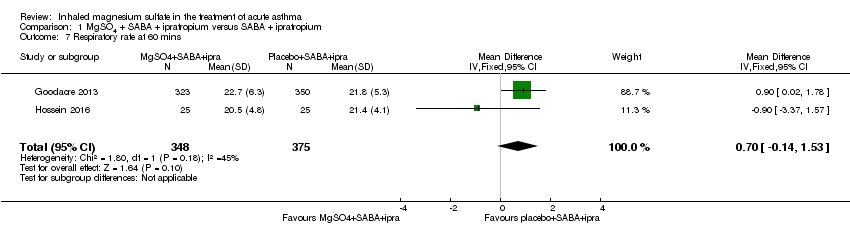
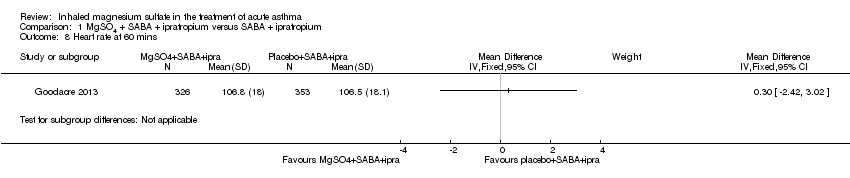
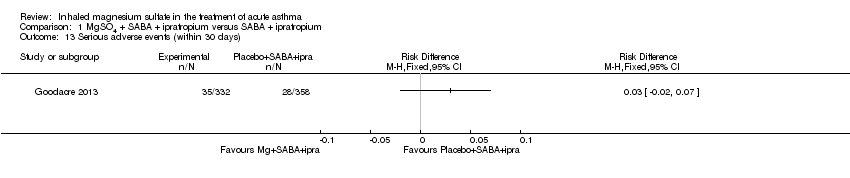
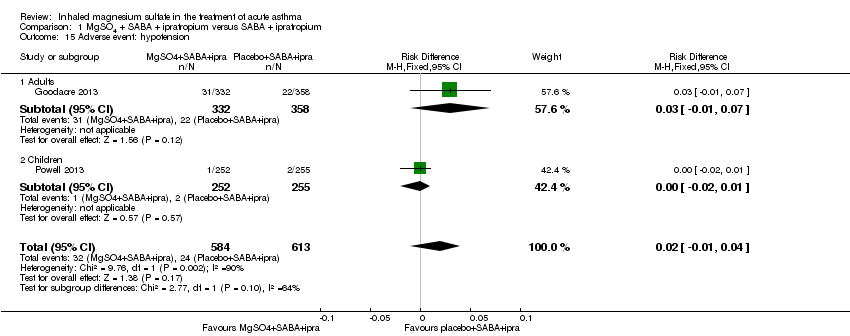
| Goodacre 2013 | ED | UK | Admission within 7d, visual analogue scale for breathlessness at 2 h | 703 | AEs (41 MgSO₄/salbutamol; 36 placebo/salbutamol) | MgSO₄ in the past 24 h | All participants were managed according to BTS/SIGN guidelines (consisting of
oxygen, nebulised salbutamol (5 mg), nebulised ipratropium (500 μg), and oral prednisolone administered during recruitment, followed by up to 5 mg salbutamol added to each trial nebuliser. Other treatments were provided at the discretion of the clinician |
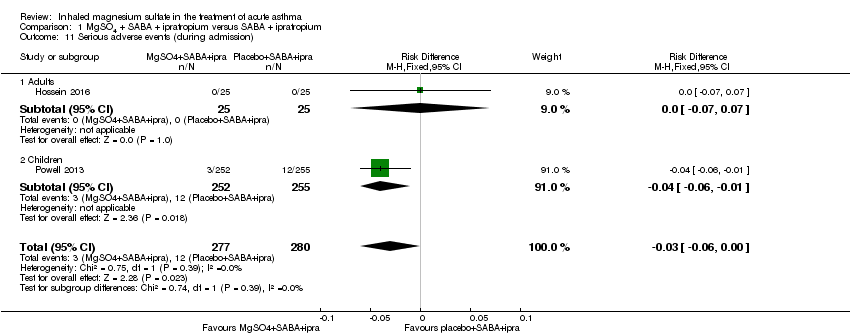
| Hossein 2016 | ED | Tehran, Iran | PEFR improvement, admission rate | 50 | No serious side effects reported | None stated | All participants received 50 mg oral prednisolone |
| Powell 2013 | ED and children's assessment units | UK | Yung asthma severity score | 508 | 47 in MgSO₄ group and 59 in control group | None | Hospital‐defined conventional treatment |
| MgSO4 and SABA versus SABA |
| Abreu‐Gonzalez 2002 | ‐ | Tenerife Spain | FEV1, PEF | 24 | None reported | None stated | Not stated |
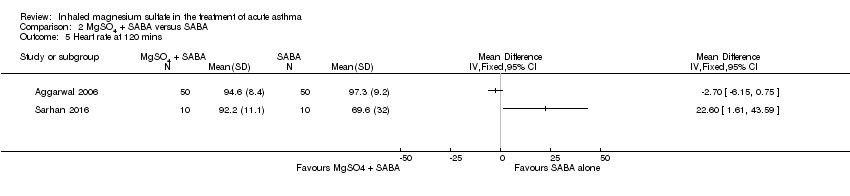
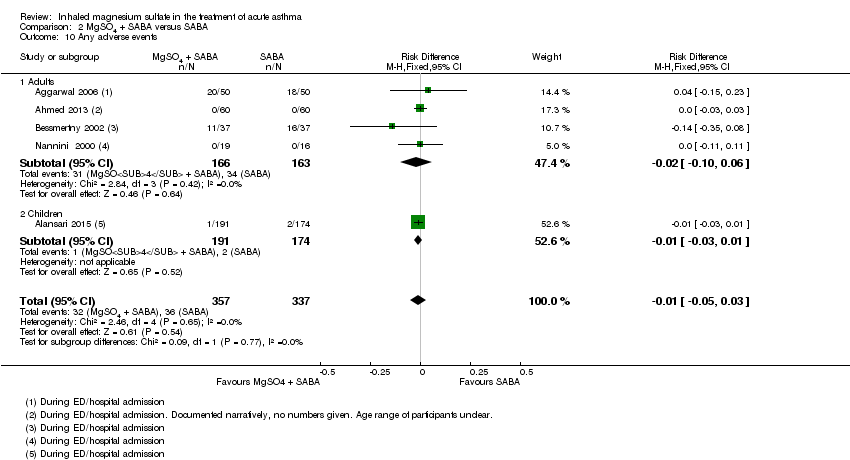
| Aggarwal 2006 | ED | New Delhi India | PEF | 100 | Palpitations (MgSO₄/salbutamol 13; salbutamol/placebo 11) and tremors (7; 7). | None stated | Clinicians free to administer steroids, salbutamol, IV hydrocortisone if judged to be required |
| Ahmed 2013 | ‐ | Mymensingh, Bangladesh | PEF | 120 | None reported | None stated | Not stated |
| Alansari 2015 | Paediatric emergency centre | Doha, Qatar | Time to readiness for discharge | 400 | Chest tightness and facial rash (MgSO₄/salbutamol 191), excessive cough (placebo/salbutamol 174) | None stated | All participants received methylprednisolone 1 mg/kg IV every 12h and additional nebulised albuterol at clinicians' discretion |
| Badawy 2014 | Outpatient department and ED | Sohag, Egypt | Exacerbations post intervention, delivery outcome, post‐partum health status | 60 | None reported | None stated | All participants received 100 mg hydrocortisone IV, 500 mg aminophylline IV |
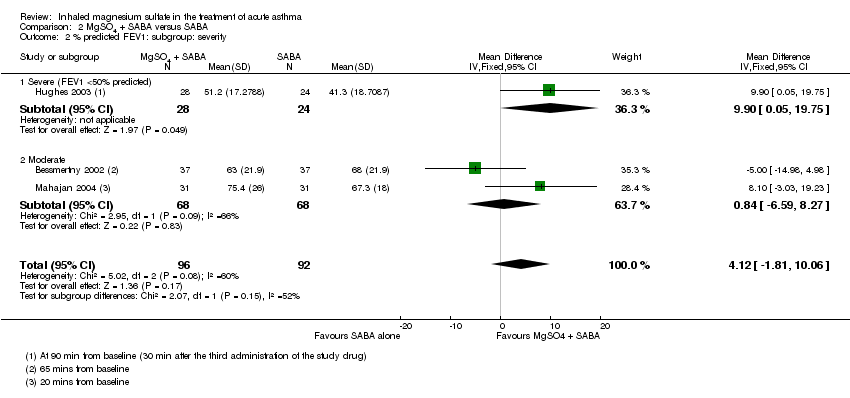
| Bessmertny 2002 | ED | Brooklyn, USA | FEV1 (% pred) | 74 | No SAEs reported | No theophylline or anticholinergics 2 h prior to presentation | Intravenous hydrocortisone, 2 mg/kg
every 6 h, was administered to patients who failed to show an adequate improvement of pulmonary function after 3 initial doses of albuterol |
| Dadhich 2005 | ED | Ajmer India | PEF | 71 | "Side effects were self limiting" | Not stated | Not stated |
| Hughes 2003 | ED | Wellington New Zealand | FEV1 | 52 | None reported | None | All participants received 100 mg hydrocortisone IV |
| Khashabi 2008 | ‐ | Urmia, Iran | Reduced mean duration of O₂ therapy in MgSO₄ group, no change in Respiratory Distress Score) | 40 | No side effects | Not stated | Not stated |
| Kokturk 2005 | ED | Gazi, Turkey | PEF difference | 26 | Transient hypotension (1 MgSO₄), palpitation (1 salbutamol) | None | All participants received 1 mg/kg prednisolone. Theophylline, anticholinergics and salbutamol given at clinicians discretion |
| Mahajan 2004 | ED | Detroit, USA | % change in FEV1 | 62 | No side effects | Steroids, ipratropium or theophylline in the last 3 days. | All participants received 2 mg/kg of prednisone |
| Mohammedzadeh 2014 | ‐ | Babol, Iran | Pulmonary index, PEFR, adjusted PEFR | 80 | ‐ | Corticosteroids; steroids, theophylline or ipratropium use within last 72 h | Not stated |
| Nannini 2000 | ED | 4 hospitals in Argentina | PEF, admissions | 35 | None reported | Oral or parenteral steroids in the last 7 days | No other medications were permitted during the study except
supplemental oxygen; if the patient’s condition worsened, a 2.5 mg dose of nebulized salbutamol was administered at the discretion of the treating physician |
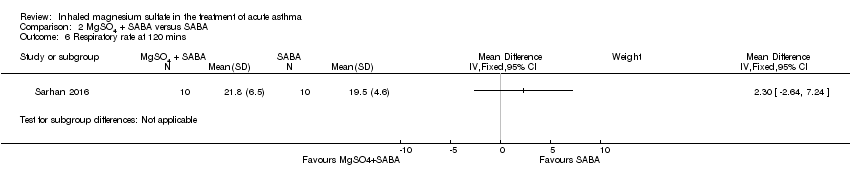
| Sarhan 2016 | Chest and ED | Minia, Egypt | Clinical improvement, PEFR | 30 | None severe enough to warrant withdrawal | Bronchodilators in last 6 h, steroids in last 12 h | Nebulised salbutamol, IV hydrocortisone, IV aminophylline at clinicians' discretion |
| Turker 2017 | ED | Turkey | Modified pulmonary index score | 100 | "No side effect caused by magnesium was observed in any of the patients in the study" | Not stated | Nebulised salbutamol (0.15 mg/kg), methylprednisolone 1 mg/kg IV; Oxygen was given to patients with SaO2≤ 95% |
| MgSO₄ versus SABA |
| Dadhich 2005 | ED | Ajmer India | PEF | 71 | "Side effects were self limiting" | Not stated | Not stated |
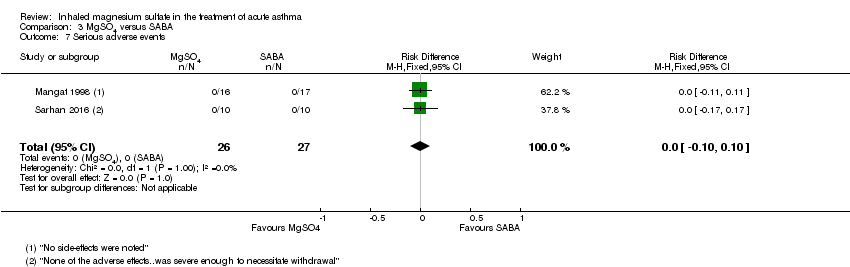
| Mangat 1998 | ED | St John’s College, India | PEF, Fischl index score, admissions | 33 | Transient self limiting hypotension (1) palpitation (1) tremors (2) all in control group and only 1 transient hypotension in MgSO₄ group (33) | Oral parenteral bronchodilators (6 h) steroids (last 12 h) | All participants received 100 mg hydrocortisone IV |
| Meral 1996 | ‐ | Izmir, Turkey | % change in PEF ASS (Davies Leffert, Dabbous score) | 40 | No side effects | Beta2‐agonists or theophylline in the last 12 h | No other medication given |
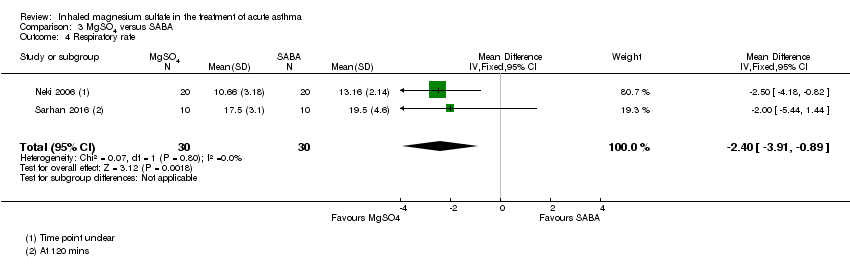
| Neki 2006 | ‐ | Amritsar Punjab | PEF, RR, Fischl index | 40 | ‐ | Oral, inhaled or parenteral steroids in last 12 h | All participants received 100 mg hydrocortisone IV |
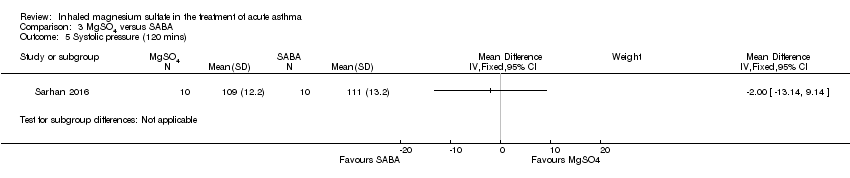
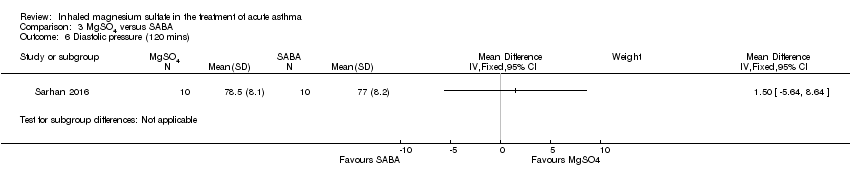
| Sarhan 2016 | Chest and ED | Minia, Egypt | Clinical improvement, PEFR | 30 | None severe enough to warrant withdrawal | Bronchodilators in last 6 h, steroids in last 12 h | Nebulised salbutamol, IV hydrocortisone, IV aminophylline at clinicians' discretion |