| 1 number with increased frequency of prolapse symptoms Show forest plot | 1 | 69 | Risk Ratio (M‐H, Fixed, 95% CI) | 0.37 [0.21, 0.65] |
|
| 2 number with increased bother of prolapse symptoms Show forest plot | 1 | 69 | Risk Ratio (M‐H, Fixed, 95% CI) | 0.56 [0.33, 0.97] |
|
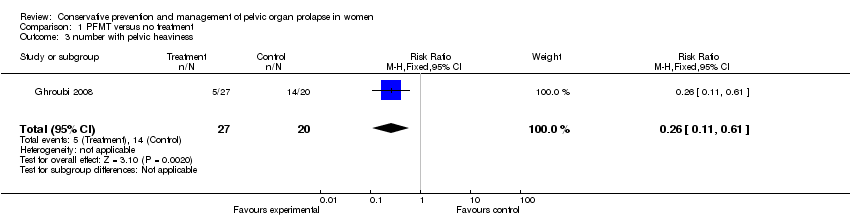
| 3 number with pelvic heaviness Show forest plot | 1 | 47 | Risk Ratio (M‐H, Fixed, 95% CI) | 0.26 [0.11, 0.61] |
|
| 4 prolapse symptom score: mean change from baseline Show forest plot | 1 | 37 | Mean Difference (IV, Fixed, 95% CI) | ‐3.37 [‐6.23, ‐0.51] |
|
| 5 self‐report of no improvement in prolapse Show forest plot | 1 | 40 | Risk Ratio (M‐H, Fixed, 95% CI) | 0.48 [0.26, 0.91] |
|
| 6 prolapse QoL score Show forest plot | 2 | 87 | Std. Mean Difference (IV, Fixed, 95% CI) | ‐0.51 [‐0.94, ‐0.07] |
|
| 6.1 mean score for prolapse interference with everyday life | 1 | 40 | Std. Mean Difference (IV, Fixed, 95% CI) | ‐0.05 [‐0.67, 0.57] |
| 6.2 Ditrovie quality of life score | 1 | 47 | Std. Mean Difference (IV, Fixed, 95% CI) | ‐0.95 [‐1.57, ‐0.34] |
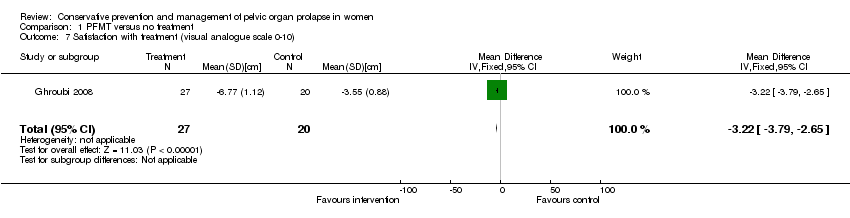
| 7 Satisfaction with treatment (visual analogue scale 0‐10) Show forest plot | 1 | 47 | Mean Difference (IV, Fixed, 95% CI) | ‐3.22 [‐3.79, ‐2.65] |
|
| 8 number with POP‐Q stage not improved Show forest plot | 2 | 128 | Risk Ratio (M‐H, Fixed, 95% CI) | 0.83 [0.71, 0.96] |
|
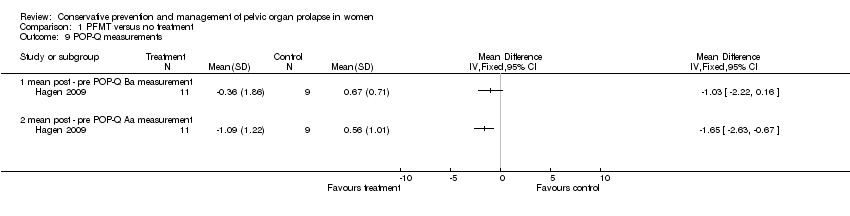
| 9 POP‐Q measurements Show forest plot | 1 | | Mean Difference (IV, Fixed, 95% CI) | Totals not selected |
|
| 9.1 mean post ‐ pre POP‐Q Ba measurement | 1 | | Mean Difference (IV, Fixed, 95% CI) | 0.0 [0.0, 0.0] |
| 9.2 mean post ‐ pre POP‐Q Aa measurement | 1 | | Mean Difference (IV, Fixed, 95% CI) | 0.0 [0.0, 0.0] |
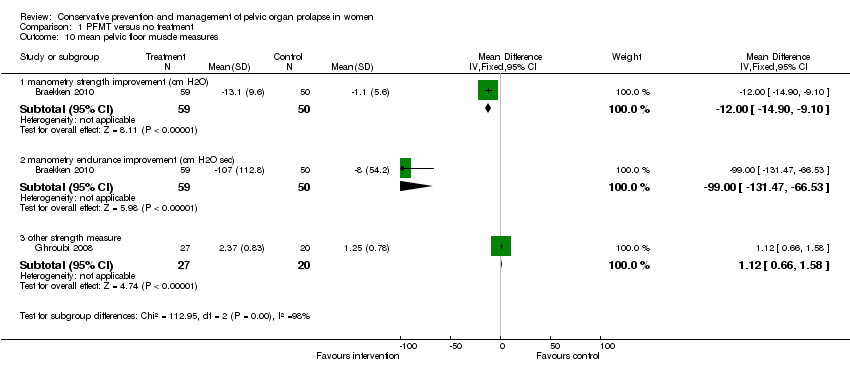
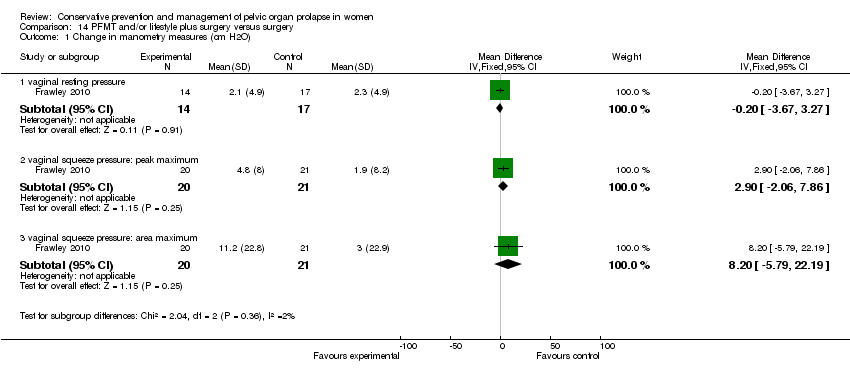
| 10 mean pelvic floor muscle measures Show forest plot | 2 | | Mean Difference (IV, Fixed, 95% CI) | Subtotals only |
|
| 10.1 manometry strength improvement (cm H2O) | 1 | 109 | Mean Difference (IV, Fixed, 95% CI) | ‐12.00 [‐14.90, ‐9.10] |
| 10.2 manometry endurance improvement (cm H2O sec) | 1 | 109 | Mean Difference (IV, Fixed, 95% CI) | ‐99.0 [‐131.47, ‐66.53] |
| 10.3 other strength measure | 1 | 47 | Mean Difference (IV, Fixed, 95% CI) | 1.12 [0.66, 1.58] |
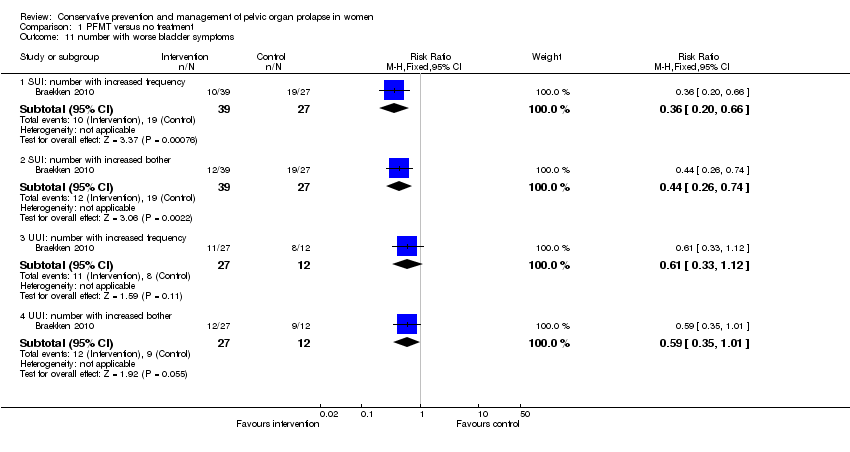
| 11 number with worse bladder symptoms Show forest plot | 1 | | Risk Ratio (M‐H, Fixed, 95% CI) | Subtotals only |
|
| 11.1 SUI: number with increased frequency | 1 | 66 | Risk Ratio (M‐H, Fixed, 95% CI) | 0.36 [0.20, 0.66] |
| 11.2 SUI: number with increased bother | 1 | 66 | Risk Ratio (M‐H, Fixed, 95% CI) | 0.44 [0.26, 0.74] |
| 11.3 UUI: number with increased frequency | 1 | 39 | Risk Ratio (M‐H, Fixed, 95% CI) | 0.61 [0.33, 1.12] |
| 11.4 UUI: number with increased bother | 1 | 39 | Risk Ratio (M‐H, Fixed, 95% CI) | 0.59 [0.35, 1.01] |
| 12 change in ICIQ UI‐SF Show forest plot | 1 | 39 | Mean Difference (IV, Fixed, 95% CI) | ‐1.79 [‐3.68, 0.10] |
|
| 13 mean bladder symptom score Show forest plot | 1 | 47 | Mean Difference (IV, Fixed, 95% CI) | ‐9.22 [‐10.68, ‐7.76] |
|
| 14 urodynamics: post void residual (mL) Show forest plot | 1 | 47 | Mean Difference (IV, Fixed, 95% CI) | ‐21.28 [‐32.75, ‐9.81] |
|
| 15 urodynamics: flow rate (mL/s) Show forest plot | 1 | 47 | Mean Difference (IV, Fixed, 95% CI) | ‐3.23 [‐5.16, ‐1.30] |
|
| 16 urodynamics: closure pressure (cm H2O) Show forest plot | 1 | 47 | Mean Difference (IV, Fixed, 95% CI) | ‐4.86 [‐12.06, 2.34] |
|
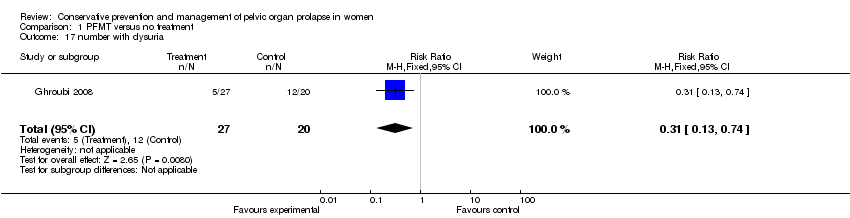
| 17 number with dysuria Show forest plot | 1 | 47 | Risk Ratio (M‐H, Fixed, 95% CI) | 0.31 [0.13, 0.74] |
|
| 18 number with stress incontinence Show forest plot | 1 | 47 | Risk Ratio (M‐H, Fixed, 95% CI) | 0.16 [0.04, 0.68] |
|
| 19 number with urgency Show forest plot | 1 | 47 | Risk Ratio (M‐H, Fixed, 95% CI) | 0.11 [0.01, 0.79] |
|
| 20 number with frequency Show forest plot | 1 | 47 | Risk Ratio (M‐H, Fixed, 95% CI) | 0.27 [0.10, 0.72] |
|
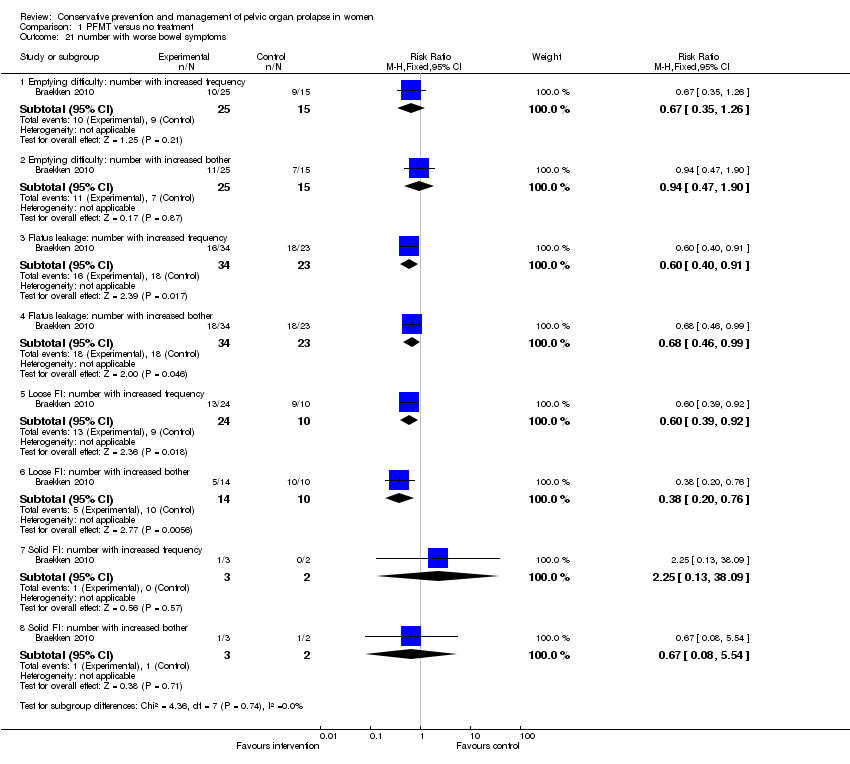
| 21 number with worse bowel symptoms Show forest plot | 1 | | Risk Ratio (M‐H, Fixed, 95% CI) | Subtotals only |
|
| 21.1 Emptying difficulty: number with increased frequency | 1 | 40 | Risk Ratio (M‐H, Fixed, 95% CI) | 0.67 [0.35, 1.26] |
| 21.2 Emptying difficulty: number with increased bother | 1 | 40 | Risk Ratio (M‐H, Fixed, 95% CI) | 0.94 [0.47, 1.90] |
| 21.3 Flatus leakage: number with increased frequency | 1 | 57 | Risk Ratio (M‐H, Fixed, 95% CI) | 0.60 [0.40, 0.91] |
| 21.4 Flatus leakage: number with increased bother | 1 | 57 | Risk Ratio (M‐H, Fixed, 95% CI) | 0.68 [0.46, 0.99] |
| 21.5 Loose FI: number with increased frequency | 1 | 34 | Risk Ratio (M‐H, Fixed, 95% CI) | 0.60 [0.39, 0.92] |
| 21.6 Loose FI: number with increased bother | 1 | 24 | Risk Ratio (M‐H, Fixed, 95% CI) | 0.38 [0.20, 0.76] |
| 21.7 Solid FI: number with increased frequency | 1 | 5 | Risk Ratio (M‐H, Fixed, 95% CI) | 2.25 [0.13, 38.09] |
| 21.8 Solid FI: number with increased bother | 1 | 5 | Risk Ratio (M‐H, Fixed, 95% CI) | 0.67 [0.08, 5.54] |