Prevención y tratamiento conservadores para el prolapso de órganos pélvicos en mujeres
Referencias
References to studies included in this review
References to studies excluded from this review
References to ongoing studies
Additional references
Characteristics of studies
Characteristics of included studies [ordered by study ID]
| Methods | Treatment arms: 2 groups, PFMT and control Randomisation: a statistician generated and stored the allocation envelopes. Immediately after a woman's initial gynaecologist examination the 1st author gave the next numbered envelope to the woman at the University hospital. The woman opened the opaque sealed envelope herself. Random permuted blocks were not used which resulted in unequal group sizes. There was a significant difference at baseline between the randomised groups in the prevalence of prolapse symptoms (43/59 PFMT group, 26/50 control group). Stratification: States 2 strata, maximum descent at or above the hymen, below the hymen. However when analyses were reported the number of women was not equal within the "below the hymen" strata: 25 intervention, 15 control. This suggests women were not randomised within strata. Blinding: the ultrasound films were assessed by an assessor blind to the women's group, clinical and background information. POP‐Q assessment was also blinded in this way. Pelvic floor assessment was not blinded: carried out by the 1st author who was also involved in delivering the intervention. Power calculation: sample size based on effect size of 0.6 (from study of PFMT for stress urinary incontinence), alpha=0.5, power 80%. Suggested 45 women per group was needed. Intention to treat analysis: was performed. Did not perform “per protocol” analysis as there were very few drop‐outs. Baseline values carried forward for 2 women who dropped out. Follow‐up: women were followed up at 6 months. | |
| Participants | Study population: 109 out of possible 145 women were randomised (36 excluded, 59 PFMT, 50 control). The trial included: women attending for a routine check‐up, women attending with POP symptoms and women interested to know if they might have prolapse. Number/type of centres: recruitment was by multiple community gynaecologists in Oslo and Akershus. 14 gynaecologists recruited women to the trial. Women were also recruited via newspaper adverts. POP‐Qs and ultrasounds were carried out at a University Hospital. Pelvic floor assessments were carried out at a physical therapy centre by the 1st author. The intervention was delivered either at a physical therapist centre or at a University Hospital. Withdrawals: 1 woman in each group withdrew. Diagnosis: POP‐Q method. Type of prolapse:
Severity of prolapse:
Urinary incontinence present: 51/59 PFMT and 36/50 control women had bladder symptoms at baseline. Urinary incontinence not mentioned specifically. Inclusion criteria:
Exclusion criteria:
Baseline comparison of treatment groups:
Characteristics of population:
| |
| Interventions | Comparisons:
Description:
Therapists: 3 women's health physiotherapists (including 1st author) delivered the intervention. Compliance:
| |
| Outcomes | Definition of cure: Improvement of morphological and functional change. Improvement in symptoms: less frequent symptoms, less bother with symptoms. Outcomes: Pre to post change in ultrasound measures (mean change, 95% CI): intervention control
*NB. results for bladder and rectum positions differ in the American Journal of Obstetrics and Gynecology paper as different measurement method was used. POP‐Q:
Improvement in frequency and bother of prolapse symptoms: vaginal bulging and/or heaviness
Improvement in frequency and bother of bladder symptoms (Analysis 1.11): Percentage with improved frequency and bother of stress and urge symptoms reported. Sample size ranged from 12 to 39 per group as not all women had bladder symptoms to start with. Significant difference in favour of the intervention group for improvement in frequency and bother of stress symptoms, and frequency of urge symptoms. ICIQ‐UI short form: Difference between groups 2.40; 95% CI [0.90, 3.80], P = 0.002. It is not clear whether this is based on the change in score. The means for each group are not reported. Improvement in frequency and bother of bowel symptoms (Analysis 1.21): Percentage with improved frequency and bother of: difficulty emptying, of flatus leakage, of loose faecal incontinence and of solid faecal incontinence reported. Sample size ranged from 2 to 34 per group as not all women had bowel symptoms to start with. Significant difference in favour of the intervention group for improvement in frequency and bother of flatus, and frequency and bother of loose faecal incontinence. Pelvic floor muscle assessment (mean change, 95% CI) (Analysis 1.10):
| |
| Notes |
| |
| Risk of bias | ||
| Bias | Authors' judgement | Support for judgement |
| Random sequence generation (selection bias) | High risk | Randomisation: computer generated random number system with concealed envelopes |
| Allocation concealment (selection bias) | Low risk | Allocation concealment: participants open the envelope. |
| Blinding (performance bias and detection bias) | Low risk | Blinding: not possible to blind the women. Women were community dwelling therefore no caregiver. Ultrasounds were taken and assessed blinded to women’s group. Pelvic floor muscle strength (not an outcome measure) assessor not blind to group status as also delivered the intervention. |
| Incomplete outcome data (attrition bias) | Low risk | 1 woman in each group dropped out: motivation problems (PFMT woman), offered UI surgery (control woman) |
| Selective reporting (reporting bias) | Low risk | |
| Other bias | Unclear risk | Not discussed why the numbers are unequal in the randomised groups, and why there are differences in baseline characteristics. May suggest problems with the randomisation process. |
| Methods | Randomisation: A simple random numbers table was used to generate the sequence. The allocation process was controlled by a researcher not involved in the recruitment, who notified the treating physiotherapist of a woman's group allocation. Stratification: No stratification was used. Treatment arms: Comparisons: The trial had 2 arms: 1) physiotherapy‐supervised PFMT intervention (treatment appointment pre‐operatively (n = 1) and post‐operatively (n = 7)) 2) usual care provided by the surgeon. Blinding: It was not possible to blind patient to group allocation. The surgeon performing the woman's operation was not blinded. Assessment of the pelvic floor was undertaken by physiotherapist (first author) blind to the woman's group. Not stated how the assessor remained blinded. The first author also undertook the analysis and was unblinded at that stage. Treatment physiotherapist delivering the intervention was not blinded. Power calculation: Sample size calculation was based on published prevalence relating to overactive bladder. To detect a 20% difference between groups with 80% power at 5% level of significance, 22 women per group were needed. A target of 58 in total was set to allow for drop‐outs. Intention to treat: It is stated that an intention to treat analysis was undertaken. However those women who did not receive the allocated intervention and those who discontinued the intervention are not included in analysis (figure 1). Last observation carried forward method was used to handle missing observations. Follow‐up: Assessment was carried out pre‐operatively and at 3, 6 and 12 months post‐operatively, with 12 months as the primary outcome. | |
| Participants | Study population: Women having vaginal or laparoscopic assisted vaginal surgery for repair of prolapse (primary or recurrent), and/or hysterectomy. Diagnosis: Women were entered to trial by fact that they were having surgery irrespective of diagnosis. Number/type of centres: Recruitment took place in 6 metropolitan private hospitals in Melbourne. It was not clear how many gynaecologists were involved in recruiting. Exclusion criteria: Excluded were women who were having surgery for cancer, or concomitant surgery for urinary incontinence. Characteristics of population: The type and severity of prolapse were not stated. Not all women had prolapse (3 women had hysterectomy for reasons other than prolapse). Types of surgery (% in control group/% in PFMT group):
Baseline comparison of treatment groups:
Baseline characteristics were similar in each group except the control group had higher BMI (27.6 v 25) and fewer vaginal deliveries (2.4 v 3.2). Urinary incontinence present: Women self reported the presence of UI: controls were less likely to report incontinence (8/27 control v 18/24 PFMT). Average UDI total score: 41.0 control group and 82.5 treatment group (because of these differences at baseline, time 1 score was used as a covariate in further analyses). Withdrawals:
| |
| Interventions | Comparisons: Control (usual care) v Treatment (Physiotherapist supervised PFMT intervention). Descriptions: PFMT: 1 pre‐operative appointment and 7 post‐operative appointments. Increase in effort to maximum voluntary contraction, set of 6‐8 second contractions, with rest in between, repeated 8‐12 times, 3 times per day, variety of positions progressing from lying to upright. Early post‐op gradual increase to pre‐op intensity by 6 weeks. Maintenance of intense level for 3‐6 months, then reduction to 1‐2 sets per day by 12 months. At all sessions counterbracing (the Knack) is taught, PFMT is varied according to the individual woman’s needs and adjunctive therapy (biofeedback with pressure manometry, electrical stimulation for absent/very weak contraction or OAB) used at the discretion of the physiotherapist. All participants: receive usual care from surgeon and nursing staff. In some cases this might include information about pelvic floor exercises and encouragement to perform them, and advice on bladder and bowel function, and general advice on returning to normal activities. Therapists: No detail was given of the therapists providing the intervention. Compliance: Adherence with intervention was measured using a training diary in treatment group. There was 89% attendance at physiotherapy appointments, 47% successful receipt of telephone calls, 71% return of home exercise diaries, 89% adherence with the prescribed exercise dose. | |
| Outcomes | Definition of cure: None stated specifically. Sample size calculation suggests a 20% improvement in OAB score from the UDI is considered a clinically reasonable improvement. Outcomes: Primary outcome:
Secondary outcome:
Results:
| |
| Notes |
| |
| Risk of bias | ||
| Bias | Authors' judgement | Support for judgement |
| Random sequence generation (selection bias) | Low risk | A simple random numbers table was used to generate the sequence. |
| Allocation concealment (selection bias) | Low risk | This was controlled by a researcher not involved in the recruitment, who notified the treating physiotherapist of a woman’s group allocation. |
| Blinding (performance bias and detection bias) | Low risk | Assessment of the pelvic floor was undertaken by physiotherapist blind to group. Not stated how blinding achieved. Treatment physiotherapist not blinded. Not possible to blind patient. Surgeon not blinded. Blinding of caregiver not relevant. |
| Incomplete outcome data (attrition bias) | Low risk | Withdrawals adequately reported. |
| Selective reporting (reporting bias) | Low risk | |
| Other bias | Low risk | |
| Methods | Randomisation: No description of the randomisation process. No detail of allocation concealment. Stratification: No stratification was described Treatment arms: 2 arms in the trial: conservative treatment group; non‐treated group Blinding: no detail Power calculation: no detail Intention to treat: no detail Follow‐up: Follow‐up was immediate post‐treatment for the treatment group and 3 months after first consultation for the control group. A 2 year follow‐up was carried out for the treatment group only. | |
| Participants | Study population: Total study population was 47 women; 27 randomised to the treatment group; 20 to the control group Diagnosis: Diagnosis of prolapse was made using the ICS classification (unsure whether this refers to POP‐Q, the reference given, Cosson et al, could not be obtained). Stage was assessed by gynaecologists. Number/type of centres: No detail was given about the number or type of centres included in the trial Inclusion criteria: Women with Stage I or II cystocele, with or without stage I rectocele, were eligible Exclusion criteria: Advanced prolapse, previous pelvic surgery, having other treatment with potential effect on bladder and sphincter function, neurological condition Characteristics of population: Average age 53.42 (SD 11.01), duration of symptoms 26.53 months (SD 6.65), pelvic heaviness 85%, dysuria 76.59%, frequency 40.42%, urgency 14.81%, stress incontinence 40.42% Baseline comparison of treatment groups: Groups were comparable in terms of number of pregnancies, parity and obstetric factors, and chronic bronchitis, constipation and menopausal status Urinary incontinence present: Urinary incontinence was present in 40.42% of participants Withdrawals: No detail of withdrawals was given | |
| Interventions | Comparisons: 1) Pelvic floor exercises+healthy living advice vs 2) no treatment. Descriptions: PFMT:
Therapists: No detail of who delivered the intervention, nor the total duration. Compliance: | |
| Outcomes | Definition of cure: Definition of cure appears to be absence of pelvic heaviness. Outcomes:
Immediately post‐treatment, pelvic heaviness persisted in five women (19%) from the treatment group compared with fourteen (70%) in the control group (P < 0.001). There were also significant differences in other outcomes, including quality of life and urodynamic measures. It was reported that 20 women from the intervention group retained benefits two years after the treatment had ceased. | |
| Notes |
| |
| Risk of bias | ||
| Bias | Authors' judgement | Support for judgement |
| Random sequence generation (selection bias) | Unclear risk | no description given |
| Allocation concealment (selection bias) | Unclear risk | no description given |
| Blinding (performance bias and detection bias) | Unclear risk | no description given |
| Incomplete outcome data (attrition bias) | Unclear risk | no description given |
| Selective reporting (reporting bias) | Unclear risk | no description given |
| Other bias | Unclear risk | no description given |
| Methods | Randomisation: Randomised controlled trial, single blind. Automated telephone randomisation system for group allocation. Stratification: Stratified by number of deliveries and centre. Treatment arms: PFMT versus control (lifestyle leaflet) Blinding: Women and therapist not blind to group allocation. Gynaecologist undertaking POP‐Q assessment blind to group allocation (women asked not to reveal their group and chaperone at assessment to enforce this). Power calculation: feasibility study therefore no power calculation carried out. Intention to treat: women analysed in the group they were randomised to. Follow‐up: questionnaire follow‐up at 20 weeks and 26 weeks post‐randomisation; gynaecology review appointment (including POP‐Q) at 20 weeks post‐randomisation. | |
| Participants | Study population: 47 women with stage I or II prolapse of any type identified at their first appointment at gynaecology outpatient clinics at two centres in Scotland; 23 intervention, 24 control. Diagnosis: prolapse of any type diagnosed using the POP‐Q assessment carried out by a gynaecologist at the first appointment. Number/type of centres: 2 centres, both large teaching hospitals Exclusion criteria: stage 0, III or IV prolapse; main presenting problem not prolapse Characteristics of population:
Baseline comparison of treatment groups: There were no significant differences between the groups with respect to age, parity, method of delivery, type or duration of prolapse, or prevalence of symptoms. Withdrawals: intervention group 4, control group 3; questionnaire response rate at 20 weeks was 87% and at 26 weeks was 85%; 89% of women attended their 20‐week follow‐up gynaecology review appointment when POP‐Q reassessment was undertaken. | |
| Interventions | Comparisons: PFMT group versus control group. Descriptions: PFMT: Women in the intervention group attended 5 physiotherapy sessions over 16 weeks (weeks 0, 2, 6, 11 and 16) where pelvic floor exercise techniques were taught and advice on modifying lifestyle was given. An individually tailored exercise programme was provided by the physiotherapist which was performed by the women at home. 6 sets of exercises per day was recommended. One set consisted of up to 10 maximum voluntary contractions held for up to 10 seconds, with 4 seconds rest between each contraction and, after a 1 minute rest, 10 or more fast contractions in a row. Control: The control group were sent a lifestyle advice leaflet containing things they might try to help prolapse (weight loss, and avoidance of constipation, heavy lifting, coughing and high impact exercise). All participants: Both groups of women had a review appointment with a gynaecologist at 20 weeks post‐randomisation. Therapists: local physiotherapists, who were specialists in women's health, delivered the PFMT intervention. There were 2 intervention physiotherapists at each centre. Compliance: 91% of intervention women attended 3 or more PFMT appointments, 74% attended 4 appointments, and 65% attended 5 appointments. 61% of women in the intervention group were rated as good or moderate exercise compliers. | |
| Outcomes | Definition of cure: improved prolapse symptoms. Outcomes: outcomes measured were POP‐Q (baseline and 20 weeks), symptom and quality of life questionnaires relating to prolapse, urinary symptoms, bowel symptoms and sexual function (baseline, 20 and 26 weeks), general health status. Primary outcome: prolapse symptom severity measured using the Prolapse Symptom Score (POP‐SS) and prolapse related quality of life (visual analogue scale). Secondary outcome: prolapse severity (POP‐Q), urinary leakage (ICIQ‐UI SF), bowel symptoms (ICIQ bowel), sexual symptoms (ICIQ vaginal symptoms), general health status (SF‐12). Results:
| |
| Notes |
| |
| Risk of bias | ||
| Bias | Authors' judgement | Support for judgement |
| Random sequence generation (selection bias) | Low risk | computer generated allocations |
| Allocation concealment (selection bias) | Low risk | remote system with telephone access |
| Blinding (performance bias and detection bias) | Low risk | not possible for questionnaires, attempted for POP‐Q assessment (achieved in 37 out of 42 follow‐up POP‐Q assessments) |
| Incomplete outcome data (attrition bias) | Low risk | |
| Selective reporting (reporting bias) | Low risk | |
| Other bias | Low risk | |
| Methods | Randomisation: randomised controlled, single blind trial. Randomisation in blocks of size 20. Allocation by computer‐generated random numbers. Information on group allocation was stored in a separate location, concealed in opaque envelopes. The treating physiotherapist opened the envelope after a woman was recruited. Stratification: none mentioned Treatment arms: PFMT versus standard care Blinding: pelvic floor muscle assessment and paper towel test at 12 weeks were blinded. Power calculation: used a clinically significant difference between the groups of 30% from other quality of life studies. Based on this assumption, a sample size of 60 was required with 30 in each group. Intention to treat: not mentioned. No details of numbers in the analysis in order to judge. Follow‐up: Women were followed up for 3 months. | |
| Participants | Study population: 60 women who were scheduled to undergo surgery to correct prolapse and/or incontinence. 30 intervention, 30 control. Recruitment April 2000 to December 2003. Diagnosis: prolapse and/or urinary incontinence. Number/type of centres: endo‐gynaecology department at 1 hospital. Recruitment involved women having surgery with 23 gynaecologists at the hospital. Exclusion criteria: women with neuromuscular disorders or other significant medical problems, or those who had pelvic floor muscle intervention as a routine part of their presurgical assessment. Women undergoing tension‐free vaginal tape as the sole intervention were also excluded due to short length of their hospital stay. Characteristics of population: Baseline comparison of treatment groups: Demographics and type of surgery for the two groups were similar. There were
Urinary incontinence present: not known as baseline urinary measures not presented. Withdrawals: Surgery was cancelled for 3/30 intervention women and 1/30 control woman. States 4 intervention women and 2 control women dropped out. Authors state there were a number of missed appointments and women lost to follow‐up, but the details are not given. It is not known how many women are therefore included in the data analysis. | |
| Interventions | Comparisons: PFMT versus control. Descriptions: PFMT: Instructions were given by a physiotherapist on the performance of pelvic floor muscle exercises, and an individually tailored programme of pelvic floor muscle exercises was provided. Women were advised to do 4 sets of exercises a day. Information and advice on pelvic bracing, voiding postures and defaecation techniques. Intervention women saw the physiotherapist on the second post‐operative day to reinforce the exercise program, and had a 6‐week post‐operative visit. Control: Received standard care. Did not receive the PFMT intervention. All participants: Women in both the intervention and control group underwent surgical procedures for prolapse and/or incontinence and received standard care. Therapists: no detail Compliance: not reported | |
| Outcomes | Definition of cure: Outcomes: No prolapse‐specific outcomes were measured. At baseline (pre‐admission) and 12 weeks post‐operatively all women had:
Primary outcome: no primary outcome specified although sample size based on difference in quality of life. Secondary outcome: not specified Results:
| |
| Notes |
| |
| Risk of bias | ||
| Bias | Authors' judgement | Support for judgement |
| Random sequence generation (selection bias) | Low risk | |
| Allocation concealment (selection bias) | Low risk | opaque envelopes stored in a location away from the clinic |
| Blinding (performance bias and detection bias) | Low risk | physiotherapist undertaking the 12 week assessments was blind to group allocation. |
| Incomplete outcome data (attrition bias) | Unclear risk | details of missing data, other that number of women who withdrew, not given |
| Selective reporting (reporting bias) | Low risk | |
| Other bias | Unclear risk | not clear what the sample sizes were for the outcomes reported as no details of missing values given |
| Methods | Randomisation: Cluster randomised controlled, single blind trial. No detail of randomisation method. Clustering by post code area. Stratification: none mentioned Treatment arms: pelvic floor muscle training versus non treated control Blinding: doctor assessing prolapse at follow‐up was blinded to the woman's previous assessment. No mention of blinding of group allocation. Power calculation: no power calculation was described Intention to treat: no mention of whether an intention to treat analysis was used Follow‐up: Follow‐up was conducted at 6, 12 and 24 months. 18‐month follow‐up planned but was not possible. | |
| Participants | Study population: 654 community‐dwelling Thai women, over 60 years of age and living within 10 km of the hospital where the trial was conducted, with or without anterior wall pelvic organ prolapse. Intervention: n = 330, control: n = 324. Diagnosis: vaginal examination before and during Valsalva. No prolapse: anterior wall did not protrude during Valsalva; mild prolapse: protrusion of anterior wall during Valsalva which could be measured by area; severe prolapse: protrusion of anterior vaginal wall during Valsalva which could be by volume. Number/type of centres: women were recruited via 1 hospital Exclusion criteria:
Characteristics of population: 69.9% of the 682 women examined had anterior prolapse, of whom 30.4% had severe prolapse and 39.6% had mild prolapse. 654/682 women were eligible for the trial. Age range 60 to 88 years, 50% age 60 to 65 years, 25% 66 to 70 years, 25% >70 years. The largest group, 41.6%, had had between 4 and 6 births. Baseline comparison of treatment groups: There were no significant differences between groups in the baseline characteristics.
Urinary incontinence present: no detail given Withdrawals: based on information about attendance at follow‐up appointments it appears that 88 intervention group women and 91 control group women did not attend for any follow‐up. | |
| Interventions | Comparisons: PFMT versus control Descriptions: PFMT: instruction in the performance of pelvic floor muscle exercises. It appears that this happened on one occasion but if a woman could not perform them correctly, she attended monthly until she could do so. 30 exercises "after one meal every day" (note: personal communication with the lead author suggested it was exercise after EACH meal). In addition, advice on diet regarding alleviating constipation (to eat more fruit, vegetables and boiled rice, and to drink at least 2 litres of water a day). Control: no treatment. Therapists: No indication of who delivered the intervention. Compliance: All the women were eventually able to perform the exercises satisfactorily. No details of compliance. | |
| Outcomes | Definition of cure: The success of the intervention in preventing the worsening of anterior wall prolapse was assessed. Outcomes: Primary outcome: The main outcome recorded was the severity of prolapse, assessed using a study‐defined (i.e. non‐standardised) system: on Valsalva, no prolapse (no protrusion of the anterior vaginal wall), mild (protrusion of anterior wall seen and measured as an area) or severe (protrusion measured as a volume).
Secondary outcome: There were no outcome measures relating to symptoms of prolapse or to constipation, other bowel or urinary symptoms. It was reported however that some women did not need to use laxatives. | |
| Notes |
| |
| Risk of bias | ||
| Bias | Authors' judgement | Support for judgement |
| Random sequence generation (selection bias) | Unclear risk | No detail of randomisation process. |
| Allocation concealment (selection bias) | Unclear risk | No detail of allocation process. |
| Blinding (performance bias and detection bias) | High risk | Doctor assessing prolapse at follow‐up was blinded to the woman's previous assessment, but no mention of whether blind to group allocation. |
| Incomplete outcome data (attrition bias) | High risk | No information given about attrition. |
| Selective reporting (reporting bias) | High risk | Seems that data only reported for a subgroup of the women randomise: those with mild or severe prolapse at the start, excluding those with no prolapse. Numerical information presented was limited. |
| Other bias | Unclear risk | no description given |
BMI = body mass index; ICS = International Continence Society; OAB = overactive bladder; POP = pelvic organ prolapse; POP‐Q = Pelvic Organ Prolapse Quantification system; PFM = pelvic floor muscles; PFMT = pelvic floor muscle training; QoL = quality of life; SD = standard deviation; UDI = Urogenital Distress Inventory.
Characteristics of excluded studies [ordered by study ID]
| Study | Reason for exclusion |
| Not an RCT. Women with pelvic organ prolapse stage I to III (ICS classification) were included in the study. Intervention includes pelvic floor exercises combines with an intravaginal device (Kolpexin). No control group. Outcomes assessed at initial visit and at 6 weeks. The distance between the introitus and the cervix increased (from 6.7 ± 0.9 to 9.0 ± 1.4 cm) as did the distance between the introitus and levator ani (from 0.69 ± 0.88 to 2.07 ± 1.41 cm). The width of the genital hiatus decreased (from 4.12 ± 0.27 to 3.78 ± 0.30 cm). The separate effects of pelvic floor exercises and Kolpexin could not be elucidated. | |
| Not an RCT. Thirty‐nine women with stage three or higher vaginal prolapse were included in the study. Intervention includes pelvic floor exercises combines with an intravaginal device (Colpexin®). No control group. At sixteen weeks follow up, 63% showed increased muscle function, Incontinence Impact Questionnaire scores showed no change, however Urogenitary Distress Inventory ratings demonstrated a significant improvement. | |
| This was a feasibility trial comparing traditional PFMT with a Pilates program, however the women were recruited from the community and did not necessarily have pelvic floor dysfunction. Therefore the findings do not contain information about treatment. The only outcome measured was pelvic floor muscle strength. | |
| Not an RCT. Intervention includes defaecatory behavioural therapy, counselling, health education, biofeedback (EMG), and coordination exercises (details in Storrie JB, British Journal of Nursing, 1997, Vol. 6, No. 3). No control group. Patients were 32 women with rectocele of 2 cm or more. At 10 months follow‐up, 12% were cured of bowel symptoms, 88% still experiencing some bowel symptoms. Outcome for prolapse not measured. Three women went on to have a prolapse repair, one a colostomy. |
EMG = Electromyography; RCT = randomised control trial; PFMT = pelvic floor muscle training.
Characteristics of ongoing studies [ordered by study ID]
| Trial name or title | Operations and Pelvic Muscle Training in the Management of Apical Support Loss: The OPTIMAL Trial: A randomized trial of sacrospinous ligament fixation (SSLF) versus uterosacral ligament suspension (ULS) with and without perioperative behavioral therapy/pelvic muscle training |
| Methods | 2 x 2 factorial randomised controlled trial |
| Participants | Women having surgical repair for apical or uterine pelvic organ prolapse of stage 2 or greater, who also have stress urinary incontinence Required sample size is 340 women. |
| Interventions | Women are randomised to both surgery type and behavioural intervention: surgery: 1) sacrospinous ligament fixation, or 2) uterosacral vaginal vault suspension perioperative behavioural intervention: 1) individualised behavioural and pelvic floor muscle training (1 pre‐operative visit and 4 post‐operative visits with behavioural interventionist for progressive PFMT and exercise and education in behavioural strategies), or 2) usual care (usual peri‐operative teaching and post‐operative instructions) |
| Outcomes | endpoints for the behavioural intervention: short term (6 months) improvement in urinary symptoms (UDI subscale of PFDI) and long term (2 years) improvement in anatomic outcomes and prolapse symptoms (POPDI subscale of the UDI). |
| Starting date | February 2008 |
| Contact information | Matthew D Barber, Obstetrics, Gynecology and Women's Health Institute, Cleveland, USA |
| Notes | Interventionists included physical therapists, registered nurses and certified registered nurse practitioners who had standardised training. Estimated trial completion date is February 2012. ClinicalTrials.gov identifier NCT00597935 |
| Trial name or title | A multi‐centre randomised controlled trial of a pelvic floor muscle training intervention for women with pelvic organ prolapse (POPPY Trial) |
| Methods | Parallel group RCT of PFMT versus control |
| Participants | women with stage I, II or III prolapse of any type |
| Interventions | individualised PFMT:16 week duration, 5 appointments with specialist physiotherapist |
| Outcomes | prolapse symptoms and QoL at 12 months, POP‐Q at 6 months, need for further treatment at 6 months, bladder, bowel and sexual symptoms |
| Starting date | April 2007 |
| Contact information | Suzanne Hagen, NMAHP Research Unit, [email protected] |
| Notes | Recruitment complete, 12 month follow‐up complete April 2011 ISRCTN 35911035 |
| Trial name or title | A Study of the Effects of Physiotherapy to Prevent Pelvic Organ Prolapse (PREVPROL) |
| Methods | A Multicentre Randomised Controlled Trial of Pelvic Floor Muscle Training to Prevent Pelvic Organ Prolapse in Women |
| Participants | Women involved in the ProLong cohort study who:
Women must be willing to participate in the Trial and to comply with their group allocation. Exclusion Criteria: Women:
|
| Interventions | Women allocated to the intervention group will have five appointments with a specialist women's health physiotherapist (intervention physiotherapist) over 16 weeks who will prescribe a daily exercise programme and provide a Lifestyle Advice Sheet (focusing on weight loss, constipation, avoidance of heavy lifting, coughing and high‐impact exercise) and relevant tailored advice (phase 1). Thereafter women in the intervention group will be offered Pilates‐based classes, including PFMT, as maintenance (phase 2). Classes will be led by a physiotherapist who has undertaken Pilates training and will take place in six week blocks; each woman will be offered two six week blocks over a year. An exercise DVD will be provided for home use. Each woman will be offered a one‐to‐one review physiotherapy appointment at one and two years after randomisation. Women allocated to the Control group will only receive, by post, the same Lifestyle Advice Sheet as the intervention group. |
| Outcomes | Prolapse symptoms, severity and quality of life; urinary symptoms bowel symptoms; sexual symptoms; general health status |
| Starting date | Recruitment started 12/10/10 |
| Contact information | Suzanne Hagen ([email protected]) |
| Notes |
PFDI = Pelvic Floor Distress Inventory; POPDI = Pelvic Organ Prolapse Distress Inventory; UDI = Urogenital Distress Inventory.
Data and analyses
| Outcome or subgroup title | No. of studies | No. of participants | Statistical method | Effect size |
| 1 number with increased frequency of prolapse symptoms Show forest plot | 1 | 69 | Risk Ratio (M‐H, Fixed, 95% CI) | 0.37 [0.21, 0.65] |
| Analysis 1.1  Comparison 1 PFMT versus no treatment, Outcome 1 number with increased frequency of prolapse symptoms. | ||||
| 2 number with increased bother of prolapse symptoms Show forest plot | 1 | 69 | Risk Ratio (M‐H, Fixed, 95% CI) | 0.56 [0.33, 0.97] |
| Analysis 1.2  Comparison 1 PFMT versus no treatment, Outcome 2 number with increased bother of prolapse symptoms. | ||||
| 3 number with pelvic heaviness Show forest plot | 1 | 47 | Risk Ratio (M‐H, Fixed, 95% CI) | 0.26 [0.11, 0.61] |
| Analysis 1.3  Comparison 1 PFMT versus no treatment, Outcome 3 number with pelvic heaviness. | ||||
| 4 prolapse symptom score: mean change from baseline Show forest plot | 1 | 37 | Mean Difference (IV, Fixed, 95% CI) | ‐3.37 [‐6.23, ‐0.51] |
| Analysis 1.4  Comparison 1 PFMT versus no treatment, Outcome 4 prolapse symptom score: mean change from baseline. | ||||
| 5 self‐report of no improvement in prolapse Show forest plot | 1 | 40 | Risk Ratio (M‐H, Fixed, 95% CI) | 0.48 [0.26, 0.91] |
| Analysis 1.5  Comparison 1 PFMT versus no treatment, Outcome 5 self‐report of no improvement in prolapse. | ||||
| 6 prolapse QoL score Show forest plot | 2 | 87 | Std. Mean Difference (IV, Fixed, 95% CI) | ‐0.51 [‐0.94, ‐0.07] |
| Analysis 1.6  Comparison 1 PFMT versus no treatment, Outcome 6 prolapse QoL score. | ||||
| 6.1 mean score for prolapse interference with everyday life | 1 | 40 | Std. Mean Difference (IV, Fixed, 95% CI) | ‐0.05 [‐0.67, 0.57] |
| 6.2 Ditrovie quality of life score | 1 | 47 | Std. Mean Difference (IV, Fixed, 95% CI) | ‐0.95 [‐1.57, ‐0.34] |
| 7 Satisfaction with treatment (visual analogue scale 0‐10) Show forest plot | 1 | 47 | Mean Difference (IV, Fixed, 95% CI) | ‐3.22 [‐3.79, ‐2.65] |
| Analysis 1.7  Comparison 1 PFMT versus no treatment, Outcome 7 Satisfaction with treatment (visual analogue scale 0‐10). | ||||
| 8 number with POP‐Q stage not improved Show forest plot | 2 | 128 | Risk Ratio (M‐H, Fixed, 95% CI) | 0.83 [0.71, 0.96] |
| Analysis 1.8  Comparison 1 PFMT versus no treatment, Outcome 8 number with POP‐Q stage not improved. | ||||
| 9 POP‐Q measurements Show forest plot | 1 | Mean Difference (IV, Fixed, 95% CI) | Totals not selected | |
| Analysis 1.9  Comparison 1 PFMT versus no treatment, Outcome 9 POP‐Q measurements. | ||||
| 9.1 mean post ‐ pre POP‐Q Ba measurement | 1 | Mean Difference (IV, Fixed, 95% CI) | 0.0 [0.0, 0.0] | |
| 9.2 mean post ‐ pre POP‐Q Aa measurement | 1 | Mean Difference (IV, Fixed, 95% CI) | 0.0 [0.0, 0.0] | |
| 10 mean pelvic floor muscle measures Show forest plot | 2 | Mean Difference (IV, Fixed, 95% CI) | Subtotals only | |
| Analysis 1.10  Comparison 1 PFMT versus no treatment, Outcome 10 mean pelvic floor muscle measures. | ||||
| 10.1 manometry strength improvement (cm H2O) | 1 | 109 | Mean Difference (IV, Fixed, 95% CI) | ‐12.00 [‐14.90, ‐9.10] |
| 10.2 manometry endurance improvement (cm H2O sec) | 1 | 109 | Mean Difference (IV, Fixed, 95% CI) | ‐99.0 [‐131.47, ‐66.53] |
| 10.3 other strength measure | 1 | 47 | Mean Difference (IV, Fixed, 95% CI) | 1.12 [0.66, 1.58] |
| 11 number with worse bladder symptoms Show forest plot | 1 | Risk Ratio (M‐H, Fixed, 95% CI) | Subtotals only | |
| Analysis 1.11  Comparison 1 PFMT versus no treatment, Outcome 11 number with worse bladder symptoms. | ||||
| 11.1 SUI: number with increased frequency | 1 | 66 | Risk Ratio (M‐H, Fixed, 95% CI) | 0.36 [0.20, 0.66] |
| 11.2 SUI: number with increased bother | 1 | 66 | Risk Ratio (M‐H, Fixed, 95% CI) | 0.44 [0.26, 0.74] |
| 11.3 UUI: number with increased frequency | 1 | 39 | Risk Ratio (M‐H, Fixed, 95% CI) | 0.61 [0.33, 1.12] |
| 11.4 UUI: number with increased bother | 1 | 39 | Risk Ratio (M‐H, Fixed, 95% CI) | 0.59 [0.35, 1.01] |
| 12 change in ICIQ UI‐SF Show forest plot | 1 | 39 | Mean Difference (IV, Fixed, 95% CI) | ‐1.79 [‐3.68, 0.10] |
| Analysis 1.12  Comparison 1 PFMT versus no treatment, Outcome 12 change in ICIQ UI‐SF. | ||||
| 13 mean bladder symptom score Show forest plot | 1 | 47 | Mean Difference (IV, Fixed, 95% CI) | ‐9.22 [‐10.68, ‐7.76] |
| Analysis 1.13  Comparison 1 PFMT versus no treatment, Outcome 13 mean bladder symptom score. | ||||
| 14 urodynamics: post void residual (mL) Show forest plot | 1 | 47 | Mean Difference (IV, Fixed, 95% CI) | ‐21.28 [‐32.75, ‐9.81] |
| Analysis 1.14  Comparison 1 PFMT versus no treatment, Outcome 14 urodynamics: post void residual (mL). | ||||
| 15 urodynamics: flow rate (mL/s) Show forest plot | 1 | 47 | Mean Difference (IV, Fixed, 95% CI) | ‐3.23 [‐5.16, ‐1.30] |
| Analysis 1.15  Comparison 1 PFMT versus no treatment, Outcome 15 urodynamics: flow rate (mL/s). | ||||
| 16 urodynamics: closure pressure (cm H2O) Show forest plot | 1 | 47 | Mean Difference (IV, Fixed, 95% CI) | ‐4.86 [‐12.06, 2.34] |
| Analysis 1.16  Comparison 1 PFMT versus no treatment, Outcome 16 urodynamics: closure pressure (cm H2O). | ||||
| 17 number with dysuria Show forest plot | 1 | 47 | Risk Ratio (M‐H, Fixed, 95% CI) | 0.31 [0.13, 0.74] |
| Analysis 1.17  Comparison 1 PFMT versus no treatment, Outcome 17 number with dysuria. | ||||
| 18 number with stress incontinence Show forest plot | 1 | 47 | Risk Ratio (M‐H, Fixed, 95% CI) | 0.16 [0.04, 0.68] |
| Analysis 1.18  Comparison 1 PFMT versus no treatment, Outcome 18 number with stress incontinence. | ||||
| 19 number with urgency Show forest plot | 1 | 47 | Risk Ratio (M‐H, Fixed, 95% CI) | 0.11 [0.01, 0.79] |
| Analysis 1.19  Comparison 1 PFMT versus no treatment, Outcome 19 number with urgency. | ||||
| 20 number with frequency Show forest plot | 1 | 47 | Risk Ratio (M‐H, Fixed, 95% CI) | 0.27 [0.10, 0.72] |
| Analysis 1.20  Comparison 1 PFMT versus no treatment, Outcome 20 number with frequency. | ||||
| 21 number with worse bowel symptoms Show forest plot | 1 | Risk Ratio (M‐H, Fixed, 95% CI) | Subtotals only | |
| Analysis 1.21  Comparison 1 PFMT versus no treatment, Outcome 21 number with worse bowel symptoms. | ||||
| 21.1 Emptying difficulty: number with increased frequency | 1 | 40 | Risk Ratio (M‐H, Fixed, 95% CI) | 0.67 [0.35, 1.26] |
| 21.2 Emptying difficulty: number with increased bother | 1 | 40 | Risk Ratio (M‐H, Fixed, 95% CI) | 0.94 [0.47, 1.90] |
| 21.3 Flatus leakage: number with increased frequency | 1 | 57 | Risk Ratio (M‐H, Fixed, 95% CI) | 0.60 [0.40, 0.91] |
| 21.4 Flatus leakage: number with increased bother | 1 | 57 | Risk Ratio (M‐H, Fixed, 95% CI) | 0.68 [0.46, 0.99] |
| 21.5 Loose FI: number with increased frequency | 1 | 34 | Risk Ratio (M‐H, Fixed, 95% CI) | 0.60 [0.39, 0.92] |
| 21.6 Loose FI: number with increased bother | 1 | 24 | Risk Ratio (M‐H, Fixed, 95% CI) | 0.38 [0.20, 0.76] |
| 21.7 Solid FI: number with increased frequency | 1 | 5 | Risk Ratio (M‐H, Fixed, 95% CI) | 2.25 [0.13, 38.09] |
| 21.8 Solid FI: number with increased bother | 1 | 5 | Risk Ratio (M‐H, Fixed, 95% CI) | 0.67 [0.08, 5.54] |
| Outcome or subgroup title | No. of studies | No. of participants | Statistical method | Effect size | ||||||||||||||||||
| 1 Change in manometry measures (cm H2O) Show forest plot | 1 | Mean Difference (IV, Fixed, 95% CI) | Subtotals only | |||||||||||||||||||
| Analysis 14.1  Comparison 14 PFMT and/or lifestyle plus surgery versus surgery, Outcome 1 Change in manometry measures (cm H2O). | ||||||||||||||||||||||
| 1.1 vaginal resting pressure | 1 | 31 | Mean Difference (IV, Fixed, 95% CI) | ‐0.20 [‐3.67, 3.27] | ||||||||||||||||||
| 1.2 vaginal squeeze pressure: peak maximum | 1 | 41 | Mean Difference (IV, Fixed, 95% CI) | 2.9 [‐2.06, 7.86] | ||||||||||||||||||
| 1.3 vaginal squeeze pressure: area maximum | 1 | 41 | Mean Difference (IV, Fixed, 95% CI) | 8.2 [‐5.79, 22.19] | ||||||||||||||||||
| 2 Digital muscle test (modified Oxford) Show forest plot | 1 | 50 | Mean Difference (IV, Fixed, 95% CI) | 0.48 [0.12, 0.84] | ||||||||||||||||||
| Analysis 14.2  Comparison 14 PFMT and/or lifestyle plus surgery versus surgery, Outcome 2 Digital muscle test (modified Oxford). | ||||||||||||||||||||||
| 3 Change in UDI total score (12 months post‐op ‐ baseline) Show forest plot | 1 | 49 | Mean Difference (IV, Fixed, 95% CI) | ‐9.90 [‐24.46, 4.66] | ||||||||||||||||||
| Analysis 14.3  Comparison 14 PFMT and/or lifestyle plus surgery versus surgery, Outcome 3 Change in UDI total score (12 months post‐op ‐ baseline). | ||||||||||||||||||||||
| 4 Change in UDI irritative score (12 months post‐op ‐ baseline) Show forest plot | 1 | 49 | Mean Difference (IV, Fixed, 95% CI) | ‐0.40 [‐5.53, 4.73] | ||||||||||||||||||
| Analysis 14.4  Comparison 14 PFMT and/or lifestyle plus surgery versus surgery, Outcome 4 Change in UDI irritative score (12 months post‐op ‐ baseline). | ||||||||||||||||||||||
| 5 Change in UDI stress score (12 months post‐op ‐ baseline) Show forest plot | 1 | 49 | Mean Difference (IV, Fixed, 95% CI) | ‐5.5 [‐15.76, 4.76] | ||||||||||||||||||
| Analysis 14.5  Comparison 14 PFMT and/or lifestyle plus surgery versus surgery, Outcome 5 Change in UDI stress score (12 months post‐op ‐ baseline). | ||||||||||||||||||||||
| 6 Change in UDI obstructive score (12 months post‐op ‐ baseline) Show forest plot | 1 | 49 | Mean Difference (IV, Fixed, 95% CI) | ‐0.60 [‐4.07, 2.87] | ||||||||||||||||||
| Analysis 14.6  Comparison 14 PFMT and/or lifestyle plus surgery versus surgery, Outcome 6 Change in UDI obstructive score (12 months post‐op ‐ baseline). | ||||||||||||||||||||||
| 7 Number with irritative bladder symptoms at 12 months (UDI‐19) Show forest plot | 1 | 49 | Risk Ratio (M‐H, Fixed, 95% CI) | 1.36 [0.48, 3.86] | ||||||||||||||||||
| Analysis 14.7  Comparison 14 PFMT and/or lifestyle plus surgery versus surgery, Outcome 7 Number with irritative bladder symptoms at 12 months (UDI‐19). | ||||||||||||||||||||||
| 8 Number with stress bladder symptoms at 12 months (UDI‐19) Show forest plot | 1 | 49 | Risk Ratio (M‐H, Fixed, 95% CI) | 1.13 [0.54, 2.36] | ||||||||||||||||||
| Analysis 14.8  Comparison 14 PFMT and/or lifestyle plus surgery versus surgery, Outcome 8 Number with stress bladder symptoms at 12 months (UDI‐19). | ||||||||||||||||||||||
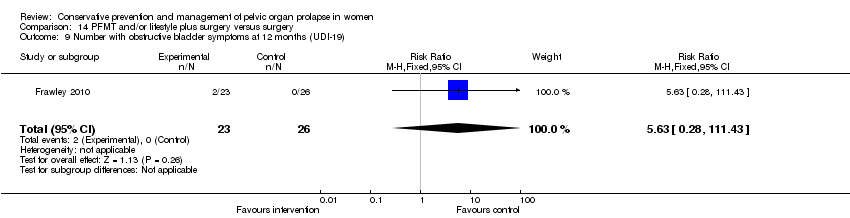
| 9 Number with obstructive bladder symptoms at 12 months (UDI‐19) Show forest plot | 1 | 49 | Risk Ratio (M‐H, Fixed, 95% CI) | 5.63 [0.28, 111.43] | ||||||||||||||||||
| Analysis 14.9  Comparison 14 PFMT and/or lifestyle plus surgery versus surgery, Outcome 9 Number with obstructive bladder symptoms at 12 months (UDI‐19). | ||||||||||||||||||||||
| 10 IIQ‐7 at 12 months Show forest plot | Other data | No numeric data | ||||||||||||||||||||
| Analysis 14.10
Comparison 14 PFMT and/or lifestyle plus surgery versus surgery, Outcome 10 IIQ‐7 at 12 months. | ||||||||||||||||||||||

PRISMA study flow diagram.
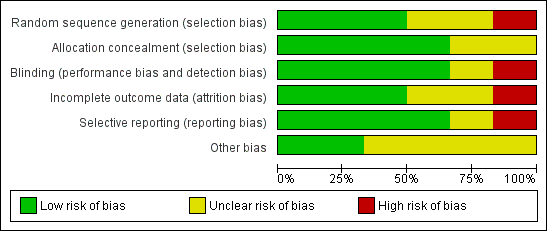
Risk of bias graph: review authors' judgements about each risk of bias item presented as percentages across all included studies.
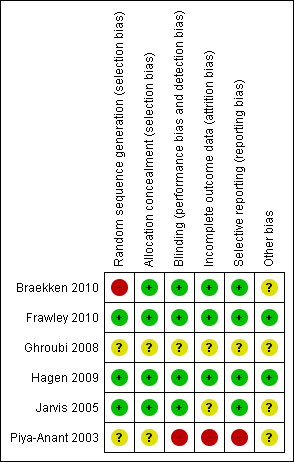
Risk of bias summary: review authors' judgements about each risk of bias item for each included study.

Comparison 1 PFMT versus no treatment, Outcome 1 number with increased frequency of prolapse symptoms.

Comparison 1 PFMT versus no treatment, Outcome 2 number with increased bother of prolapse symptoms.
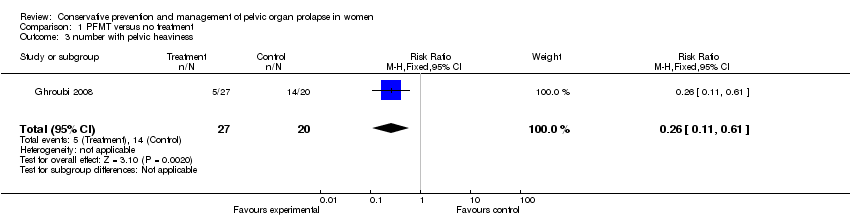
Comparison 1 PFMT versus no treatment, Outcome 3 number with pelvic heaviness.

Comparison 1 PFMT versus no treatment, Outcome 4 prolapse symptom score: mean change from baseline.

Comparison 1 PFMT versus no treatment, Outcome 5 self‐report of no improvement in prolapse.

Comparison 1 PFMT versus no treatment, Outcome 6 prolapse QoL score.
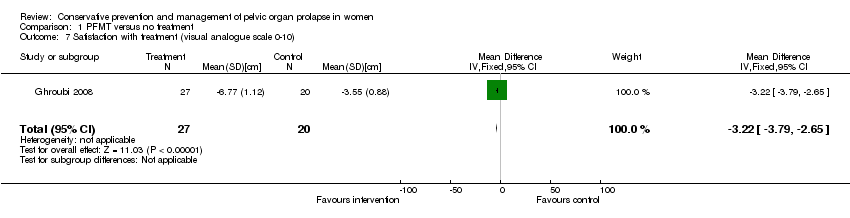
Comparison 1 PFMT versus no treatment, Outcome 7 Satisfaction with treatment (visual analogue scale 0‐10).

Comparison 1 PFMT versus no treatment, Outcome 8 number with POP‐Q stage not improved.
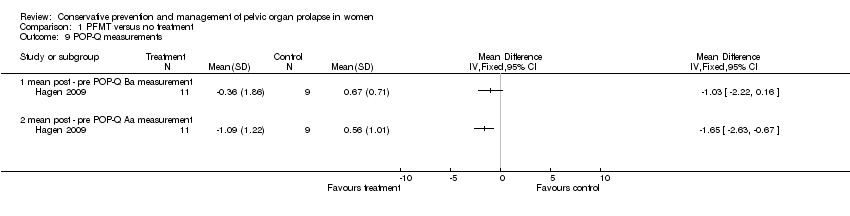
Comparison 1 PFMT versus no treatment, Outcome 9 POP‐Q measurements.
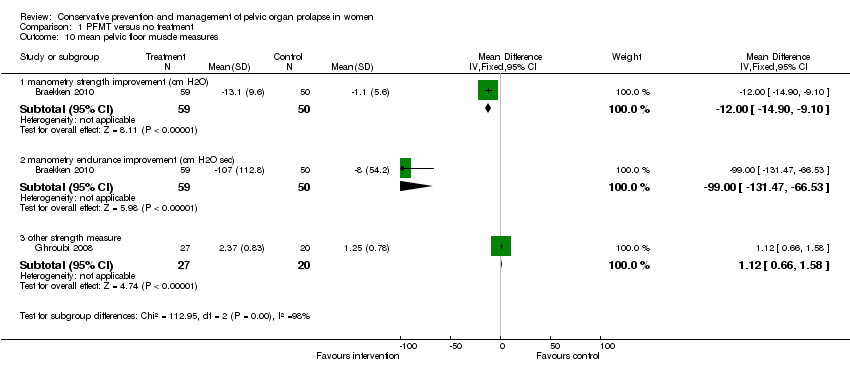
Comparison 1 PFMT versus no treatment, Outcome 10 mean pelvic floor muscle measures.
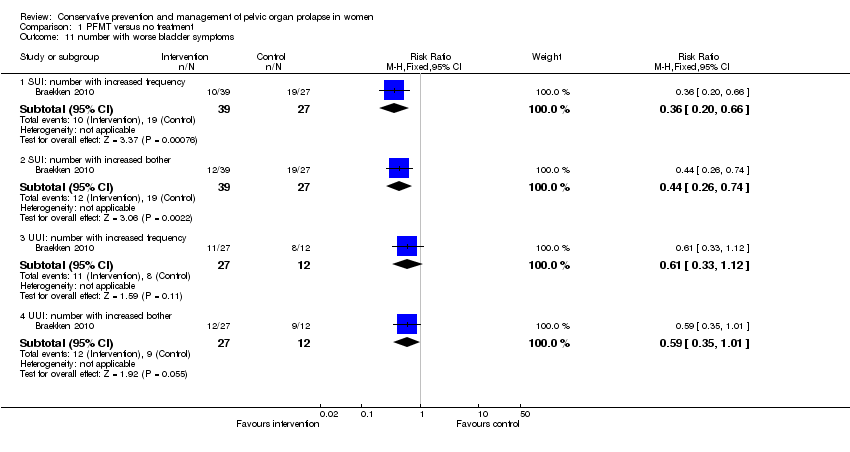
Comparison 1 PFMT versus no treatment, Outcome 11 number with worse bladder symptoms.

Comparison 1 PFMT versus no treatment, Outcome 12 change in ICIQ UI‐SF.

Comparison 1 PFMT versus no treatment, Outcome 13 mean bladder symptom score.

Comparison 1 PFMT versus no treatment, Outcome 14 urodynamics: post void residual (mL).

Comparison 1 PFMT versus no treatment, Outcome 15 urodynamics: flow rate (mL/s).

Comparison 1 PFMT versus no treatment, Outcome 16 urodynamics: closure pressure (cm H2O).
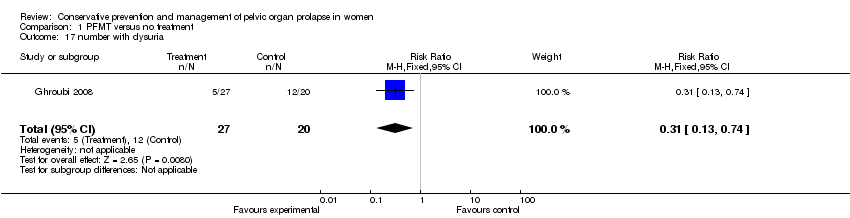
Comparison 1 PFMT versus no treatment, Outcome 17 number with dysuria.

Comparison 1 PFMT versus no treatment, Outcome 18 number with stress incontinence.

Comparison 1 PFMT versus no treatment, Outcome 19 number with urgency.

Comparison 1 PFMT versus no treatment, Outcome 20 number with frequency.
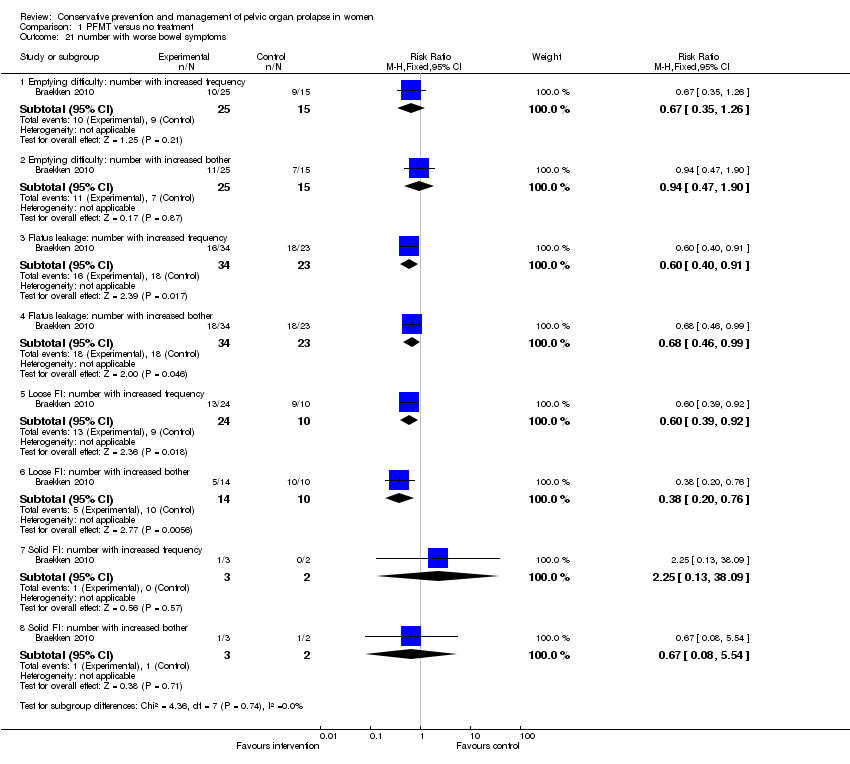
Comparison 1 PFMT versus no treatment, Outcome 21 number with worse bowel symptoms.
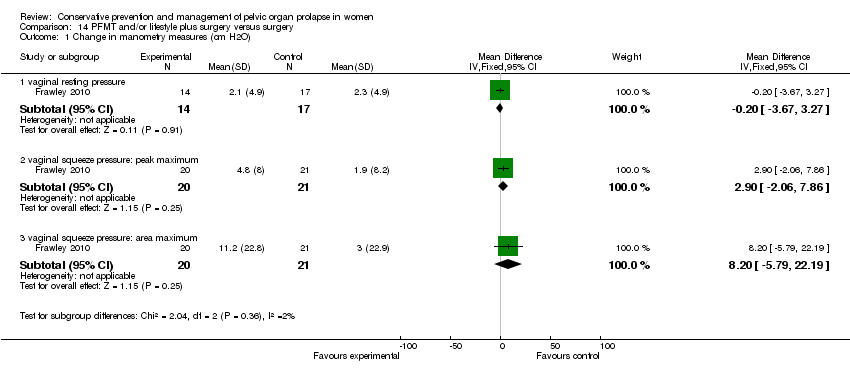
Comparison 14 PFMT and/or lifestyle plus surgery versus surgery, Outcome 1 Change in manometry measures (cm H2O).

Comparison 14 PFMT and/or lifestyle plus surgery versus surgery, Outcome 2 Digital muscle test (modified Oxford).
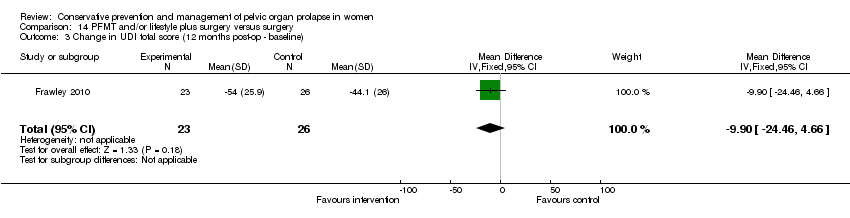
Comparison 14 PFMT and/or lifestyle plus surgery versus surgery, Outcome 3 Change in UDI total score (12 months post‐op ‐ baseline).

Comparison 14 PFMT and/or lifestyle plus surgery versus surgery, Outcome 4 Change in UDI irritative score (12 months post‐op ‐ baseline).
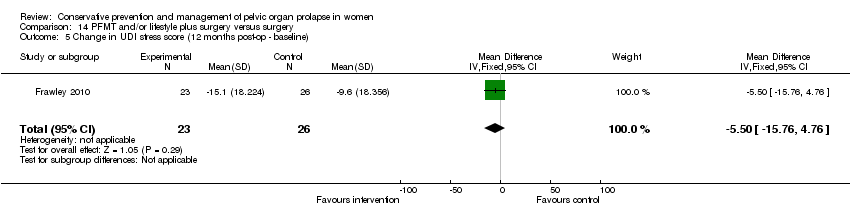
Comparison 14 PFMT and/or lifestyle plus surgery versus surgery, Outcome 5 Change in UDI stress score (12 months post‐op ‐ baseline).

Comparison 14 PFMT and/or lifestyle plus surgery versus surgery, Outcome 6 Change in UDI obstructive score (12 months post‐op ‐ baseline).

Comparison 14 PFMT and/or lifestyle plus surgery versus surgery, Outcome 7 Number with irritative bladder symptoms at 12 months (UDI‐19).

Comparison 14 PFMT and/or lifestyle plus surgery versus surgery, Outcome 8 Number with stress bladder symptoms at 12 months (UDI‐19).
Comparison 14 PFMT and/or lifestyle plus surgery versus surgery, Outcome 9 Number with obstructive bladder symptoms at 12 months (UDI‐19).
| Study | median change from baseline intervention | 95% CI | median change from baseline control | 95% CI | Heading 5 |
| Frawley 2010 | 0.0 | 0, 14 | 10.0 | 5, 19 | |
Comparison 14 PFMT and/or lifestyle plus surgery versus surgery, Outcome 10 IIQ‐7 at 12 months.
| Outcome or subgroup title | No. of studies | No. of participants | Statistical method | Effect size |
| 1 number with increased frequency of prolapse symptoms Show forest plot | 1 | 69 | Risk Ratio (M‐H, Fixed, 95% CI) | 0.37 [0.21, 0.65] |
| 2 number with increased bother of prolapse symptoms Show forest plot | 1 | 69 | Risk Ratio (M‐H, Fixed, 95% CI) | 0.56 [0.33, 0.97] |
| 3 number with pelvic heaviness Show forest plot | 1 | 47 | Risk Ratio (M‐H, Fixed, 95% CI) | 0.26 [0.11, 0.61] |
| 4 prolapse symptom score: mean change from baseline Show forest plot | 1 | 37 | Mean Difference (IV, Fixed, 95% CI) | ‐3.37 [‐6.23, ‐0.51] |
| 5 self‐report of no improvement in prolapse Show forest plot | 1 | 40 | Risk Ratio (M‐H, Fixed, 95% CI) | 0.48 [0.26, 0.91] |
| 6 prolapse QoL score Show forest plot | 2 | 87 | Std. Mean Difference (IV, Fixed, 95% CI) | ‐0.51 [‐0.94, ‐0.07] |
| 6.1 mean score for prolapse interference with everyday life | 1 | 40 | Std. Mean Difference (IV, Fixed, 95% CI) | ‐0.05 [‐0.67, 0.57] |
| 6.2 Ditrovie quality of life score | 1 | 47 | Std. Mean Difference (IV, Fixed, 95% CI) | ‐0.95 [‐1.57, ‐0.34] |
| 7 Satisfaction with treatment (visual analogue scale 0‐10) Show forest plot | 1 | 47 | Mean Difference (IV, Fixed, 95% CI) | ‐3.22 [‐3.79, ‐2.65] |
| 8 number with POP‐Q stage not improved Show forest plot | 2 | 128 | Risk Ratio (M‐H, Fixed, 95% CI) | 0.83 [0.71, 0.96] |
| 9 POP‐Q measurements Show forest plot | 1 | Mean Difference (IV, Fixed, 95% CI) | Totals not selected | |
| 9.1 mean post ‐ pre POP‐Q Ba measurement | 1 | Mean Difference (IV, Fixed, 95% CI) | 0.0 [0.0, 0.0] | |
| 9.2 mean post ‐ pre POP‐Q Aa measurement | 1 | Mean Difference (IV, Fixed, 95% CI) | 0.0 [0.0, 0.0] | |
| 10 mean pelvic floor muscle measures Show forest plot | 2 | Mean Difference (IV, Fixed, 95% CI) | Subtotals only | |
| 10.1 manometry strength improvement (cm H2O) | 1 | 109 | Mean Difference (IV, Fixed, 95% CI) | ‐12.00 [‐14.90, ‐9.10] |
| 10.2 manometry endurance improvement (cm H2O sec) | 1 | 109 | Mean Difference (IV, Fixed, 95% CI) | ‐99.0 [‐131.47, ‐66.53] |
| 10.3 other strength measure | 1 | 47 | Mean Difference (IV, Fixed, 95% CI) | 1.12 [0.66, 1.58] |
| 11 number with worse bladder symptoms Show forest plot | 1 | Risk Ratio (M‐H, Fixed, 95% CI) | Subtotals only | |
| 11.1 SUI: number with increased frequency | 1 | 66 | Risk Ratio (M‐H, Fixed, 95% CI) | 0.36 [0.20, 0.66] |
| 11.2 SUI: number with increased bother | 1 | 66 | Risk Ratio (M‐H, Fixed, 95% CI) | 0.44 [0.26, 0.74] |
| 11.3 UUI: number with increased frequency | 1 | 39 | Risk Ratio (M‐H, Fixed, 95% CI) | 0.61 [0.33, 1.12] |
| 11.4 UUI: number with increased bother | 1 | 39 | Risk Ratio (M‐H, Fixed, 95% CI) | 0.59 [0.35, 1.01] |
| 12 change in ICIQ UI‐SF Show forest plot | 1 | 39 | Mean Difference (IV, Fixed, 95% CI) | ‐1.79 [‐3.68, 0.10] |
| 13 mean bladder symptom score Show forest plot | 1 | 47 | Mean Difference (IV, Fixed, 95% CI) | ‐9.22 [‐10.68, ‐7.76] |
| 14 urodynamics: post void residual (mL) Show forest plot | 1 | 47 | Mean Difference (IV, Fixed, 95% CI) | ‐21.28 [‐32.75, ‐9.81] |
| 15 urodynamics: flow rate (mL/s) Show forest plot | 1 | 47 | Mean Difference (IV, Fixed, 95% CI) | ‐3.23 [‐5.16, ‐1.30] |
| 16 urodynamics: closure pressure (cm H2O) Show forest plot | 1 | 47 | Mean Difference (IV, Fixed, 95% CI) | ‐4.86 [‐12.06, 2.34] |
| 17 number with dysuria Show forest plot | 1 | 47 | Risk Ratio (M‐H, Fixed, 95% CI) | 0.31 [0.13, 0.74] |
| 18 number with stress incontinence Show forest plot | 1 | 47 | Risk Ratio (M‐H, Fixed, 95% CI) | 0.16 [0.04, 0.68] |
| 19 number with urgency Show forest plot | 1 | 47 | Risk Ratio (M‐H, Fixed, 95% CI) | 0.11 [0.01, 0.79] |
| 20 number with frequency Show forest plot | 1 | 47 | Risk Ratio (M‐H, Fixed, 95% CI) | 0.27 [0.10, 0.72] |
| 21 number with worse bowel symptoms Show forest plot | 1 | Risk Ratio (M‐H, Fixed, 95% CI) | Subtotals only | |
| 21.1 Emptying difficulty: number with increased frequency | 1 | 40 | Risk Ratio (M‐H, Fixed, 95% CI) | 0.67 [0.35, 1.26] |
| 21.2 Emptying difficulty: number with increased bother | 1 | 40 | Risk Ratio (M‐H, Fixed, 95% CI) | 0.94 [0.47, 1.90] |
| 21.3 Flatus leakage: number with increased frequency | 1 | 57 | Risk Ratio (M‐H, Fixed, 95% CI) | 0.60 [0.40, 0.91] |
| 21.4 Flatus leakage: number with increased bother | 1 | 57 | Risk Ratio (M‐H, Fixed, 95% CI) | 0.68 [0.46, 0.99] |
| 21.5 Loose FI: number with increased frequency | 1 | 34 | Risk Ratio (M‐H, Fixed, 95% CI) | 0.60 [0.39, 0.92] |
| 21.6 Loose FI: number with increased bother | 1 | 24 | Risk Ratio (M‐H, Fixed, 95% CI) | 0.38 [0.20, 0.76] |
| 21.7 Solid FI: number with increased frequency | 1 | 5 | Risk Ratio (M‐H, Fixed, 95% CI) | 2.25 [0.13, 38.09] |
| 21.8 Solid FI: number with increased bother | 1 | 5 | Risk Ratio (M‐H, Fixed, 95% CI) | 0.67 [0.08, 5.54] |
| Outcome or subgroup title | No. of studies | No. of participants | Statistical method | Effect size |
| 1 Change in manometry measures (cm H2O) Show forest plot | 1 | Mean Difference (IV, Fixed, 95% CI) | Subtotals only | |
| 1.1 vaginal resting pressure | 1 | 31 | Mean Difference (IV, Fixed, 95% CI) | ‐0.20 [‐3.67, 3.27] |
| 1.2 vaginal squeeze pressure: peak maximum | 1 | 41 | Mean Difference (IV, Fixed, 95% CI) | 2.9 [‐2.06, 7.86] |
| 1.3 vaginal squeeze pressure: area maximum | 1 | 41 | Mean Difference (IV, Fixed, 95% CI) | 8.2 [‐5.79, 22.19] |
| 2 Digital muscle test (modified Oxford) Show forest plot | 1 | 50 | Mean Difference (IV, Fixed, 95% CI) | 0.48 [0.12, 0.84] |
| 3 Change in UDI total score (12 months post‐op ‐ baseline) Show forest plot | 1 | 49 | Mean Difference (IV, Fixed, 95% CI) | ‐9.90 [‐24.46, 4.66] |
| 4 Change in UDI irritative score (12 months post‐op ‐ baseline) Show forest plot | 1 | 49 | Mean Difference (IV, Fixed, 95% CI) | ‐0.40 [‐5.53, 4.73] |
| 5 Change in UDI stress score (12 months post‐op ‐ baseline) Show forest plot | 1 | 49 | Mean Difference (IV, Fixed, 95% CI) | ‐5.5 [‐15.76, 4.76] |
| 6 Change in UDI obstructive score (12 months post‐op ‐ baseline) Show forest plot | 1 | 49 | Mean Difference (IV, Fixed, 95% CI) | ‐0.60 [‐4.07, 2.87] |
| 7 Number with irritative bladder symptoms at 12 months (UDI‐19) Show forest plot | 1 | 49 | Risk Ratio (M‐H, Fixed, 95% CI) | 1.36 [0.48, 3.86] |
| 8 Number with stress bladder symptoms at 12 months (UDI‐19) Show forest plot | 1 | 49 | Risk Ratio (M‐H, Fixed, 95% CI) | 1.13 [0.54, 2.36] |
| 9 Number with obstructive bladder symptoms at 12 months (UDI‐19) Show forest plot | 1 | 49 | Risk Ratio (M‐H, Fixed, 95% CI) | 5.63 [0.28, 111.43] |
| 10 IIQ‐7 at 12 months Show forest plot | Other data | No numeric data | ||