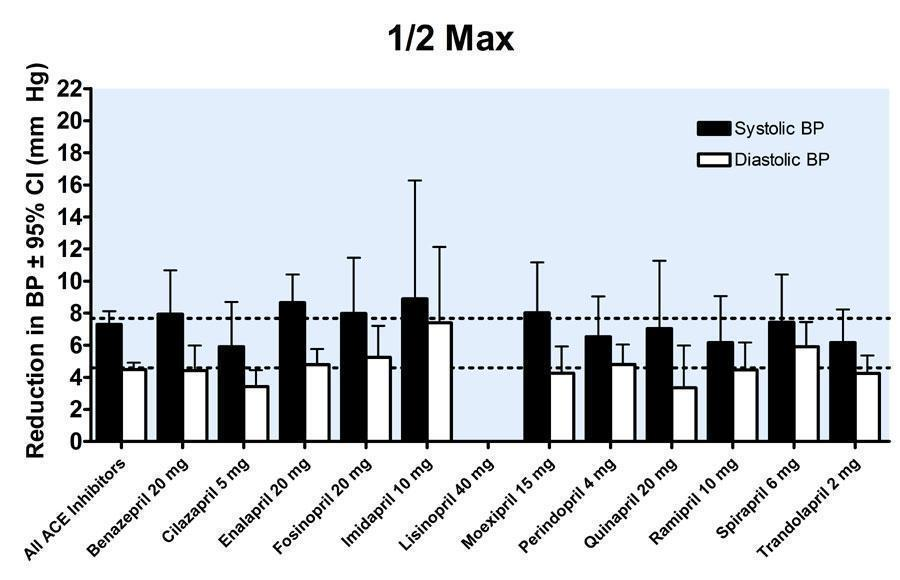
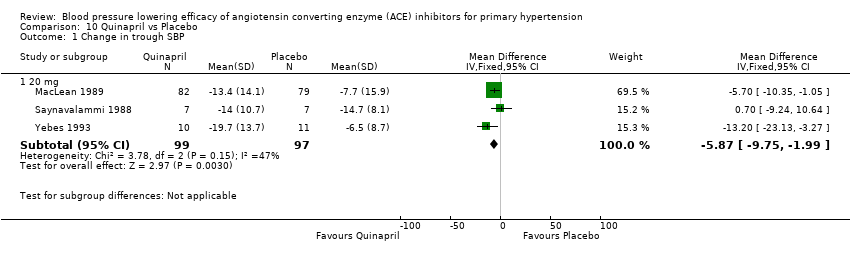
| 1 Change in trough SBP Show forest plot | 53 | 6113 | Mean Difference (IV, Fixed, 95% CI) | ‐7.85 [‐8.60, ‐7.09] |
|
| 1.1 Benazepril 20, 40, 80 mg | 6 | 598 | Mean Difference (IV, Fixed, 95% CI) | ‐8.54 [‐10.87, ‐6.21] |
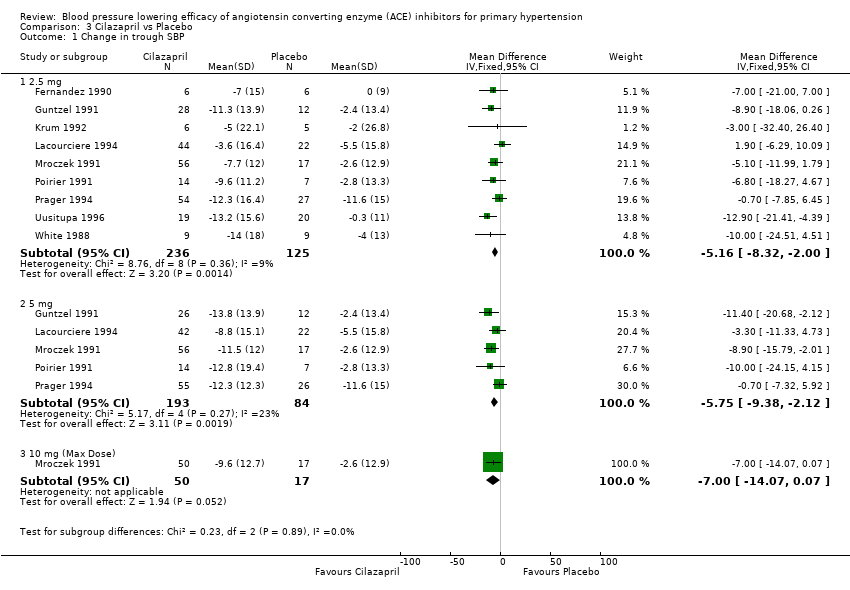
| 1.2 Cilazapril 5, 10 mg | 5 | 429 | Mean Difference (IV, Fixed, 95% CI) | ‐5.79 [‐8.46, ‐3.12] |
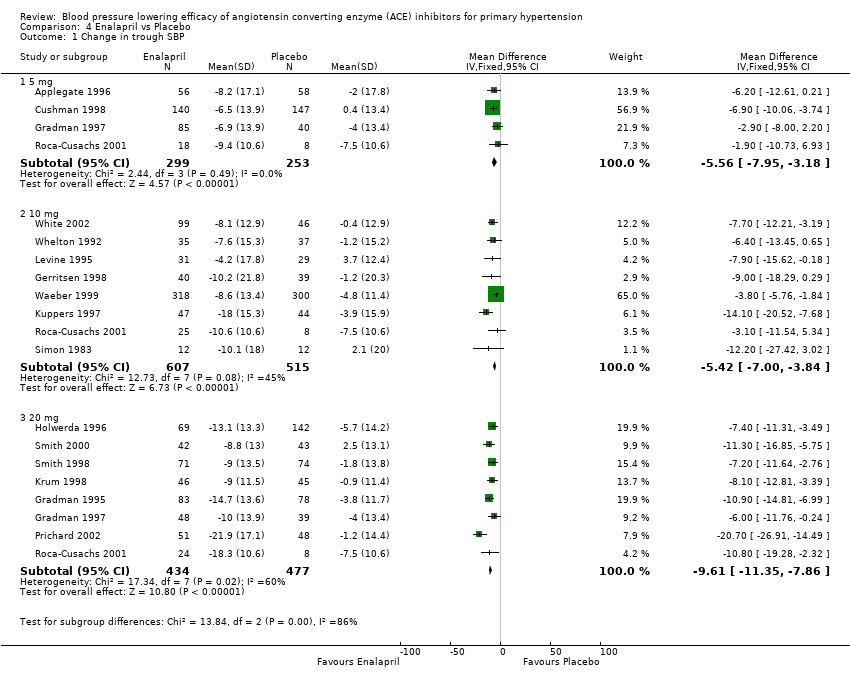
| 1.3 Enalapril 20, (40) mg | 8 | 967 | Mean Difference (IV, Fixed, 95% CI) | ‐9.54 [‐11.22, ‐7.86] |
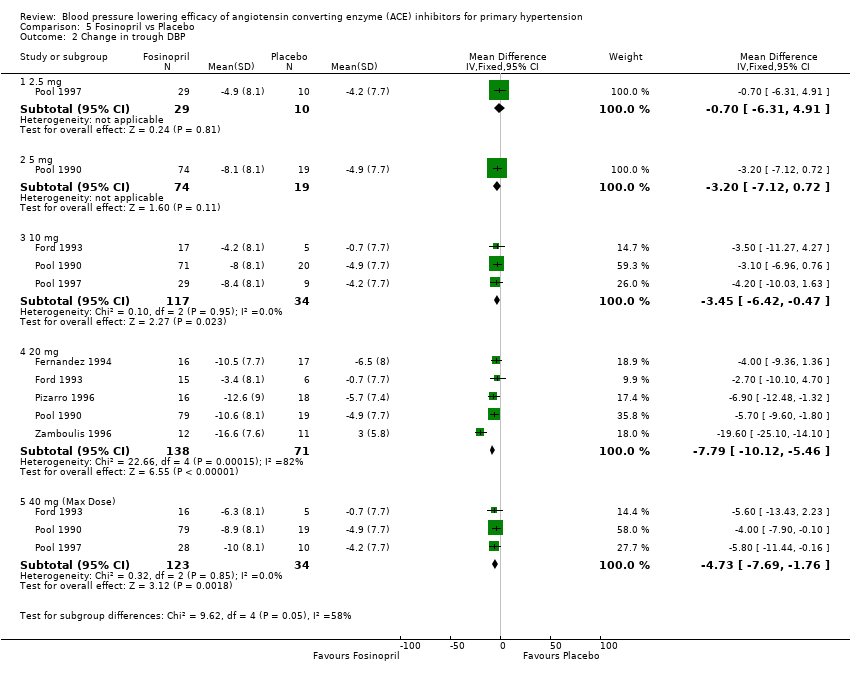
| 1.4 Fosinopril 20, 40 mg | 4 | 359 | Mean Difference (IV, Fixed, 95% CI) | ‐7.44 [‐10.44, ‐4.44] |
| 1.5 Imidapril 10, 20, 40 mg | 1 | 129 | Mean Difference (IV, Fixed, 95% CI) | ‐10.8 [‐16.60, ‐5.00] |
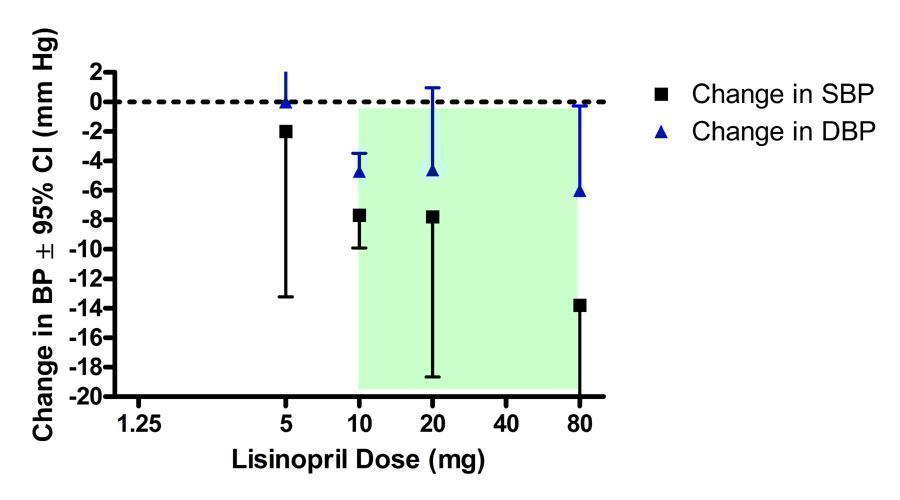
| 1.6 Lisinopril (40), 80 mg | 1 | 50 | Mean Difference (IV, Fixed, 95% CI) | ‐13.8 [‐24.46, ‐3.14] |
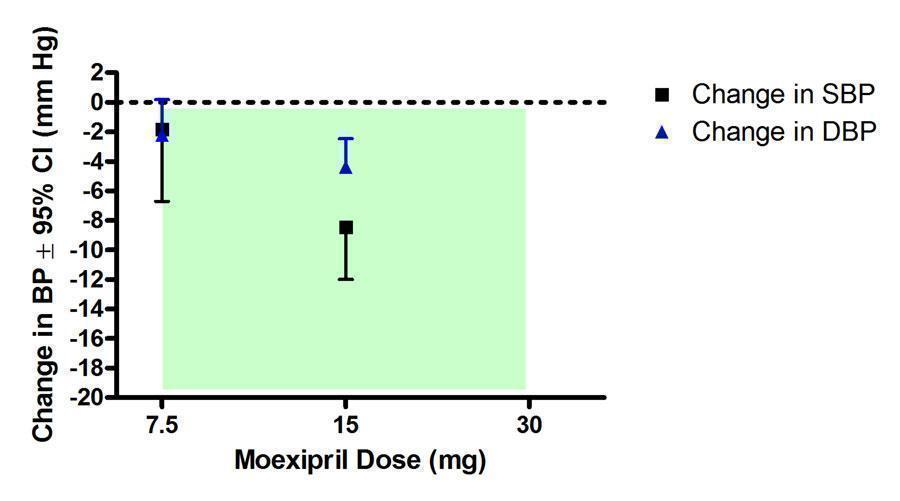
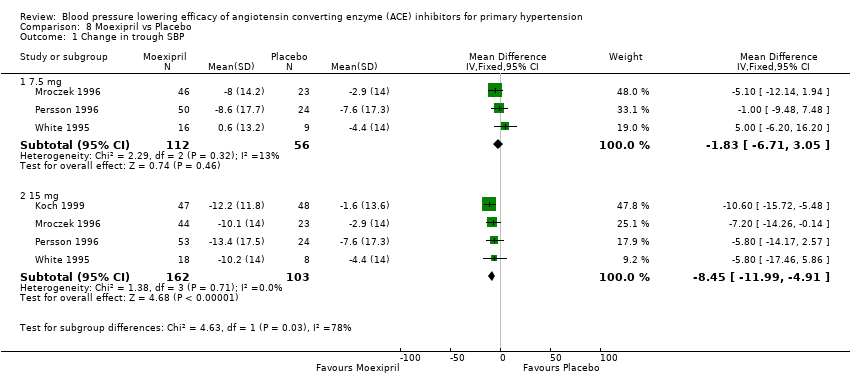
| 1.7 Moexipril 15, (30) mg | 4 | 321 | Mean Difference (IV, Fixed, 95% CI) | ‐8.02 [‐11.16, ‐4.88] |
| 1.8 Perindopril 4, 8, 16 mg | 6 | 985 | Mean Difference (IV, Fixed, 95% CI) | ‐7.12 [‐9.55, ‐4.70] |
| 1.9 Quinapril 20, (40) mg | 2 | 182 | Mean Difference (IV, Fixed, 95% CI) | ‐7.05 [‐11.26, ‐2.84] |
| 1.10 Ramipril 10, (20) mg | 4 | 257 | Mean Difference (IV, Fixed, 95% CI) | ‐5.74 [‐9.33, ‐2.16] |
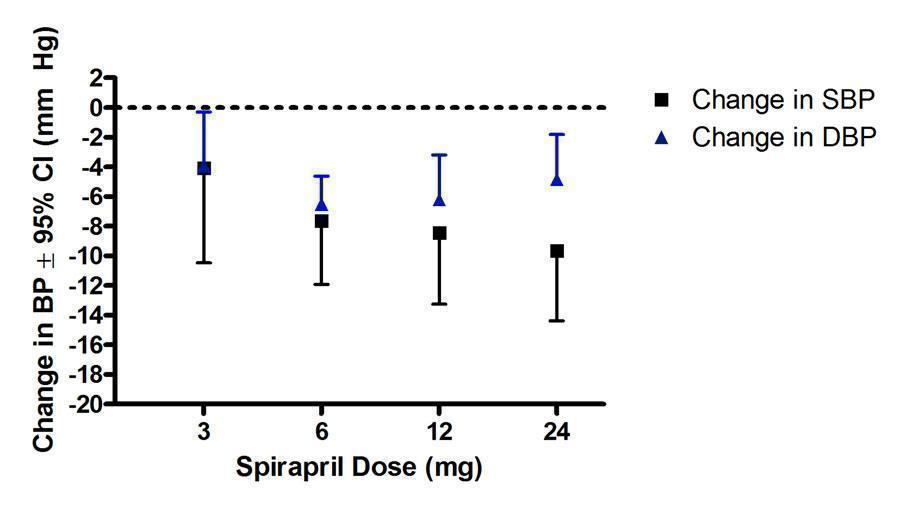
| 1.11 Spirapril 6, 12, 24 mg | 3 | 521 | Mean Difference (IV, Fixed, 95% CI) | ‐8.31 [‐10.80, ‐5.82] |
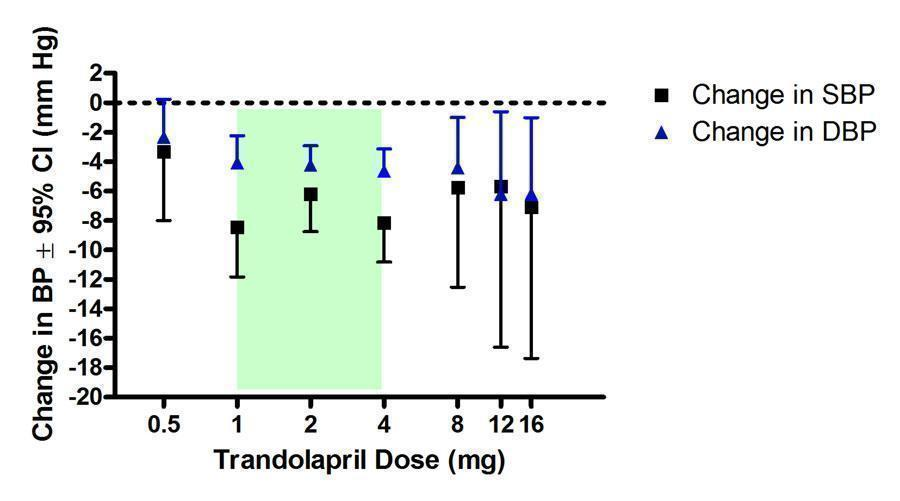
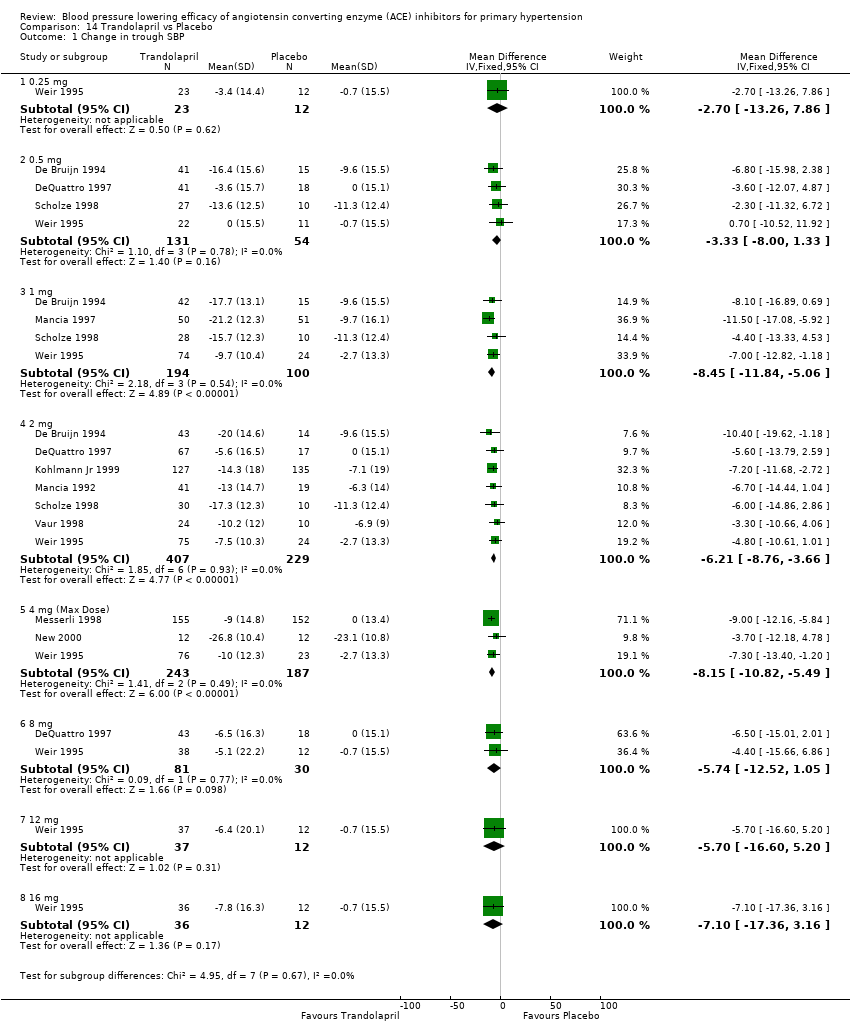
| 1.12 Trandolapril 2, 4, 8, 12, 16 mg | 9 | 1315 | Mean Difference (IV, Fixed, 95% CI) | ‐7.02 [‐8.70, ‐5.34] |
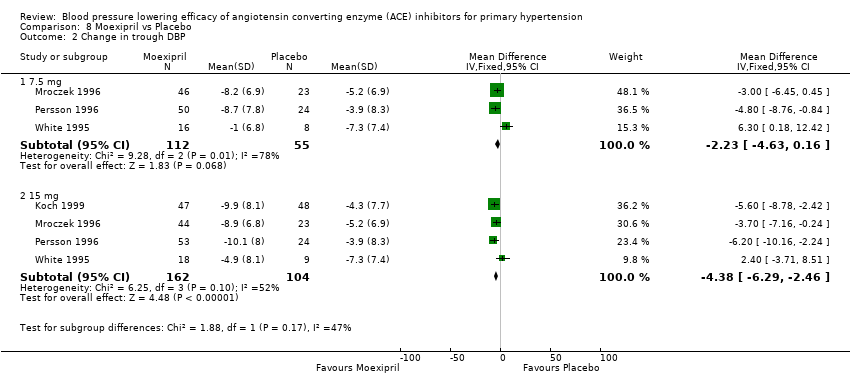
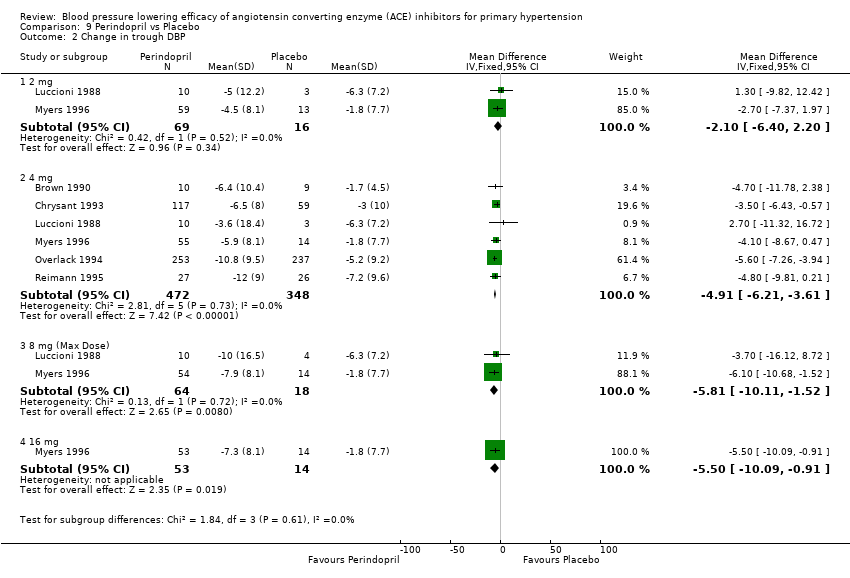
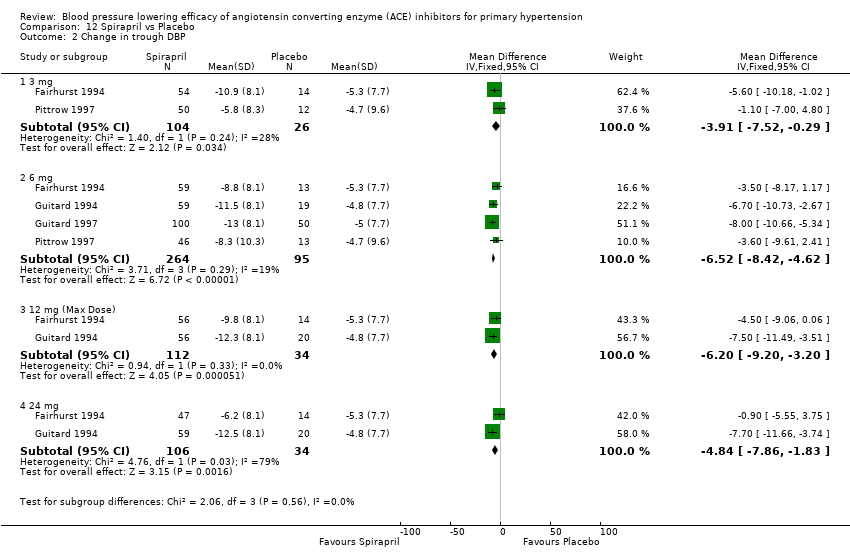
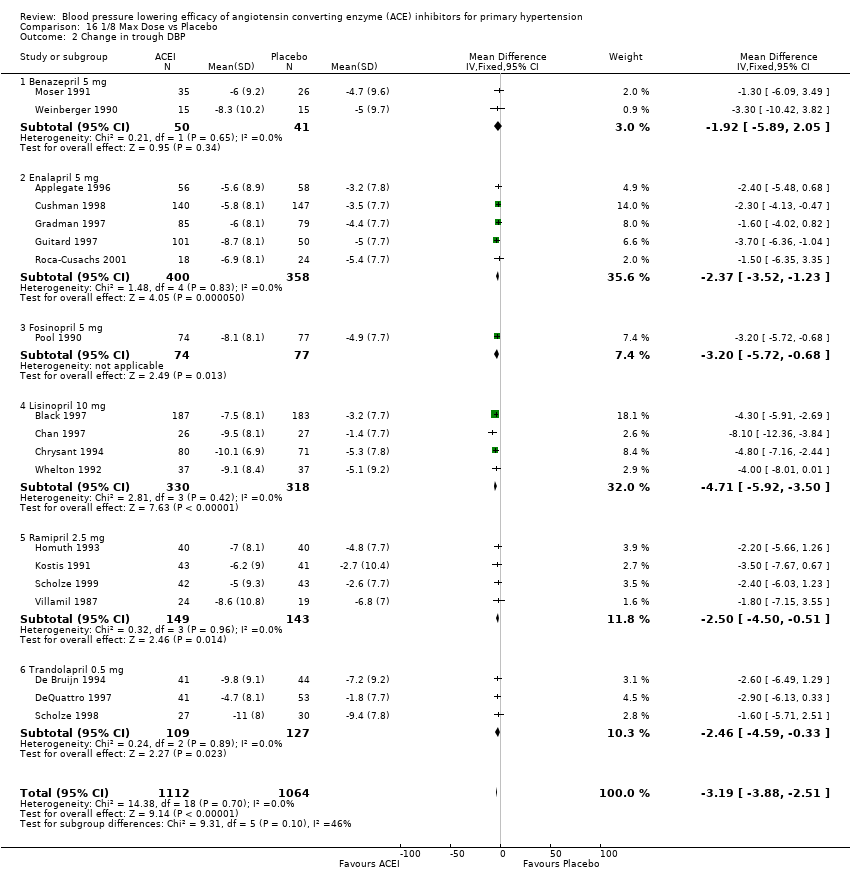
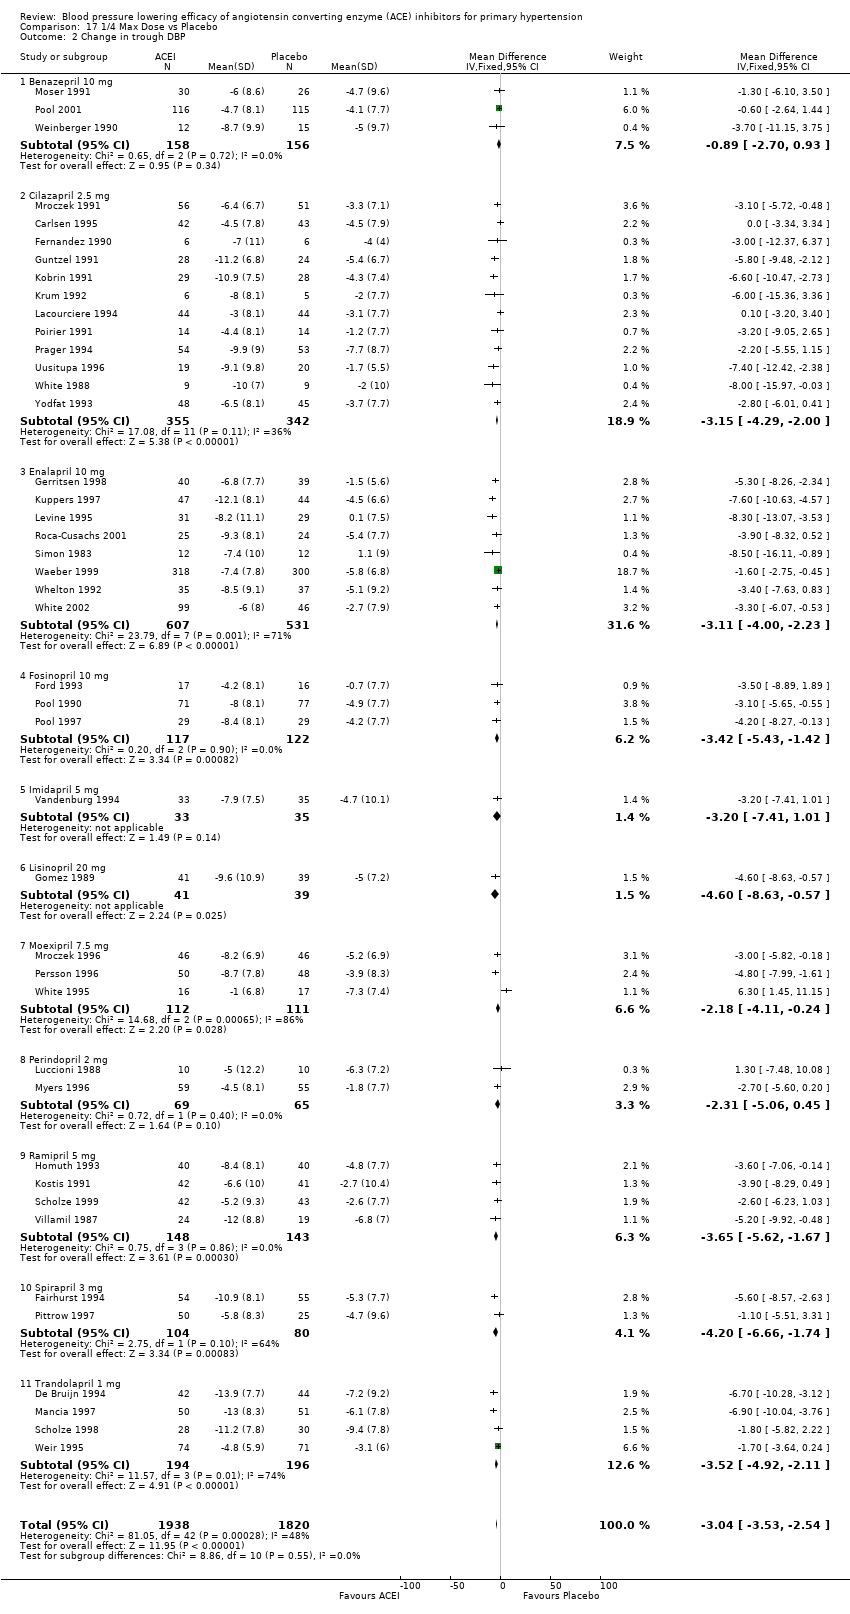
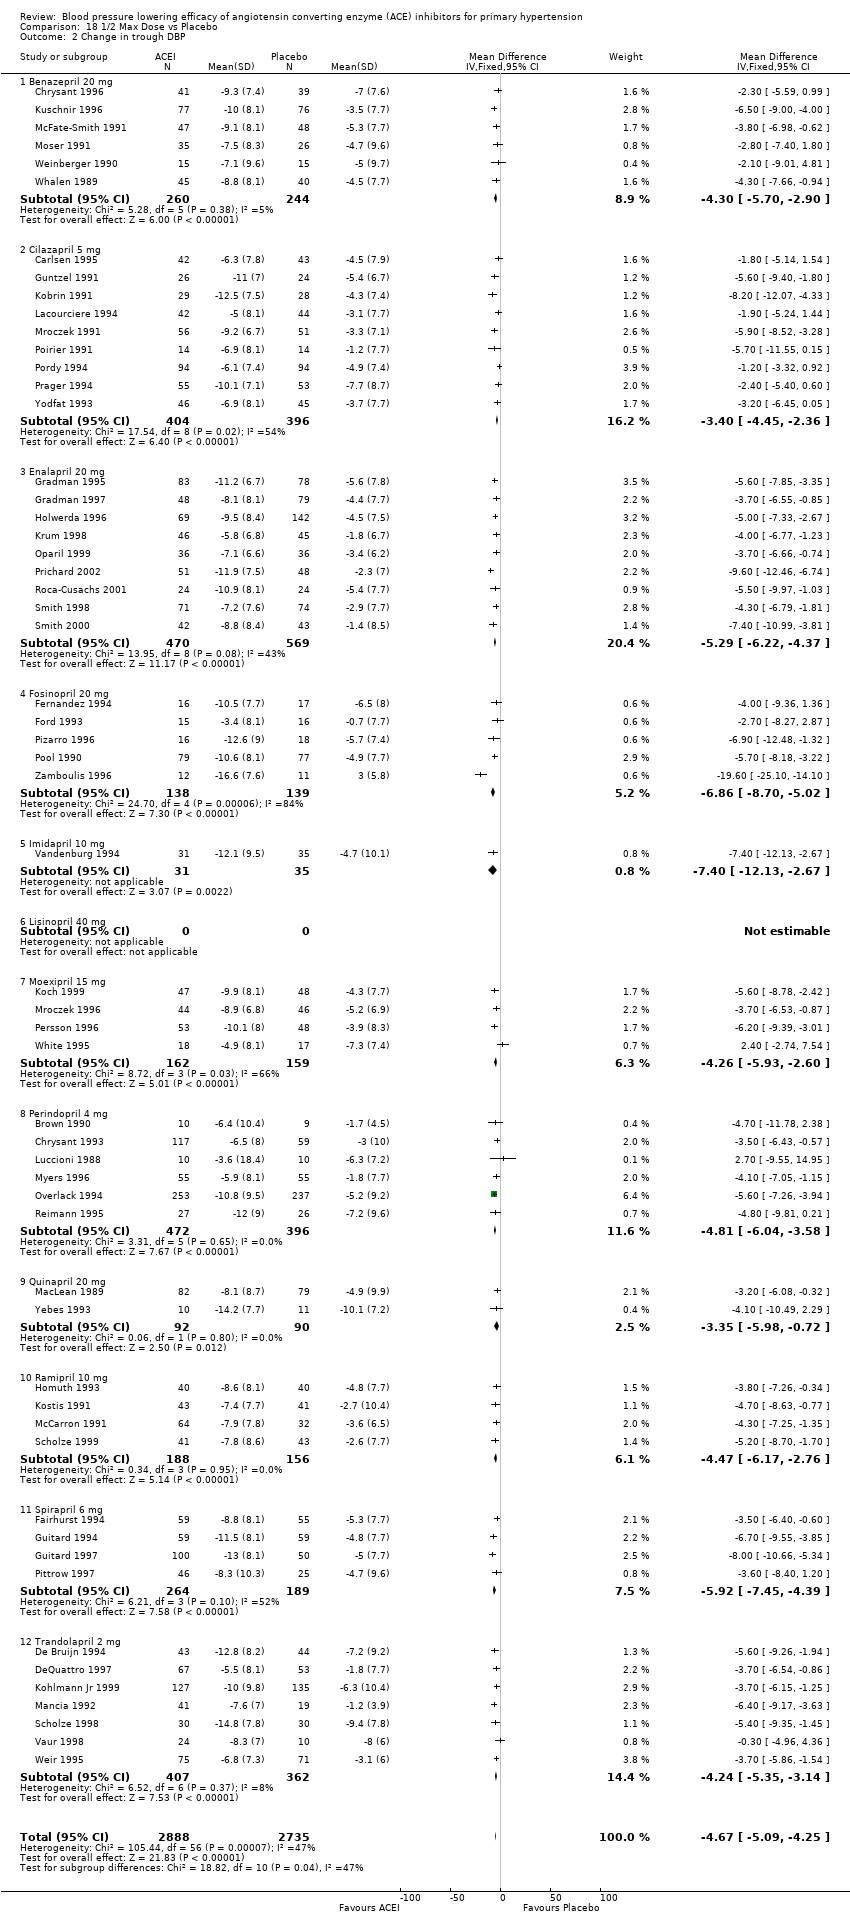
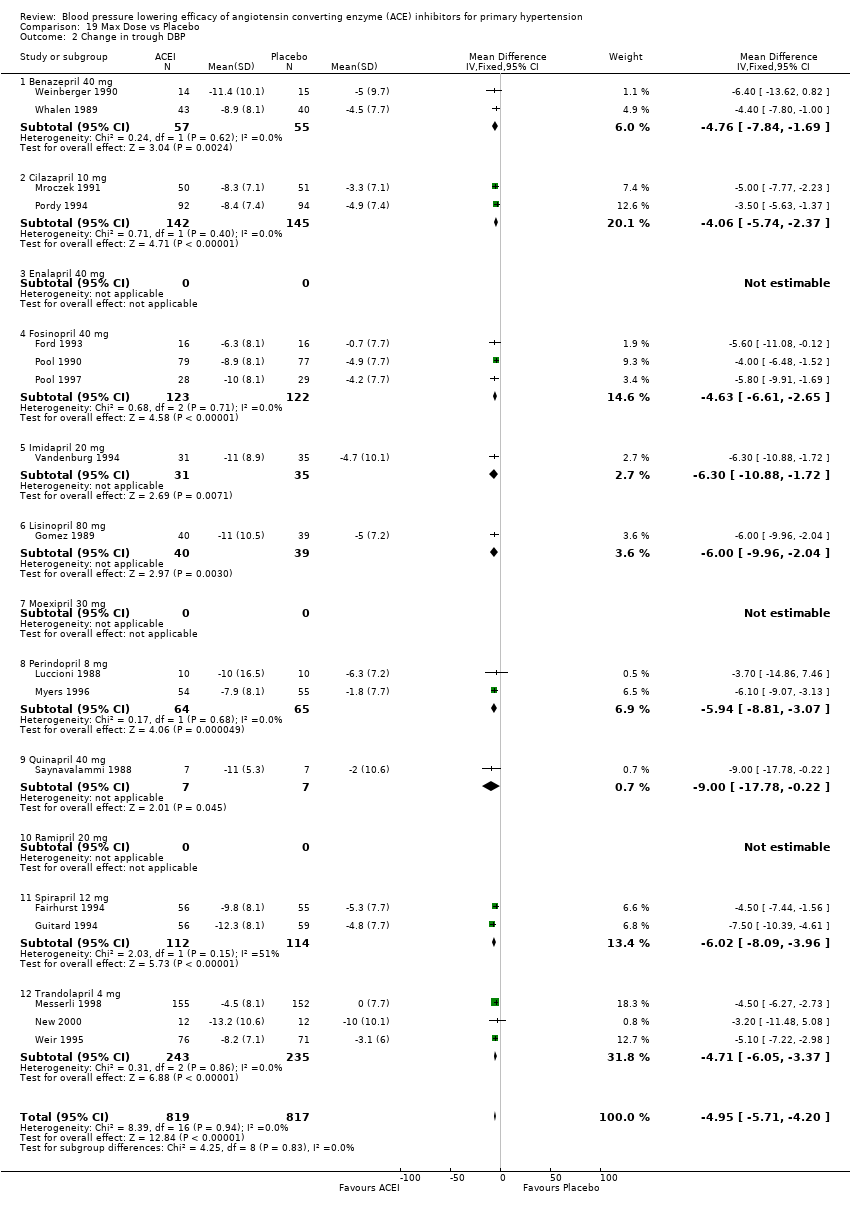
| 2 Change in trough DBP Show forest plot | 59 | 6861 | Mean Difference (IV, Fixed, 95% CI) | ‐4.73 [‐5.13, ‐4.34] |
|
| 2.1 Benazepril 20, 40, 80 mg | 6 | 598 | Mean Difference (IV, Fixed, 95% CI) | ‐4.56 [‐5.91, ‐3.22] |
| 2.2 Cilazapril 5, 10 mg | 9 | 942 | Mean Difference (IV, Fixed, 95% CI) | ‐3.58 [‐4.57, ‐2.60] |
| 2.3 Enalapril 20, (40) mg | 9 | 1039 | Mean Difference (IV, Fixed, 95% CI) | ‐5.29 [‐6.22, ‐4.37] |
| 2.4 Fosinopril 20, 40 mg | 4 | 359 | Mean Difference (IV, Fixed, 95% CI) | ‐5.15 [‐6.85, ‐3.45] |
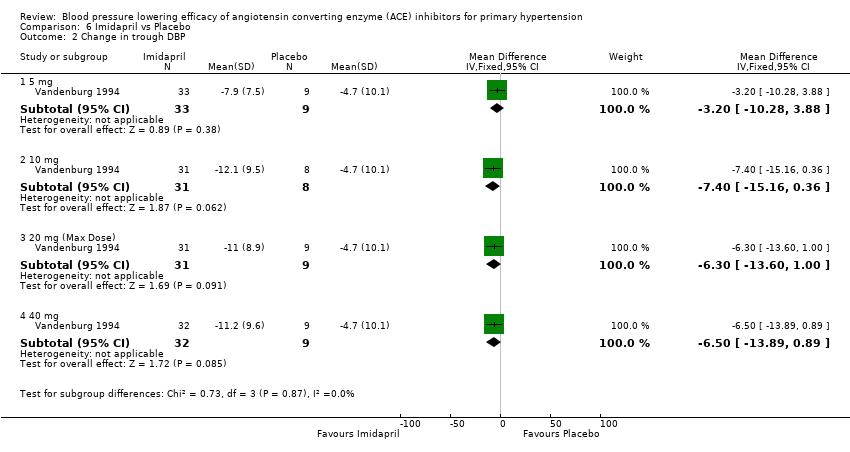
| 2.5 Imidapril 10, 20, 40 mg | 1 | 129 | Mean Difference (IV, Fixed, 95% CI) | ‐6.7 [‐10.54, ‐2.86] |
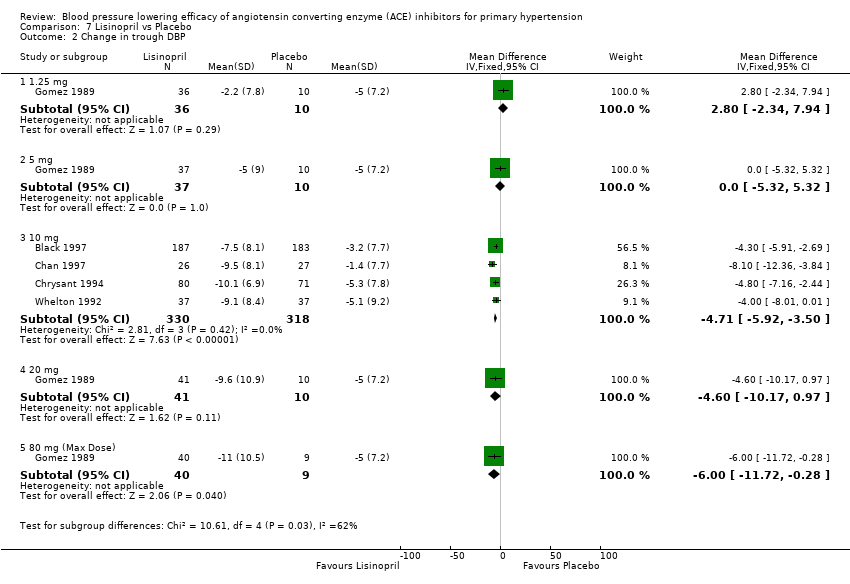
| 2.6 Lisinopril (40), 80 mg | 1 | 79 | Mean Difference (IV, Fixed, 95% CI) | ‐6.00 [‐9.96, ‐2.04] |
| 2.7 Moexipril 15, (30) mg | 4 | 321 | Mean Difference (IV, Fixed, 95% CI) | ‐4.26 [‐5.93, ‐2.60] |
| 2.8 Perindopril 4, 8, 16 mg | 6 | 985 | Mean Difference (IV, Fixed, 95% CI) | ‐5.01 [‐6.18, ‐3.84] |
| 2.9 Quinapril 20, (40) mg | 2 | 182 | Mean Difference (IV, Fixed, 95% CI) | ‐3.35 [‐5.98, ‐0.72] |
| 2.10 Ramipril 10, (20) mg | 4 | 257 | Mean Difference (IV, Fixed, 95% CI) | ‐4.42 [‐6.55, ‐2.29] |
| 2.11 Spirapril 6, 12, 24 mg | 4 | 671 | Mean Difference (IV, Fixed, 95% CI) | ‐5.84 [‐7.19, ‐4.49] |
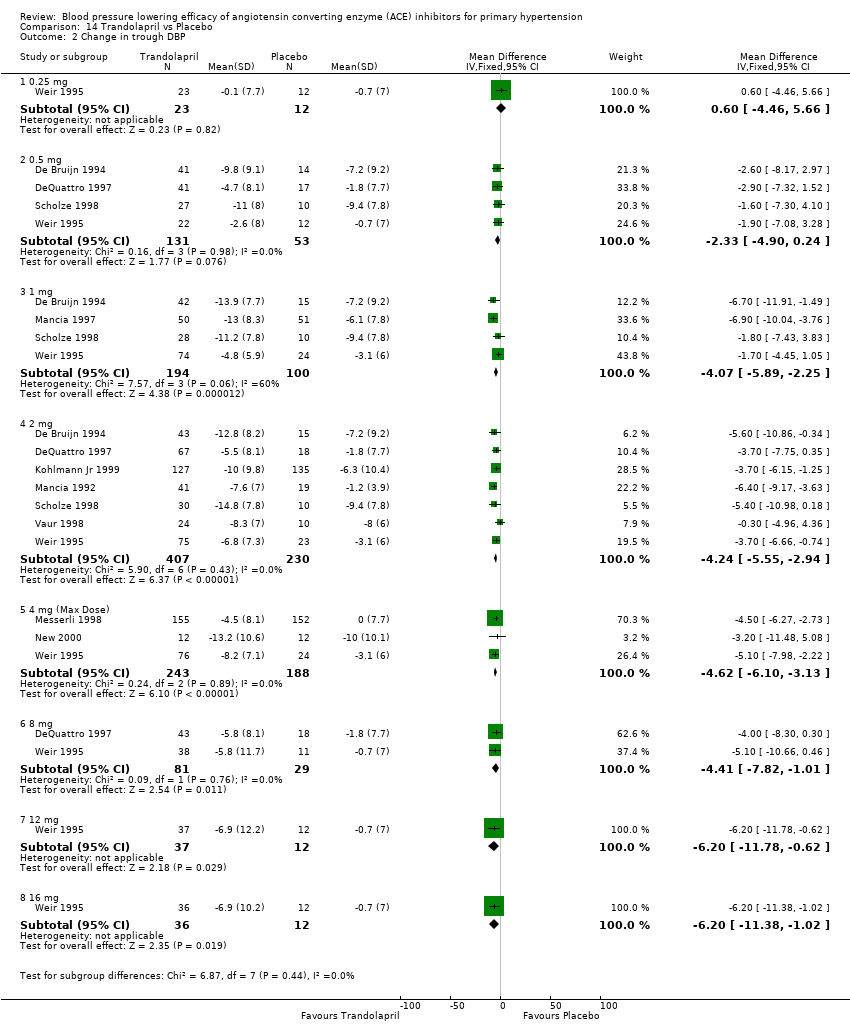
| 2.12 Trandolapril 2, 4, 8, 12, 16 mg | 9 | 1299 | Mean Difference (IV, Fixed, 95% CI) | ‐4.65 [‐5.55, ‐3.74] |


![Comparison 22 ACE Inhibitors vs Placebo, Outcome 1 Change in peak SBP [1/2 Max and Higher Doses Only].](/es/cdsr/doi/10.1002/14651858.CD003823.pub2/media/CDSR/CD003823/image_n/nCD003823-CMP-022-01.png)
![Comparison 22 ACE Inhibitors vs Placebo, Outcome 2 Change in peak DBP [1/2 Max and Higher Doses Only].](/es/cdsr/doi/10.1002/14651858.CD003823.pub2/media/CDSR/CD003823/image_n/nCD003823-CMP-022-02.png)
![Comparison 22 ACE Inhibitors vs Placebo, Outcome 3 Change in peak SBP [All Doses].](/es/cdsr/doi/10.1002/14651858.CD003823.pub2/media/CDSR/CD003823/image_n/nCD003823-CMP-022-03.png)
![Comparison 22 ACE Inhibitors vs Placebo, Outcome 4 Change in peak DBP [All Doses].](/es/cdsr/doi/10.1002/14651858.CD003823.pub2/media/CDSR/CD003823/image_n/nCD003823-CMP-022-04.png)