Eficacia de los inhibidores de la enzima convertidora de angiotensina (ECA) sobre la disminución de la presión arterial para la hipertensión primaria
Referencias
References to studies included in this review
References to studies excluded from this review
Additional references
Characteristics of studies
Characteristics of included studies [ordered by study ID]
Ir a:
| Methods | 7‐day washout period; 4‐week single‐blind placebo baseline phase; inclusion criteria= average sitting DBP 95‐115 mm Hg of week 2 and 4 of baseline phase recordings; 6‐week double‐blind treatment | |
| Participants | Enalapril 5 mg: n=56(38 males,18 females); mean age=52.5(11.2) years; baseline SBP=152.8(17.3) mm Hg, DBP=100.5(5.2) mm Hg, HR=77.4(9.2) bpm; | |
| Interventions | Enalapril 5 mg once daily; | |
| Outcomes | Adjusted mean change from baseline in SBP/DBP using mercury sphygmomanometer; | |
| Notes | Adjusted BP change reported, SD of change not reported, endpoint BP and SD reported; imputed endpoint SD for SD of change; used endpoint BP and SD data to calculate change in BP instead of entering adjusted BP change data; BP data from Table II, p. 53; Jadad score=4; funding source= Merck | |
| Risk of bias | ||
| Bias | Authors' judgement | Support for judgement |
| Allocation concealment? | Unclear risk | B ‐ Unclear |
| Methods | 4‐week placebo washout; inclusion criteria= DBP 95‐114 mm Hg; 4‐week double‐blind treatment | |
| Participants | Cilazapril 1.25 mg: n=8(4 males,4 females); mean age=47.8(7.1) years; baseline sitting SBP=154.1(10.6) mm Hg, DBP=103.6(6.7) mm Hg; | |
| Interventions | Cilazapril 1.25 mg once daily; | |
| Outcomes | Peak sitting SBP/DBP | |
| Notes | BP change and SD of change not reported, endpoint BP and SD reported; imputed endpoint SD for SD of change; BP data from Table 2, p. 526; lying and standing BP data also available; Jadad score=2; funding source= Hoffmann‐La Roche AG | |
| Risk of bias | ||
| Bias | Authors' judgement | Support for judgement |
| Allocation concealment? | Unclear risk | B ‐ Unclear |
| Methods | 2‐ to 4‐week placebo run‐in; inclusion criteria= sitting DBP 95‐115 mm Hg after run‐in; 12‐week total double‐blind treatment, 4‐week double‐blind treatment at initial fixed dose, non‐responders were up‐titrated after 4 weeks | |
| Participants | Lisinopril 10 mg: n=187(112 males,75 females); mean age=53.9(10.7) years; baseline sitting SBP=153.9(14.9) mm Hg, DBP=101.0(4.5) mm Hg; | |
| Interventions | Lisinopril 10 mg once daily; | |
| Outcomes | Least mean square change from baseline in trough sitting SBP/DBP using mercury sphygmomanometer | |
| Notes | Used week 4 BP data only; BP change reported, SD of change not reported, endpoint BP and SD not reported; imputed SBP SD of change from baseline SBP SD of change, imputed overall trial mean DBP SD of change; SBP data from Figure 1, p. 487, DBP data from text, p. 485; Jadad score=2; funding source= Ciba‐Geigy | |
| Risk of bias | ||
| Bias | Authors' judgement | Support for judgement |
| Allocation concealment? | Unclear risk | B ‐ Unclear |
| Methods | Inclusion criteria= sitting DBP 90‐105 mm Hg before start of study; 3‐week double‐blind treatment | |
| Participants | Cilazapril 2.5 mg: n=14(11 males,3 females); mean age=63.7(4.2) years; baseline SBP=139 mm Hg, DBP=92 mm Hg; | |
| Interventions | Cilazapril 2.5 mg once daily; | |
| Outcomes | Peak (2‐3 h after dosing) supine SBP/DBP using mercury sphygmomanometer; | |
| Notes | Used DBP only since patients did not have SBP >/= 140 mm Hg at baseline; BP change and SD of change not reported, endpoint BP and SD reported; imputed endpoint SD for SD of change; BP data from text, p. 446; Jadad score=3; funding source= Hoffman‐La Roche Ltd. | |
| Risk of bias | ||
| Bias | Authors' judgement | Support for judgement |
| Allocation concealment? | Unclear risk | B ‐ Unclear |
| Methods | 2‐week single‐blind placebo run‐in; inclusion criteria= supine DBP 95‐115 mm Hg after run‐in; 4‐week double‐blind treatment | |
| Participants | All patients: n=40(19 males,21 females); mean age=58 years; baseline upright SBP=154(15) mm Hg, DBP=102(7) mm Hg | |
| Interventions | Perindopril 4 mg once daily; | |
| Outcomes | Mean change from baseline in trough erect SBP/DBP using mercury sphygmomanometer; | |
| Notes | BP change and SEM of change reported, endpoint BP and SD not reported; calculated SD of change from N and SEM of change; BP data from Table 2, p. 329; Jadad score=4; funding source= Servier | |
| Risk of bias | ||
| Bias | Authors' judgement | Support for judgement |
| Allocation concealment? | Unclear risk | B ‐ Unclear |
| Methods | 4‐week single‐blind placebo run‐in; inclusion criteria= mean pre‐dose sitting DBP 100‐115 mm Hg after 3 and 4 weeks of run‐in, mean baseline DBP >/= 100 mm Hg at hourly measurements 21‐24 h post‐placebo and also during whole BP profile (i.e. hourly measurements 1‐8 h and 21‐24 h post‐dose); 8‐week double‐blind treatment | |
| Participants | Cilazapril 1 mg: n=42(26 males,16 females); mean age=53 years; baseline sitting BP not reported; | |
| Interventions | Cilazapril 1 mg once daily; | |
| Outcomes | Mean change from baseline in trough sitting DBP using mercury sphygmomanometer | |
| Notes | SBP change not reported; DBP change and SE of change reported, endpoint DBP and SD not reported; calculated DBP SD of change from N and SE of change; BP data from text, p. 224; Jadad score=2; funding source= Roche Ltd. | |
| Risk of bias | ||
| Bias | Authors' judgement | Support for judgement |
| Allocation concealment? | Unclear risk | B ‐ Unclear |
| Methods | 4‐week single‐blind placebo run‐in; inclusion criteria= sitting DBP 95‐114 mm Hg at last 2 visits of run‐in; 12‐week double‐blind treatment | |
| Participants | Lisinopril 10 mg: n=26(18 males,8 females); mean age=70.5 years; baseline sitting SBP=163.8(13.0) mm Hg, DBP=104.9(5.0) mm Hg, HR=62.5 bpm; | |
| Interventions | Lisinopril 10 mg once daily; | |
| Outcomes | Mean change from baseline in trough sitting SBP/DBP using mercury sphygmomanometer; | |
| Notes | BP change and SD of change reported, endpoint BP and SD reported; SD of change values are too low; imputed endpoint SBP SD for SBP SD of change; imputed overall trial mean DBP SD of change; SBP data from Table 2, p. 745; DBP data from Table 3, p. 746; Jadad score=3; funding source= not reported | |
| Risk of bias | ||
| Bias | Authors' judgement | Support for judgement |
| Allocation concealment? | Unclear risk | B ‐ Unclear |
| Methods | 4‐week single‐blind placebo run‐in; inclusion criteria= supine DBP 95‐114 mm Hg after run‐in; 16‐week double‐blind treatment, forced‐titration of dose by 4 mg every 4 weeks to maximum 16 mg daily | |
| Participants | Perindopril 4‐16 mg once daily: n=117(65 males,52 females); mean age=55(10) years; baseline upright SBP=154(15) mm Hg, DBP=102(7) mm Hg; baseline supine SBP=157(16) mm Hg, DBP=100(5) mm Hg; | |
| Interventions | Perindopril 4 mg once daily (wk 0‐4), perindopril 8 mg once daily (wk 4‐8), Perindopril 12 mg once daily (wk 8‐12), perindopril 16 mg once daily (wk 12‐16); | |
| Outcomes | Once daily dosing: upright and supine SBP/DBP 24 ± 2 h after last dose; | |
| Notes | Used week 4 supine data only; BP change reported, SD of change not reported, endpoint BP and SD reported; imputed endpoint SD for SD of change; BP data from Figure 1, p. 481; BP measurement device not reported; Jadad score=3; funding source= RW Johnson Pharma | |
| Risk of bias | ||
| Bias | Authors' judgement | Support for judgement |
| Allocation concealment? | Unclear risk | B ‐ Unclear |
| Methods | 4‐week single‐blind placebo period; inclusion criteria= sitting DBP 100‐114 mm Hg after placebo period; 8‐week double‐blind treatment | |
| Participants | Lisinopril 10 mg: n=85; mean age=54 years; baseline sitting SBP=154 mm Hg, DBP=104 mm Hg, HR=77 bpm; baseline upright SBP=154 mm Hg, DBP=103 mm Hg, HR=78 bpm; | |
| Interventions | Lisinopril 10 mg once daily; | |
| Outcomes | Trough sitting SBP/DBP using mercury sphygmomanometer; | |
| Notes | BP change and SD of change not reported, endpoint BP reported and SEM reported; calculated endpoint SD from N and endpoint SEM; imputed endpoint SD for SD of change; BP data from Figure 1, p. 739; Jadad score=2; funding source= ICI Pharma | |
| Risk of bias | ||
| Bias | Authors' judgement | Support for judgement |
| Allocation concealment? | Unclear risk | B ‐ Unclear |
| Methods | 1‐week washout; 1‐ to 4‐week single‐blind placebo run‐in; inclusion criteria= sitting DBP 95‐114 mm Hg at 2 consecutive visits during run‐in, with a difference of 10 mm Hg or less between 2 visits; 6‐week double‐blind treatment | |
| Participants | Benazepril 20 mg: n=42(28 males,14 females); mean age=53.7 years; baseline sitting SBP=153 mm Hg, DBP=104 mm Hg; | |
| Interventions | Benazepril 20 mg once daily; | |
| Outcomes | Mean change from baseline in trough sitting SBP/DBP using mercury sphygmomanometer; | |
| Notes | BP change reported and SE of change reported, endpoint BP reported; endpoint SD not reported, SD of change calculated from N and SE of change; BP data from Fagan abstract; SD of change data from Figure 1, p. 8; Jadad score=4; funding source= Ciba Pharma | |
| Risk of bias | ||
| Bias | Authors' judgement | Support for judgement |
| Allocation concealment? | Unclear risk | B ‐ Unclear |
| Methods | 7‐day washout; 4‐week single‐blind placebo baseline; inclusion criteria= mean sitting DBP 95‐115 mm Hg of week 2 and week 4 baseline recordings with difference in these means </= 7 mm Hg, mean sitting SBP had to be < 210 mm Hg at each baseline visit; 12‐week double‐blind treatment | |
| Participants | Enalapril 5 mg: n=144(94 males,50 females); mean age=56.1(10.0) years; baseline sitting SBP=155.2 mm Hg, DBP=101.6(5.5) mm Hg; | |
| Interventions | Enalapril 5 mg once daily; | |
| Outcomes | Trough sitting SBP/DBP using mercury sphygmomanometer; | |
| Notes | BP change and SD of change not reported; endpoint BP reported; endpoint SD not reported; imputed overall trial mean SD of change for SBP and DBP; BP data from Table 2, p. 26; Jadad score=4; funding source= Merck | |
| Risk of bias | ||
| Bias | Authors' judgement | Support for judgement |
| Allocation concealment? | Unclear risk | B ‐ Unclear |
| Methods | 4‐week placebo run‐in; inclusion criteria= supine and standing DBP 95‐115 mm Hg after run‐in; 4‐week double‐blind treatment | |
| Participants | Trandolapril 0.5 mg: n=41(17 males,24 females); mean age=49(13) years; baseline SBP=163.8(12.8) mm Hg, DBP=99.5(5.8) mm Hg; | |
| Interventions | Trandolapril 0.5 mg once daily; | |
| Outcomes | Trough supine SBP/DBP using mercury sphygmomanometer; | |
| Notes | BP change and SD of change reported, endpoint BP and SD not reported; BP data from Figures 1 and 2, pp. S61‐S62; Jadad score=3; funding source= Roussel Pharma | |
| Risk of bias | ||
| Bias | Authors' judgement | Support for judgement |
| Allocation concealment? | Unclear risk | B ‐ Unclear |
| Methods | 4‐week placebo run‐in; inclusion criteria= sitting DBP 95‐114 mm Hg during final 2 wks of run‐in; 6‐week double‐blind treatment | |
| Participants | Trandolapril 0.5 mg: n=41; baseline SBP=155.4(15.7) mm Hg, DBP=100.3(4.4) mm Hg; | |
| Interventions | Trandolapril 0.5 mg once daily; | |
| Outcomes | Mean change from baseline in trough supine SBP/DBP using mercury sphygmomanometer; | |
| Notes | Supine baseline BP reported in duplicate publication for each treatment arm; BP change reported, SD of change not reported, endpoint BP and SD not reported; imputed baseline SBP SD for SBP SD of change; imputed overall trial mean DBP SD of change; data from Table II, p. 367; duplicate publications=Levine 97, DeQuattro 97(NEJM); Jadad score=3; funding source= Knoll Pharma Change in sitting SBP data is not the same as data reported in Levine 1997. Reviewers have decided to use data from DeQuattro 1997 (primary reference) because unadjusted endpoint data is provided. At this time, DBP data that is only available in Levine 1997 will not be used unless an explanation for the discrepancy in BP data is adequately explained by authors. | |
| Risk of bias | ||
| Bias | Authors' judgement | Support for judgement |
| Allocation concealment? | Unclear risk | B ‐ Unclear |
| Methods | 4‐ to 6‐week placebo run‐in; inclusion criteria= supine DBP 95‐115 mm Hg on 2 consecutive visits after beginning of placebo run‐in; 8‐week double‐blind treatment | |
| Participants | Captopril 25 mg twice daily: n=77(60 males,17 females); mean age=52 years; baseline supine SBP=156 mm Hg, DBP=101 mm Hg; | |
| Interventions | Captopril 25 mg twice daily; | |
| Outcomes | Percent change from baseline in trough supine SBP/DBP using mercury sphygmomanometer; | |
| Notes | BP change reported, SD of change not reported, endpoint BP and SD not reported; baseline SD not reported; imputed overall trial mean SD of change for SBP and DBP; percent change in SBP data from text, p. III‐110; percent change in DBP data from Figure 1, p. III‐110; percent change in BP has been converted to absolute BP change data; Jadad score=3; funding source= not reported | |
| Risk of bias | ||
| Bias | Authors' judgement | Support for judgement |
| Allocation concealment? | Unclear risk | B ‐ Unclear |
| Methods | Inclusion criteria= SBP 160‐210 mm Hg and DBP 95‐115 mm Hg based on 3 separate measurements over a period of several days; approximately 8‐week (60 days) double‐blind treatment | |
| Participants | All patients: n=13(4 males,9 females); | |
| Interventions | Captopril 75 mg daily (50 mg in the morning, 25 mg at bedtime); | |
| Outcomes | Upright SBP/DBP using Dynamap automated oscillometric device; | |
| Notes | BP change and SD of change not reported; endpoint BP and SD reported; imputed endpoint SD for SD of change; BP data from Table III, p. 150; lying BP data also available; Jadad score=3; funding source= not reported | |
| Risk of bias | ||
| Bias | Authors' judgement | Support for judgement |
| Allocation concealment? | Unclear risk | B ‐ Unclear |
| Methods | 3‐ to 4‐week single‐blind placebo run‐in; inclusion criteria= sitting DBP 100‐115 mm Hg, as determined by mean of 3 consecutive BP measurements using either mercury or random‐zero sphygmomanometer; 6‐week double‐blind treatment | |
| Participants | All patients: n=283(157 males,126 females); mean age=55 years; | |
| Interventions | Spirapril 3 mg once daily; | |
| Outcomes | Mean change from baseline in trough sitting SBP/DBP using mercury sphygmomanometer; | |
| Notes | BP change reported, SD of change not reported; endpoint BP and SD of change not reported; imputed overall trial mean SBP/DBP SD of change; BP data from Figure 1, p. 78; baseline BP for all patients is not reported; Jadad score=3; funding source= Sandoz Pharma | |
| Risk of bias | ||
| Bias | Authors' judgement | Support for judgement |
| Allocation concealment? | Unclear risk | B ‐ Unclear |
| Methods | 4‐week single‐blind placebo run‐in; inclusion criteria= sitting DBP 94‐114 mm Hg on 2 consecutive visits (one week apart) of run‐in; 4‐week double‐blind treatment | |
| Participants | Cilazapril 1.25 mg: n=6(5 males,1 female); age=41(5) years; baseline sitting SBP=133(7) mm Hg, DBP=97(3) mm Hg, HR=77(5) bpm; | |
| Interventions | Cilazapril 1.25 mg once daily; | |
| Outcomes | Trough supine SBP/DBP using mercury sphygmomanometer; | |
| Notes | Only cilazapril 2.5 mg and placebo groups have BP >/= 140/90 mm Hg after placebo run‐in; used supine BP for cilazapril 2.5 mg and placebo groups only; BP change reported and SD of change not reported, endpoint BP and SD reported; imputed endpoint SD for SD of change; data from Table 4, p. 55; Jadad score=3; funding source= Hoffman‐La Roche | |
| Risk of bias | ||
| Bias | Authors' judgement | Support for judgement |
| Allocation concealment? | Unclear risk | B ‐ Unclear |
| Methods | 4‐ to 5‐week single‐blind placebo run‐in; inclusion criteria= mean sitting DBP 95‐110 mm Hg at 2 consecutive visits 1 week apart; 8‐week double‐blind treatment | |
| Participants | Fosinopril 20 mg: n=16(7 males,9 females); mean age=48.8(11.6) years; baseline sitting SBP=149.7(12.0) mm Hg, DBP=101.9(4.4) mm Hg, HR=72.9 bpm; | |
| Interventions | Fosinopril 20 mg once daily; | |
| Outcomes | Mean change from baseline in trough sitting SBP/DBP using mercury sphygmomanometer; | |
| Notes | BP change and SD of change reported; endpoint BP and SD not reported; BP data from Table 2, p. I‐209; Jadad score=3; funding source= Bristol‐Myers Squibb | |
| Risk of bias | ||
| Bias | Authors' judgement | Support for judgement |
| Allocation concealment? | Unclear risk | B ‐ Unclear |
| Methods | 4‐week single‐blind placebo run‐in; inclusion criteria= mean supine DBP 95‐115 mm Hg at 2 separate visits following discontinuation or tapering of antihypertensive medication (all patients had received antihypertensive therapy that was discontinued during the first 2 weeks of placebo run‐in); 4‐week double‐blind treatment; 1‐week single‐blind placebo washout period | |
| Participants | Fosinopril 10 mg: n=17(4 males,13 females); mean age=49(9.1) years; baseline supine SBP=163.8 mm Hg, DBP=102.2 mm Hg; baseline HR=77.4 bpm; | |
| Interventions | Fosinopril 10 mg once daily, | |
| Outcomes | Trough supine SBP/DBP using mercury sphygmomanometer; | |
| Notes | BP change and SD of change not reported, endpoint BP reported, endpoint SD not reported; imputed overall trial mean SBP and DBP SD of change; BP data from Table II, p. 327; trough and peak BP data also available in Figures 1 and 2, p.327; 2 sets of baseline BP are reported; Jadad score=3; funding source= Bristol‐Myers Squibb | |
| Risk of bias | ||
| Bias | Authors' judgement | Support for judgement |
| Allocation concealment? | Unclear risk | B ‐ Unclear |
| Methods | 3‐week washout period; 4‐week placebo run‐in; inclusion criteria= sitting DBP 90‐115 mm Hg and SBP </= 200 mm Hg during run‐in; 8‐week double‐blind treatment, dosage of enalapril doubled after 4 weeks of treatment if DBP >/= 85 mm Hg | |
| Participants | Enalapril 10 mg: n=40(28 males,12 females); mean age=58.8(9.5) years; baseline SBP=165(15) mm Hg, DBP=92(7.8) mm Hg, HR=81.2(13.3) bpm; | |
| Interventions | Enalapril 10 mg once daily; | |
| Outcomes | Trough sitting SBP/DBP using automated device (Dinamap); | |
| Notes | Used week 4 BP data only; BP change and SD of change not reported; endpoint BP and SD reported; imputed endpoint SD for SD of change; position of BP measurement not reported but likely sitting; BP data from Figure 1, p. 693; Jadad score=4; funding source= Bayer | |
| Risk of bias | ||
| Bias | Authors' judgement | Support for judgement |
| Allocation concealment? | Unclear risk | B ‐ Unclear |
| Methods | 4‐week single‐blind placebo washout; inclusion criteria= supine DBP 95‐115 mm Hg after washout; 6‐week double‐blind treatment | |
| Participants | Lisinopril 1.25 mg: n=41(38 males,3 females); mean age=58 years; baseline BP not reported for all randomized patients; | |
| Interventions | Lisinopril 1.25 mg once daily; | |
| Outcomes | Trough erect SBP/DBP using mercury sphygmomanometer; | |
| Notes | BP change and 95% CI reported, endpoint BP reported, endpoint SD not reported; calculated SD of change from 95% CI; erect BP data from Table 3, p. 418; supine BP data from Table 2, p. 417; Jadad score=3; funding source= Merck Sharp & Dohme | |
| Risk of bias | ||
| Bias | Authors' judgement | Support for judgement |
| Allocation concealment? | Unclear risk | B ‐ Unclear |
| Methods | 7‐day washout period; total 4‐week single‐blind placebo run‐in, patients' supine DBP >/= 95 mm Hg after initial 2‐week single‐blind placebo phase; additional 2‐week single‐blind placebo phase; inclusion criteria= mean supine DBP 100‐115 mm Hg, and two BP readings during weeks 2 and 4 of single‐blind placebo phase could not differ by > 7 mm Hg; 8‐week double‐blind treatment | |
| Participants | Enalapril 20 mg: n=83(56 males,27 females); median age=53 years; baseline SBP=155.4 mm Hg, DBP=103.1 mm Hg; | |
| Interventions | Enalapril 20 mg once daily; | |
| Outcomes | Mean change from baseline in trough supine SBP/DBP; | |
| Notes | BP change and SD of change reported, endpoint BP reported; endpoint SD not reported, BP data from Table 2, p. 1348; BP measurement device not reported; Jadad score=3; funding source= Merck | |
| Risk of bias | ||
| Bias | Authors' judgement | Support for judgement |
| Allocation concealment? | Unclear risk | B ‐ Unclear |
| Methods | 4‐week single‐blind placebo baseline; inclusion criteria= sitting DBP 95‐115 mm Hg; 8‐week double‐blind treatment | |
| Participants | All patients: n=707(457 males,250 females); mean age=53.5(10.5) years; baseline sitting SBP=155.5(17.7) mm Hg, DBP=101.9(5.7) mm Hg; | |
| Interventions | Enalapril 5 mg once daily; | |
| Outcomes | Mean change from baseline in trough sitting SBP/DBP using mercury sphygmomanometer; | |
| Notes | BP change reported; SD of change not reported; endpoint BP and SD not reported; baseline SBP SD for all groups reported; imputed baseline SBP SD for SD of change; imputed systematic review overall mean SD of change for DBP; DBP data from Figure 1, p. 432; SBP data from Figure 2, p. 433; Jadad score=3; funding source= Astra Merck, Inc. | |
| Risk of bias | ||
| Bias | Authors' judgement | Support for judgement |
| Allocation concealment? | Unclear risk | B ‐ Unclear |
| Methods | 3‐ to 4‐week single‐blind placebo run‐in; inclusion criteria= sitting DBP 100‐119 mm Hg; 6‐week double‐blind treatment | |
| Participants | Spirapril 6 mg: n=66(32 males,34 females); mean age=58(11) years; baseline sitting SBP=171(12) mm Hg, DBP=106(4) mm Hg, HR=76(10) bpm; | |
| Interventions | Spirapril 6 mg once daily; | |
| Outcomes | Mean change from baseline in trough sitting SBP/DBP using mercury sphygmomanometer; | |
| Notes | BP change reported, SD of change reported but values are too low, endpoint SBP not reported, endpoint DBP reported, endpoint SD not reported; change in trough BP data from Table II, p. 83; SD of change data from Figure 2, p. 85; change in peak DBP data in subgroup of patients (from one study center) in Figure 3, p. 85; Table II provides data for both efficacy and intention‐to‐treat (ITT) analysis, ITT analysis BP data used instead of efficacy analysis BP data; imputed baseline SBP SD for SBP SD of change; imputed overall trial mean DBP SD of change; Jadad score=3; funding source= Sandoz Pharma | |
| Risk of bias | ||
| Bias | Authors' judgement | Support for judgement |
| Allocation concealment? | Unclear risk | B ‐ Unclear |
| Methods | 4‐week placebo washout; inclusion criteria= mean DBP >/= 100 mm Hg at end of washout period and mean DBP 100‐115 mm Hg 24 hours after capsule intake during placebo phase; 8‐week double‐blind treatment, titrated to response at 4 weeks | |
| Participants | Enalapril 5 mg: n=101(54 males,47 females); mean age=56.2(9.7) years; baseline SBP=163.2(16.4) mm Hg, DBP=99.5(6.1) mm Hg; | |
| Interventions | Enalapril 5 mg once daily; | |
| Outcomes | Adjusted mean change from baseline in trough sitting DBP; | |
| Notes | Used week 4 BP data only; BP change reported, SD of change not reported, endpoint BP reported, endpoint SD not reported; imputed overall trial mean DBP SD of change; DBP data from Table 5, p. 455; BP measurement device not reported; Jadad score=2; funding source= Novartis | |
| Risk of bias | ||
| Bias | Authors' judgement | Support for judgement |
| Allocation concealment? | Unclear risk | B ‐ Unclear |
| Methods | 4‐week single‐blind placebo run‐in; inclusion criteria= sitting DBP 100‐115 mm Hg at end of 3rd and 4th week of run‐in as well as during baseline BP profile (BP measured hourly during first 10 hours and last 4 hours after last placebo capsule); 8‐week double‐blind treatment | |
| Participants | Cilazapril 2.5 mg: n=29(17 males,12 females); mean age=56(7) years; baseline DBP=103.5 mm Hg; | |
| Interventions | Cilazapril 2.5 mg once daily; | |
| Outcomes | Trough sitting SBP/DBP using mercury sphygmomanometer; | |
| Notes | Endpoint (week 8) BP change and DBP SE of change reported, endpoint BP and SD reported; BP also reported at weeks 4,6,8; calculated DBP SD of change from N and SE of change; imputed overall trial mean SBP SD of change; BP data from Figure 1, p. 10; Jadad score=3; funding source= Hoffman‐La Roche Ltd. Duplication publication = Study 2 of Kobrin 1991. | |
| Risk of bias | ||
| Bias | Authors' judgement | Support for judgement |
| Allocation concealment? | Unclear risk | B ‐ Unclear |
| Methods | 1‐week washout; 2‐week placebo run‐in; inclusion criteria= sitting DBP 95‐115 mm Hg after run‐in; 8‐week double‐blind treatment | |
| Participants | Enalapril 20 mg: n=69(40 males,29 females); mean age=52.5(10.3) years; baseline sitting SBP=161.5(10.4) mm Hg, DBP=102.2(4.2) mm Hg; | |
| Interventions | Enalapril 20 mg once daily; | |
| Outcomes | Trough sitting SBP/DBP using mercury sphygmomanometer; | |
| Notes | BP change and SD of change not reported, endpoint BP and SD reported; imputed endpoint SD for SD of change; BP data from Table 3, p. 1150; Jadad score=3; funding source= Ciba‐Geigy | |
| Risk of bias | ||
| Bias | Authors' judgement | Support for judgement |
| Allocation concealment? | Unclear risk | B ‐ Unclear |
| Methods | 2‐week placebo run‐in; inclusion criteria= DBP 100‐115 mm Hg after run‐in; 6‐week double‐blind treatment | |
| Participants | Ramipril 2.5 mg: n=40(26 males,14 females); mean age=47(10) years; baseline SBP=159(15) mm Hg, DBP=107(5) mm Hg; | |
| Interventions | Ramipril 2.5 mg once daily; | |
| Outcomes | Mean change from baseline in trough sitting SBP/DBP using mercury sphygmomanometer; | |
| Notes | BP change reported, SD of change not reported, endpoint BP and SD not reported; imputed baseline SBP SD for SBP SD of change; imputed overall trial mean DBP SD of change; BP data from Figures 1 and 2, p. 669; Jadad score=3; funding source= Cassella AG | |
| Risk of bias | ||
| Bias | Authors' judgement | Support for judgement |
| Allocation concealment? | Unclear risk | B ‐ Unclear |
| Methods | 2‐week placebo run‐in; inclusion criteria= SBP 160‐200 mm Hg and DBP 95‐120 mm Hg at 2 consecutive measurements; 8‐week double‐blind treatment | |
| Participants | Captopril 50 mg: n=42(23 males,19 females); mean age=52.8(10.6) years; baseline supine SBP=175.5(8.9) mm Hg, DBP=104.5(4.4) mm Hg; | |
| Interventions | Captopril 50 mg once daily; | |
| Outcomes | Trough supine SBP/DBP using mercury sphygmomanometer; | |
| Notes | BP change and SD of change not reported, endpoint BP and SD reported; imputed endpoint SD for SD of change for SBP and DBP; SBP data from Figure 1, p. 91S; DBP data from Figure 2, p. 91S; Jadad score=3; funding source= not reported | |
| Risk of bias | ||
| Bias | Authors' judgement | Support for judgement |
| Allocation concealment? | Unclear risk | B ‐ Unclear |
| Methods | 4‐week single‐blind placebo run‐in; inclusion criteria= sitting DBP 100‐115 mm Hg at last 2 visits of run‐in; 4‐week double‐blind treatment | |
| Participants | Cilazapril 2.5 mg: n=29(18 males,11 females); mean age=50(9) years; | |
| Interventions | Cilazapril 2.5 mg once daily; | |
| Outcomes | Mean change from baseline in trough sitting DBP using mercury sphygmomanometer; | |
| Notes | SBP change not reported; DBP change and SE of change reported, endpoint BP and SD not reported; calculated DBP SD of change from N and SE of change; BP data from Table II, p. 34; Jadad score=3; funding source= Hoffman‐La Roche Ltd. Kobrin 1991 reports results for 2 independent RCTs. Study 2 is same RCT as reported in Guntzel 1991. Data for Study 1 is entered as Kobrin 1991. | |
| Risk of bias | ||
| Bias | Authors' judgement | Support for judgement |
| Allocation concealment? | Unclear risk | B ‐ Unclear |
| Methods | 1‐week washout; 4‐week single‐blind placebo run‐in; inclusion criteria= sitting DBP 95‐114 mm Hg at end of placebo run‐in; 12‐week double‐blind treatment | |
| Participants | 95 postmenopausal women taking HRT regimens that were held constant throughout experimental period; | |
| Interventions | Moexipril 15 mg once daily; | |
| Outcomes | Adjusted mean change from baseline in trough sitting SBP/DBP using mercury sphygmomanometer | |
| Notes | BP change reported, SD of change not reported, endpoint BP and SD not reported; baseline SD reported; imputed baseline SBP SD for SBP SD of change; imputed overall trial mean SD of change for DBP; change in BP data from text and Figure 1, p. 339; Jadad score=3; funding source= Schwarz Pharma | |
| Risk of bias | ||
| Bias | Authors' judgement | Support for judgement |
| Allocation concealment? | Unclear risk | B ‐ Unclear |
| Methods | 2‐week placebo run‐in; inclusion criteria= DBP 95‐115 mm Hg after run‐in; 8‐week double‐blind treatment | |
| Participants | Trandolapril 2 mg: n=135(55 males,80 females); mean age=53.1(11.3) years; baseline SBP=157.3(15) mm Hg, DBP=101.0(6.3) mm Hg, HR=75.6(9.1) bpm; | |
| Interventions | Trandolapril 2 mg once daily; | |
| Outcomes | SBP/DBP | |
| Notes | BP change and SD of change not reported, endpoint BP and SD reported; imputed endpoint SD for SD of change; endpoint BP (week 8) data from text, p. 549; BP data for weeks 5 and 8 provided in Figures 1 and 2, p. 550; BP measurement device not reported; time of post‐dose BP measurement not reported; Jadad score=3; funding source= not reported | |
| Risk of bias | ||
| Bias | Authors' judgement | Support for judgement |
| Allocation concealment? | Unclear risk | B ‐ Unclear |
| Methods | 2‐to 4‐week single‐blind placebo washout; inclusion criteria= supine DBP 95‐114 mm Hg after washout; 12‐week double‐blind treatment | |
| Participants | Ramipril 1.25 mg: n=44(18 males,26 females); mean age=52.3 years; baseline SBP=159(15) mm Hg, DBP=99.9(3.7) mm Hg; | |
| Interventions | Ramipril 1.25 mg once daily; | |
| Outcomes | Mean change from baseline in trough standing SBP/DBP using mercury sphygmomanometer; | |
| Notes | BP change and SD of change reported, endpoint BP and SD not reported; BP data from Table 3, p. 13, SD data from Figures II and III, p. 12; Jadad score=3; funding source= not reported | |
| Risk of bias | ||
| Bias | Authors' judgement | Support for judgement |
| Allocation concealment? | Unclear risk | B ‐ Unclear |
| Methods | 3‐week single‐blind placebo run‐in; inclusion criteria= sitting DBP 95‐115 mm Hg after run‐in; 4‐week double‐blind treatment | |
| Participants | All patients: n=22; mean age=59(11) years; | |
| Interventions | Cilazapril 2.5 mg once daily; | |
| Outcomes | Trough sitting SBP/DBP using oscillometric device (Dinamap); | |
| Notes | BP change and SD of change not reported, endpoint BP and SE reported; calculated endpoint SD from N and SE; endpoint SD values are too low; imputed SBP SD of change from baseline SBP SD of change, imputed overall trial mean DBP SD of change; BP data from Table 2, p. 455; Jadad score=2; funding source= Roche Pharma | |
| Risk of bias | ||
| Bias | Authors' judgement | Support for judgement |
| Allocation concealment? | Unclear risk | B ‐ Unclear |
| Methods | 4‐ to 6‐week placebo run‐in; inclusion criteria= mean sitting DBP 95‐115 mm Hg after run‐in, DBP could not differ by more than 7 mm Hg on 3 consecutive visits; 4‐week double‐blind treatment | |
| Participants | Enalapril 20 mg: n=50(33 males,17 females); mean age=59(10) years; baseline SBP=161.9(14.3) mm Hg, DBP=102.2(5.0) mm Hg, HR=76.2(8.4) bpm; | |
| Interventions | Enalapril 20 mg once daily; | |
| Outcomes | Mean change from baseline in trough sitting SBP/DBP using mercury sphygmomanometer; | |
| Notes | BP change and SD of change reported; endpoint BP and SD not reported; SBP/DBP data from Table 2, p. 788; Jadad score=3; funding source= Hoffman‐La Roche | |
| Risk of bias | ||
| Bias | Authors' judgement | Support for judgement |
| Allocation concealment? | Unclear risk | B ‐ Unclear |
| Methods | 2‐week placebo run‐in; inclusion criteria= 1) sitting DBP=95‐114 mm Hg during last 2 weeks of run‐in, and also on day 0, the first day of active treatment, and 2) mean daytime (0600‐2159h) >/= 85mm Hg by ambulatory BP monitoring; consecutive measurements; 8‐week double‐blind treatment | |
| Participants | Enalapril 10 mg once daily: n=77(32 males,45 females); mean age=55.8(8.7) years; baseline sitting SBP=166.8(14.8) mm Hg, DBP=106.7(4.6) mm Hg; | |
| Interventions | Enalapril 10 mg once daily, | |
| Outcomes | Trough sitting SBP/DBP using mercury sphygmomanometer; | |
| Notes | BP change and SD of change not reported, endpoint BP and SD reported; imputed endpoint SD for SD of change; BP data from Figure 1, p. 95; Jadad score=4; funding source= Solvay Pharma | |
| Risk of bias | ||
| Bias | Authors' judgement | Support for judgement |
| Allocation concealment? | Low risk | A ‐ Adequate |
| Methods | 2‐to 4‐week single‐blind placebo run‐in; inclusion criteria= sitting DBP 100‐120 mm Hg after run‐in; 8‐week double‐blind treatment | |
| Participants | Benazepril 20 mg: n=77(32 males,45 females); mean age=55.8(8.7) years; baseline sitting SBP=166.8(14.8) mm Hg, DBP=106.7(4.6) mm Hg; | |
| Interventions | Benazepril 20 mg once daily; | |
| Outcomes | Trough sitting SBP/DBP using mercury sphygmomanometer; | |
| Notes | BP change and SD of change not reported, endpoint BP reported, endpoint SD not reported, baseline SBP SD reported, imputed baseline SBP SD for SBP SD of change, imputed overall trial mean DBP SD of change; BP data from Table II, p. 1218; Jadad score=3; funding source= Ciba‐Geigy | |
| Risk of bias | ||
| Bias | Authors' judgement | Support for judgement |
| Allocation concealment? | Unclear risk | B ‐ Unclear |
| Methods | 2‐week single‐blind placebo run‐in; inclusion criteria= sitting DBP 95‐109 mm Hg after run‐in; 4‐week double‐blind treatment | |
| Participants | All patients: n=130; 102(79%) caucasian, 25(19%) black, 3(2%) oriental; | |
| Interventions | Cilazapril 2.5 mg once daily; | |
| Outcomes | Trough sitting SBP/DBP using mercury sphygmomanometer; | |
| Notes | BP change and SD of change not reported, endpoint BP reported, endpoint SD not reported; baseline SBP SD reported, imputed baseline SBP SD for SBP SD of change, imputed overall trial mean DBP SD of change; BP data from Table 3, p. 608; Jadad score=3; funding source= Hoffman‐La Roche Ltd. | |
| Risk of bias | ||
| Bias | Authors' judgement | Support for judgement |
| Allocation concealment? | Unclear risk | B ‐ Unclear |
| Methods | 4‐week placebo run‐in; inclusion criteria= supine DBP 90‐115 mm Hg after run‐in; 6‐week double‐blind treatment | |
| Participants | Temocapril 20 mg: n=19(13 males,6 females); mean age=57.6(8.3) years; baseline SBP=162(22) mm Hg, DBP=98(9) mm Hg; | |
| Interventions | Temocapril 20 mg once daily; | |
| Outcomes | Trough supine SBP/DBP using mercury sphygmomanometer; | |
| Notes | BP change and SD of change not reported, endpoint BP and SE reported, calculated endpoint SD from N and endpoint SE, imputed endpoint SD for SD of change; BP data from Table 1, p. 529; Jadad score=3; funding source= not reported | |
| Risk of bias | ||
| Bias | Authors' judgement | Support for judgement |
| Allocation concealment? | Unclear risk | B ‐ Unclear |
| Methods | 2‐week placebo run‐in period; inclusion criteria= supine DBP >/= 95 mm Hg after run‐in; 12‐week double‐blind treatment, forced titration (dose doubled) every 4 weeks starting at 10 mg | |
| Participants | Enalapril 10 mg: n=31(17 males,14 females); mean age=56 years; baseline SBP=152.5(13.4) mm Hg, DBP=102.5(5.0) mm Hg; | |
| Interventions | Enalapril 10 mg once daily; | |
| Outcomes | Mean change from baseline in trough sitting SBP/DBP using mercury sphygmomanometer; | |
| Notes | Used week 4 BP data only; BP change and SE of change reported, endpoint BP and endpoint SE reported, calculated SD of change from N and SE of change; SBP data from Table 2, p. 496; DBP data from Table 3, p. 497; Jadad score=3; funding source= Lederle Laboratories | |
| Risk of bias | ||
| Bias | Authors' judgement | Support for judgement |
| Allocation concealment? | Unclear risk | B ‐ Unclear |
| Methods | 2‐week placebo run‐in period; inclusion criteria= supine DBP >/= 95 mm Hg after run‐in; 4‐week double‐blind treatment | |
| Participants | All patients: n=40(31 males,9 females); mean age=56.6(9.5) years; baseline BP not reported for all patients | |
| Interventions | Perindopril 2 mg once daily; | |
| Outcomes | Supine SBP/DBP using mercury sphygmomanometer | |
| Notes | BP change and SD of change not reported, endpoint BP and endpoint SE reported, calculated endpoint SD from N and endpoint SE, imputed endpoint SD for SD of change; BP data from Figure 2, p. 1133; time of BP measurement not reported (but most likely measured during the first 8 h post‐dose since ambulatory measurements were taken during that period); Jadad score=2; funding source= not reported | |
| Risk of bias | ||
| Bias | Authors' judgement | Support for judgement |
| Allocation concealment? | Unclear risk | B ‐ Unclear |
| Methods | 4‐week single‐blind placebo washout; inclusion criteria= sitting DBP >/= 95 mm Hg after washout; 12‐week double‐blind treatment, forced titration (dose doubled) every 4 weeks starting at 20 mg daily | |
| Participants | Quinapril once daily: n=91(64 males,27 females); median age=49 years; baseline SBP=163 mm Hg, DBP=107 mm Hg; | |
| Interventions | Quinapril 20, 40, 80 mg once daily (morning administration of active drug); | |
| Outcomes | Mean change from baseline in trough sitting SBP/DBP using mercury sphygmomanometer; | |
| Notes | Used week 4 BP data only; BP change and SE of change reported, endpoint BP and SD not reported, calculated SD of change from N and change SE; BP data from Table III, p. 375; Jadad score=3; funding source= not reported | |
| Risk of bias | ||
| Bias | Authors' judgement | Support for judgement |
| Allocation concealment? | Unclear risk | B ‐ Unclear |
| Methods | 4‐week placebo run‐in; inclusion criteria= supine and standing clinic DBP >/= 95 mm Hg after run‐in; 6‐week double‐blind treatment | |
| Participants | Trandolapril 2 mg: n=42(31 males,11 females); mean age=51.4(9.7) years; baseline supine SBP=159.8(12.8) mm Hg, DBP=102.4(5.1) mm Hg, HR=72.1(8.3) bpm; | |
| Interventions | Trandolapril 2 mg once daily; | |
| Outcomes | Trough supine SBP/DBP using mercury sphygmomanometer; | |
| Notes | BP change and SD of change not reported, endpoint BP and SE reported, calculated endpoint SD from N and SE; imputed endpoint SD for SD of change; BP data from Table II, p. 62D; duplicate publication=Ravogli 94; Jadad score=3; funding source= Roussel Pharma | |
| Risk of bias | ||
| Bias | Authors' judgement | Support for judgement |
| Allocation concealment? | Unclear risk | B ‐ Unclear |
| Methods | 4‐week placebo run‐in; inclusion criteria= sitting DBP 100‐110 mm Hg at end of run‐in; 8‐week double‐blind treatment | |
| Participants | Trandolapril 1 mg: n=50; mean age=51(10) years; baseline sitting SBP=159.3(12.4) mm Hg, DBP=103.6(3.1) mm Hg, HR=73.2(10.6) bpm; | |
| Interventions | Trandolapril 1 mg once daily; | |
| Outcomes | Trough sitting SBP/DBP using mercury sphygmomanometer; | |
| Notes | BP change and SD of change not reported; endpoint BP and SD reported; imputed endpoint SD for SD of change; trough BP data from Table 1, p. 493; peak BP data (using 24h ambulatory BP monitoring) in Figure 3, p. 496; Jadad score=3; funding source= not reported | |
| Risk of bias | ||
| Bias | Authors' judgement | Support for judgement |
| Allocation concealment? | Unclear risk | B ‐ Unclear |
| Methods | 3‐ to 4‐week single‐blind placebo run‐in; inclusion criteria= supine DBP 100‐114 mm Hg; 4‐week double‐blind treatment | |
| Participants | Ramipril 10 mg: n=67(44 males,23 females); mean age=53.8(9.8) years; baseline supine SBP=152.7(11.4) mm Hg, DBP=102.9(3.0) mm Hg; | |
| Interventions | Ramipril 10 mg once daily; | |
| Outcomes | Mean change from baseline in trough standing SBP/DBP using mercury sphygmomanometer; | |
| Notes | BP change and SE of change reported, endpoint BP and SE reported, calculated SD of change from N and SE of change; BP data from Table III, p. 740; Jadad score=3; funding source= not reported | |
| Risk of bias | ||
| Bias | Authors' judgement | Support for judgement |
| Allocation concealment? | Unclear risk | B ‐ Unclear |
| Methods | 2‐ to 4‐week single‐blind placebo run‐in; inclusion criteria= sitting DBP 95‐115 mm Hg after run‐in; 4‐week double‐blind treatment | |
| Participants | All patients: n=202; mean age=70 years; baseline sitting SBP=177 mm Hg, DBP=103 mm Hg; | |
| Interventions | Benazepril 2 mg twice daily; | |
| Outcomes | Mean change from baseline in sitting SBP/DBP; | |
| Notes | BP change reported; SD of change not reported, endpoint BP and SD not reported; imputed overall trial mean SD of change; BP data from Table 1, p. IV‐81; BP measurement device not reported; Jadad score=3; funding source= Ciba‐Geigy Inc. | |
| Risk of bias | ||
| Bias | Authors' judgement | Support for judgement |
| Allocation concealment? | Unclear risk | B ‐ Unclear |
| Methods | 4‐week single‐blind placebo run‐in; inclusion criteria= sitting DBP 95‐114 mm Hg after run‐in; 6‐week double‐blind treatment | |
| Participants | Trandolapril 4 mg: n=159(106 males,53 females); mean age=54.3 years; baseline SBP=151.8(14.8) mm Hg, DBP=101.3(5.0) mm Hg; | |
| Interventions | Trandolapril 4 mg once daily; | |
| Outcomes | Mean change from baseline in trough sitting SBP/DBP using mercury sphygmomanometer | |
| Notes | BP change and SD of change reported, endpoint BP and SD not reported; SD of change values reported are low; imputed baseline SBP SD for SBP SD of change, imputed overall trial mean DBP SD of change; BP data from Table 2, p. 325; Jadad score=3; funding source= Knoll Pharma | |
| Risk of bias | ||
| Bias | Authors' judgement | Support for judgement |
| Allocation concealment? | Unclear risk | B ‐ Unclear |
| Methods | 2‐ to 4‐week single‐blind placebo run‐in; inclusion criteria= sitting DBP 95‐114 mm Hg on 2 consecutive visits (weeks 2 and 4 of run‐in) with </= 10 mm Hg difference between 2 visits; 4‐week double‐blind treatment | |
| Participants | Benazepril 2 mg once daily: n=34(24 males,10 females); mean age=50.4 years; baseline sitting SBP=151.6(15.9) mm Hg, DBP=102.1(5.6) mm Hg; | |
| Interventions | Benazepril 2 mg once daily; | |
| Outcomes | Trough sitting DBP using mercury sphygmomanometer; | |
| Notes | BP change and SD of change not reported, endpoint BP and SE reported, calculated endpoint SD from N and endpoint SE, imputed endpoint SD for SD of change; DBP data from Table III, p. 325; Jadad score=3; funding source= Ciba‐Geigy | |
| Risk of bias | ||
| Bias | Authors' judgement | Support for judgement |
| Allocation concealment? | Unclear risk | B ‐ Unclear |
| Methods | 4‐week single‐blind placebo run‐in; inclusion criteria= sitting DBP 95‐114 mm Hg at each of last 2 visits during run‐in; 4‐week double‐blind treatment | |
| Participants | Cilazapril 2.5 mg: n=59(45 males,14 females); mean age=52.4 years; baseline sitting SBP=146.3 mm Hg, DBP=101.1 mm Hg, HR=75.5 bpm; | |
| Interventions | Cilazapril 2.5 mg once daily; | |
| Outcomes | Mean change from baseline in trough sitting SBP/DBP using mercury sphygmomanometer; | |
| Notes | BP change and SE of change reported, endpoint BP and SE reported; calculated SD of change from N and SE of change; BP data from text and Table 2, p. 1424; Jadad score=3; funding source= not reported | |
| Risk of bias | ||
| Bias | Authors' judgement | Support for judgement |
| Allocation concealment? | Unclear risk | B ‐ Unclear |
| Methods | 4‐week single‐blind placebo run‐in; inclusion criteria= sitting DBP 95‐114 mm Hg at last 2 consecutive visits of placebo run‐in, with difference between visits of 10 mm Hg or less; 12‐week double‐blind treatment | |
| Participants | Moexipril 7.5 mg: n=51(31 males,20 females); mean age=54.9 years; baseline sitting SBP=152.2 mm Hg, DBP=101.8 mm Hg, HR=75.8 bpm; baseline standing SBP=148.4 mm Hg, DBP=100.9 mm Hg; | |
| Interventions | Moexipril 7.5 mg once daily; | |
| Outcomes | Adjusted mean change from baseline in trough sitting SBP/DBP using mercury sphygmomanometer; | |
| Notes | BP change and SD of change reported; endpoint SBP not reported, endpoint DBP reported, endpoint SD not reported; change in SBP data from Table 3, p. 85; change in DBP data from Table 2, p. 83; Jadad score=3; funding source= Schwarz Pharma | |
| Risk of bias | ||
| Bias | Authors' judgement | Support for judgement |
| Allocation concealment? | Unclear risk | B ‐ Unclear |
| Methods | 3‐week placebo run‐in; inclusion criteria= supine DBP 100‐110 mm Hg during run‐in; 4‐week double‐blind treatment | |
| Participants | All patients: n=152(77 males,75 females); mean age=69(4) years; | |
| Interventions | Captopril 25 mg twice daily; | |
| Outcomes | Standing SBP/DBP using mercury sphygmomanometer; | |
| Notes | BP change and SD of change not reported, endpoint BP and SD reported; imputed endpoint SD for SD of change in captopril group; imputed baseline SBP SD for SBP SD of change in placebo group; in placebo group, imputed systematic review overall mean SD of change for DBP; BP data from text and Figure 1, p. S600; baseline supine SBP/DBP and SD for placebo group from Table 1, p. S601; supine BP data also available; Jadad score=3; funding source= Squibb Italia SpA | |
| Risk of bias | ||
| Bias | Authors' judgement | Support for judgement |
| Allocation concealment? | Unclear risk | B ‐ Unclear |
| Methods | 4‐week single‐blind placebo run‐in; inclusion criteria= supine DBP 95‐114 mm Hg after run‐in; 12‐week double‐blind treatment; 293 patients included in safety analysis; 260 patients included in efficacy analyses | |
| Participants | Perindopril 2 mg: n=62(39 males,23 females); mean age=51(16) years; baseline SBP/DBP not reported for all 62 patients; | |
| Interventions | Perindopril 2 mg once daily; | |
| Outcomes | Mean change from baseline in trough supine SBP/DBP using mercury sphygmomanometer; | |
| Notes | BP change reported, SD of change not reported, endpoint BP and SD not reported, baseline SEM reported, calculated baseline SD from N and baseline SEM, imputed baseline SBP SD for SBP SD of change; imputed overall trial mean DBP SD of change; BP data from Table 2, p. 1193; Jadad score=3; funding source= not reported | |
| Risk of bias | ||
| Bias | Authors' judgement | Support for judgement |
| Allocation concealment? | Unclear risk | B ‐ Unclear |
| Methods | No placebo run‐in; inclusion criteria= patients with established Type 2 DM and BP > 75th centile for age and sex, taking no anti‐hypertensive medication; 3‐week double‐blind treatment | |
| Participants | Trandolapril 4 mg: n=12(10 males,2 females); mean age=58(11) years; baseline SBP=168(13) mm Hg, DBP=98(10) mm Hg; | |
| Interventions | Trandolapril 4 mg once daily; | |
| Outcomes | Trough supine SBP/DBP using mercury sphygmomanometer | |
| Notes | BP change and SD of change not reported; endpoint BP and SD reported; imputed endpoint SD for SD of change; SBP/DBP data from Figure 1, p. 137; Jadad score=2; funding source= Hoechst Marion Rousell | |
| Risk of bias | ||
| Bias | Authors' judgement | Support for judgement |
| Allocation concealment? | Unclear risk | B ‐ Unclear |
| Methods | 4‐ to 5‐week single‐blind placebo run‐in during which previous antihypertensive medication withdrawn; patients qualified for 3‐ to 4‐week enalapril challenge period if sitting DBP 95‐114 mm Hg and difference between their average sitting DBP values for last 2 visits of placebo run‐in period did not exceed 12 mm Hg; during enalapril challenge patients received enalapril 20 mg daily (10 mg for first 3 days); patients who developed persistent, nonproductive cough while receiving enalapril were then given placebo for 2‐4 weeks to allow cough to clear; eligible patients (those meeting inclusion criteria for enalapril challenge and whose cough subsequently cleared during placebo washout period) then entered 6‐week double‐blind treatment | |
| Participants | Enalapril 20 mg: n=45(23 males,22 females); baseline sitting SBP=154.6(14.1) mm Hg, DBP=100.9(4.7) mm Hg, HR=74.8(9.4) bpm; | |
| Interventions | Enalapril 20 mg once daily (10 mg for first 3 days); | |
| Outcomes | Mean change from baseline in sitting DBP; | |
| Notes | DBP change and SD of change reported, endpoint BP and SD not reported, DBP data from text (p. 8) and Figure 3, p. 10; BP measurement device not reported; time of BP measurement not reported; Jadad score=4; funding source= SmithKline Beecham Pharma | |
| Risk of bias | ||
| Bias | Authors' judgement | Support for judgement |
| Allocation concealment? | Unclear risk | B ‐ Unclear |
| Methods | 3‐week single‐blind placebo run‐in; inclusion criteria= sitting DBP 95‐104 mm Hg after run‐in; 6‐week double‐blind treatment | |
| Participants | Perindopril 4 mg: n=253(130 males,123 females); mean age=59.3(11.1) years; baseline SBP=161.7(17.5) mm Hg, DBP=99.4(4.8) mm Hg, HR=78.5(14.3) bpm; | |
| Interventions | Perindopril 4 mg once daily; | |
| Outcomes | Trough sitting SBP/DBP using automatic device; | |
| Notes | BP change and SD of change not reported, endpoint BP and SEM reported, calculated endpoint SD from N and endpoint SEM, imputed endpoint SD for SD of change; BP data from Table III, p. 129; Jadad score=3; funding source= Servier | |
| Risk of bias | ||
| Bias | Authors' judgement | Support for judgement |
| Allocation concealment? | Unclear risk | B ‐ Unclear |
| Methods | Washout phase; 4‐week single‐blind placebo run‐in; inclusion criteria= sitting DBP 95‐114 mm Hg, with a difference of 10 mm Hg or less at last 2 consecutive visits of run‐in; subjects with DBP =/> 110 mm Hg could be included directly following minimum of 7 days single‐blind placebo; 8‐week double‐blind treatment | |
| Participants | Moexipril 7.5 mg: n=50(21 males,29 females); mean age=70.4 years; baseline sitting SBP=173 mm Hg, DBP=102 mm Hg, HR=76.7 bpm; | |
| Interventions | Moexipril 7.5 mg once daily; | |
| Outcomes | Adjusted mean change from baseline in trough sitting SBP/DBP using mercury sphygmomanometer; | |
| Notes | BP change and SD of change reported, endpoint SBP not reported, endpoint DBP reported, endpoint SD not reported; change in trough BP data from Table 2, p. 261; placebo‐corrected change in peak DBP data from Table 4, p. 262; endpoint BP data used instead of weighted mean of BP change for 3 measurements (at weeks 4,6,8) because N values not reported for weeks 4 and 6; Jadad score=3; funding source= Schwarz Pharma | |
| Risk of bias | ||
| Bias | Authors' judgement | Support for judgement |
| Allocation concealment? | Unclear risk | B ‐ Unclear |
| Methods | 2‐week washout; 2‐week single‐blind placebo run‐in; inclusion criteria= mean sitting DBP 100‐114 mm Hg; 6‐week double‐blind treatment phase at fixed dose, patients with inadequate BP response had their doses doubled and were treated for another 6 weeks | |
| Participants | Spirapril 3 mg: n= 52(32 males,20 females); mean age=55.8 years; baseline sitting SBP=159.0 mm Hg, DBP=104.6 mm Hg (trough data); baseline sitting SBP=156.7 mm Hg, DBP=103.4 mm Hg (peak data); | |
| Interventions | Spirapril 3 mg once daily; | |
| Outcomes | Mean change from baseline in trough sitting SBP/DBP using mercury sphygmomanometer; | |
| Notes | Used week 6 BP data only; BP change and SD of change reported, endpoint BP reported, endpoint SD not reported; change in trough and peak BP data from Table 2A, p. 624; Jadad score=3; funding source= Novartis Pharma | |
| Risk of bias | ||
| Bias | Authors' judgement | Support for judgement |
| Allocation concealment? | Unclear risk | B ‐ Unclear |
| Methods | 2‐week placebo run‐in; inclusion criteria= mean sitting DBP 95‐110 mm Hg; 6‐week double‐blind treatment | |
| Participants | Fosinopril 20 mg: n=16(4 males,12 females); mean age=56.4(8.1) years; baseline sitting SBP=151.8(14.0) mm Hg, DBP=100.8(4.8) mm Hg, HR=75.9(11.9) bpm; | |
| Interventions | Fosinopril 20 mg once daily; | |
| Outcomes | Trough sitting SBP/DBP; | |
| Notes | SBP change not reported, DBP change reported; SD of change not reported, endpoint BP and SD reported; imputed endpoint SD for SD of change; BP data from text, p. 496 and p. 460; BP measurement device not reported; Jadad score=3; funding source= not reported | |
| Risk of bias | ||
| Bias | Authors' judgement | Support for judgement |
| Allocation concealment? | Unclear risk | B ‐ Unclear |
| Methods | 2‐week single‐blind placebo run‐in; inclusion criteria= sitting DBP 95‐109 mm Hg, within 10 mm Hg on 2 consecutive weekly visits during run‐in; 4‐week double‐blind treatment | |
| Participants | All patients: n=42(27 males,15 females); all white; | |
| Interventions | Cilazapril 2.5 mg once daily; | |
| Outcomes | Trough sitting SBP/DBP using mercury sphygmomanometer | |
| Notes | BP change and SD of change not reported, endpoint BP reported, endpoint SD not reported; baseline SBP SD reported, imputed baseline SBP SD for SBP SD of change, imputed overall trial mean DBP SD of change; BP data from Table 1, p. 914; Jadad score=3; funding source= Hoffman‐La Roche Ltd. | |
| Risk of bias | ||
| Bias | Authors' judgement | Support for judgement |
| Allocation concealment? | Unclear risk | B ‐ Unclear |
| Methods | 4‐ to 6‐week placebo run‐in; inclusion criteria= sitting DBP 95‐114 mm Hg on 2 consecutive visits after beginning of placebo run‐in; 4‐week double‐bind treatment at fixed dose; after 4 weeks, patients with inadequate BP response had their doses doubled during the second 4 weeks; hydrochlorothiazide 25 mg was added during final 4 weeks | |
| Participants | All patients: n=418 patients randomized to double‐blind treatment; n=380 who completed 4 weeks of double‐blind treatment included in efficacy analysis; | |
| Interventions | Fosinopril 5 mg once daily; | |
| Outcomes | Mean change in trough sitting SBP/DBP using mercury sphygmomanometer; | |
| Notes | BP change reported, SD of change not reported, endpoint BP and SD not reported; baseline SD not reported; imputed overall trial mean SD of change for SBP and DBP; change in SBP data from Figure 2, p. 524; change in DBP data from Table II, p. 526; Jadad score=3; funding source= Bristol‐Myers Squibb | |
| Risk of bias | ||
| Bias | Authors' judgement | Support for judgement |
| Allocation concealment? | Unclear risk | B ‐ Unclear |
| Methods | 4‐ to 5‐week single‐blind placebo run‐in; inclusion criteria= mean sitting DBP 95‐110 mm Hg at consecutive visits (third and fourth weeks, or fourth and fifth weeks) during run‐in; 8‐week double‐blind treatment | |
| Participants | All patients: n=548(335 males,213 females); mean age=51.5(11.0) years; baseline sitting SBP=149.5(15.7) mm Hg, DBP=100.1(4.0) mm Hg; | |
| Interventions | Fosinopril 2.5 mg once daily; | |
| Outcomes | Adjusted mean change from baseline in trough sitting SBP/DBP using mercury sphygmomanometer; | |
| Notes | Adjusted BP change reported, SD of change not reported, endpoint BP reported; endpoint SD not reported; baseline SD not reported; imputed overall trial mean SD of change for SBP and DBP; used endpoint BP data to calculated change in BP instead of entering adjusted BP change data; BP data from Tables 3 and 4, p. 120; Jadad score=3; funding source= Bristol‐Myers Squibb | |
| Risk of bias | ||
| Bias | Authors' judgement | Support for judgement |
| Allocation concealment? | Unclear risk | B ‐ Unclear |
| Methods | 2‐ to 4‐week single‐blind placebo run‐in; inclusion criteria= sitting DBP 100‐115 mm Hg after run‐in; 8‐week double‐blind treatment | |
| Participants | All patients: n=454(286 males,168 females); mean age=53.8 years; | |
| Interventions | Benazepril 10 mg once daily; | |
| Outcomes | Mean change from baseline in trough sitting SBP/DBP using mercury sphygmomanometer; | |
| Notes | BP change reported, SD of change not reported; endpoint BP and SD not reported, baseline SD not reported, imputed overall trial mean SBP and DBP SD of change; BP and HR data from Table 1, p. 497; Jadad score=5; funding source= Novartis Pharma | |
| Risk of bias | ||
| Bias | Authors' judgement | Support for judgement |
| Allocation concealment? | Low risk | A ‐ Adequate |
| Methods | 4‐week single‐blind placebo run‐in; inclusion criteria= sitting DBP 95‐115 mm Hg after run‐in; 4‐week double‐blind treatment | |
| Participants | Cilazapril 0.5‐10 mg: n=288(166 males,122 females); mean age=53.9(12.1) years; baseline sitting DBP=100.4 mm Hg; | |
| Interventions | Cilazapril 0.5 mg once daily; | |
| Outcomes | Mean change from baseline in trough sitting DBP using mercury sphygmomanometer; | |
| Notes | SBP not reported; DBP change and SD of change reported, endpoint BP and SD not reported; BP data from Table 3, p. 315; Jadad score=3; funding source= Hoffmann‐La Roche Ltd. | |
| Risk of bias | ||
| Bias | Authors' judgement | Support for judgement |
| Allocation concealment? | Unclear risk | B ‐ Unclear |
| Methods | 4‐week single‐blind placebo run‐in; inclusion criteria= DBP 95‐115 mm Hg after run‐in; 4‐week double‐blind treatment | |
| Participants | Cilazapril 2.5 mg: n=54(36 males,18 females); mean age=55.6(10.1) years; baseline sitting SBP=162.5(15.1) mm Hg, DBP=102.4(5.4) mm Hg; | |
| Interventions | Cilazapril 2.5 mg once daily; | |
| Outcomes | Trough supine SBP/DBP using mercury sphygmomanometer; | |
| Notes | BP change and SD of change not reported, endpoint BP and SD reported; imputed endpoint SD for SD of change; BP data from Table 2, p. S95; Jadad score=3; funding source= not reported | |
| Risk of bias | ||
| Bias | Authors' judgement | Support for judgement |
| Allocation concealment? | Unclear risk | B ‐ Unclear |
| Methods | 4‐week placebo run‐in; inclusion criteria= 1) sitting DBP=95‐114 mm Hg and sitting SBP</=200mm Hg during 2 weeks immediately prior to randomization, and on day 0, the first day of active treatment, with variation in DBP of not more than 10 mm Hg between the last week of run‐in phase and day 0, and 2) mean daytime (0600‐2159h) DBP>/=85 mm Hg by ambulatory BP monitoring on day immediately preceding randomization; 8‐week double‐blind treatment | |
| Participants | Enalapril 20 mg once daily: n=53(35 males,18 females); mean age=52.2(10.3) years; baseline sitting SBP=165.2(14.5) mm Hg, DBP=101.1(4.4) mm Hg; baseline HR=78.0(7.3) bpm; | |
| Interventions | Enalapril 20 mg once daily, | |
| Outcomes | Mean change from baseline in trough sitting SBP/DBP using mercury sphygmomanometer; | |
| Notes | BP change and SD of change reported, endpoint BP and SD reported, BP data from Table II, p. 169; Jadad score=4; funding source= Solvay Pharma | |
| Risk of bias | ||
| Bias | Authors' judgement | Support for judgement |
| Allocation concealment? | Low risk | A ‐ Adequate |
| Methods | 3‐week placebo run‐in; inclusion criteria= DBP 95‐104 mm Hg; 6‐week double‐blind treatment | |
| Participants | Perindopril 4 mg: n=27(20 males,7 females); mean age=54(9.8) years; baseline sitting SBP=161.3(12.5) mm Hg, DBP=100.4(3.8) mm Hg; | |
| Interventions | Perindopril 4 mg once daily; | |
| Outcomes | SBP/DBP using mercury sphygmomanometer; | |
| Notes | BP change and SD of change not reported, endpoint BP and SD reported; imputed endpoint SD for SD of change; BP data from Table 3, p. 190; time and position of BP measurement not reported; Jadad score=3; funding source= not reported | |
| Risk of bias | ||
| Bias | Authors' judgement | Support for judgement |
| Allocation concealment? | Unclear risk | B ‐ Unclear |
| Methods | 1‐week washout (only for patients previously treated with anti‐hypertensive therapy); 2‐week single‐blind placebo run‐in; inclusion criteria= DBP 90‐109 mm Hg (which differed < 10mm Hg from that observed in previous visit) after run‐in; 6‐week double‐blind treatment | |
| Participants | All patients (per protocol population): n=342(137 males,205 females); mean age=55.6(9.9) years; baseline sitting SBP=158.3(10.6) mm Hg, DBP=98.6(5.3) mm Hg | |
| Interventions | Enalapril 5 mg once daily; | |
| Outcomes | Mean change from baseline in trough sitting SBP/DBP using mercury sphygmomanometer | |
| Notes | BP change and SD of change not reported, endpoint BP reported; endpoint SD not reported; baseline SD reported; imputed baseline SBP SD for SD of change; imputed overall trial mean DBP SD of change; BP data from Figure 1, p. 844; Jadad score=2; funding source= VITA INVEST | |
| Risk of bias | ||
| Bias | Authors' judgement | Support for judgement |
| Allocation concealment? | Unclear risk | B ‐ Unclear |
| Methods | 15‐day washout; 15‐day placebo run‐in; inclusion criteria= DBP 95‐120 mm Hg after run‐in; 4‐week double‐blind treatment | |
| Participants | Enalapril 20 mg: n=53(40 males,13 females); mean age=47.4 years; baseline supine SBP=161.4(13.0) mm Hg, DBP=103.3(6.3) mm Hg; | |
| Interventions | Enalapril 20 mg once daily; | |
| Outcomes | Peak supine SBP/DBP using mercury sphygmomanometer; | |
| Notes | BP change and SD of change not reported, endpoint BP and SD reported; imputed endpoint SD for SD of change; BP data from Table I, p. 19; Jadad score=3; funding source= Merck Sharpe and Dohme | |
| Risk of bias | ||
| Bias | Authors' judgement | Support for judgement |
| Allocation concealment? | Unclear risk | B ‐ Unclear |
| Methods | 4‐week single‐blind placebo phase; inclusion criteria= DBP 100‐115 mm Hg after placebo phase; 12‐week double‐blind treatment, dosage doubled every 4 weeks (10‐40 mg twice daily) | |
| Participants | Quinapril: n=7(2 males,5 females); mean age=48(11) years; baseline SBP=159(8) mm Hg, DBP=105(3) mm Hg; | |
| Interventions | Quinapril 10 mg twice daily; | |
| Outcomes | Trough (12h after previous dose) sitting SBP/DBP using mercury sphygmomanometer | |
| Notes | Used week 4 BP data only; BP change and SD of change not reported, endpoint BP and SEM reported, calculated endpoint SD from N and endpoint SEM, imputed endpoint SD for SD of change; BP data from Figure 2, p. 90; Jadad score=2; funding source= Warner‐Lambert/Parke‐Davis Co. | |
| Risk of bias | ||
| Bias | Authors' judgement | Support for judgement |
| Allocation concealment? | Unclear risk | B ‐ Unclear |
| Methods | 4‐ to 6‐week single‐blind placebo run‐in; inclusion criteria= sitting DBP 92‐109 mm Hg on last 2 visits of run‐in; 4‐week double‐blind treatment at fixed dose, after 4‐weeks captopril dosage doubled in all randomized patients for additional 4 weeks | |
| Participants | Captopril 50 mg once daily: n=88(58 males,30 females); mean age=52 years; baseline sitting SBP=149.3 mm Hg, DBP=98.2 mm Hg; | |
| Interventions | Captopril 50 mg once daily; | |
| Outcomes | Sitting DBP | |
| Notes | Used week 4 BP data only; BP change not reported, SD of change not reported, endpoint SBP not reported; endpoint DBP reported; endpoint SD not reported; baseline SD not reported; imputed overall trial mean SD of change for DBP; DBP data from Table 3, p. 382; BP measurement device not reported; Jadad score=2; funding source= not reported | |
| Risk of bias | ||
| Bias | Authors' judgement | Support for judgement |
| Allocation concealment? | Unclear risk | B ‐ Unclear |
| Methods | 1‐week washout period (for patients previously treated with antihypertensive therapy); 4‐week single‐blind placebo run‐in; inclusion criteria= sitting DBP 100‐115 mm Hg (which differed by less than 10 mm Hg from that observed on the previous visit) after run‐in; 6‐week double‐blind treatment | |
| Participants | Trandolapril 0.5‐2 mg: n=85; baseline SBP/DBP not reported; | |
| Interventions | Trandolapril 0.5 mg once daily; | |
| Outcomes | Mean change from baseline in trough supine SBP/DBP using mercury sphygmomanometer; | |
| Notes | Adjusted and non‐adjusted BP data reported; non‐adjusted BP entered in Revman; BP change reported, SD of change not reported; 95% confidence interval of change reported; endpoint BP and SD not reported; calculated SD of change from 95% CI of change; BP data from Table 1, p. 493; Jadad score=3; funding source= Knoll AG | |
| Risk of bias | ||
| Bias | Authors' judgement | Support for judgement |
| Allocation concealment? | Unclear risk | B ‐ Unclear |
| Methods | 2‐ to 4‐week single‐blind placebo run‐in; inclusion criteria= supine DBP 100‐115 mm Hg after run‐in; 6‐week double‐blind treatment | |
| Participants | All patients: n=507(327 males,180 females); mean age=50.2 years; baseline SBP/DBP not reported | |
| Interventions | Ramipril 2.5 mg once daily; | |
| Outcomes | Mean change from baseline in trough supine SBP/DBP using mercury sphygmomanometer | |
| Notes | BP change and SEM of change reported, endpoint BP and SD not reported; calculated SD of change from N and change SE; BP data from Table 1, p. 1453; Jadad score=3; funding source= Hoechst AG | |
| Risk of bias | ||
| Bias | Authors' judgement | Support for judgement |
| Allocation concealment? | Unclear risk | B ‐ Unclear |
| Methods | 4‐week placebo run‐in; inclusion criteria= not reported but baseline DBP for all groups is at least 90 mm Hg; 12‐week total double‐blind treatment; increasing doses of enalapril 10, 20, and 40 mg daily every 4 weeks | |
| Participants | All patients: n= 34(33 male,1 female) white patients; | |
| Interventions | Enalapril 10 mg once daily; | |
| Outcomes | Trough sitting SBP/DBP | |
| Notes | Used week 4 DBP only since patients treated with enalapril 10 mg once daily did not have SBP >/= 140mm Hg at baseline; BP change and SD of change not reported; endpoint BP reported; endpoint SD not reported; imputed overall trial mean SD of change; BP data from Figure 1, p. 461; BP measurement device not reported; Jadad score=2; funding source= not reported | |
| Risk of bias | ||
| Bias | Authors' judgement | Support for judgement |
| Allocation concealment? | Unclear risk | B ‐ Unclear |
| Methods | 2‐ to 3‐week screening/washout period; 4‐week single‐blind placebo run‐in; inclusion criteria= supine DBP 95‐114 mm Hg; 12‐week double‐blind treatment | |
| Participants | Enalapril 20 mg: n=72(44 males,28 females); mean age=53.1(11.0) years; baseline supine SBP=153.8(13.8) mm Hg, DBP=100.4(4.2) mm Hg; | |
| Interventions | Enalapril 20 mg once daily; | |
| Outcomes | Mean change from baseline in trough supine SBP/DBP using mercury sphygmomanometer; | |
| Notes | BP change and SE of change reported; endpoint BP and SD not reported; calculated SD of change from N and SE of change; change in BP data from Figures 1 and 2, p. 235; SE of change data from Table 2, p. 234; Jadad score=3; funding source= Boehringer Ingelheim Pharma | |
| Risk of bias | ||
| Bias | Authors' judgement | Support for judgement |
| Allocation concealment? | Unclear risk | B ‐ Unclear |
| Methods | Minimum 7‐day washout; 4‐week single‐blind placebo run‐in; inclusion criteria= supine DBP 100‐114 mm Hg during final 2 weeks of run‐in, mean supine DBP could not vary by more than 7 mm Hg between weeks 2 and 3 or weeks 3 and 4 of run‐in, or by more than 10 mm Hg between weeks 2 and 4 of run‐in; 4‐week double‐blind treatment | |
| Participants | Enalapril 20 mg: n=42(31 males,11 females); mean age=52.0 years; baseline supine SBP=155.3 mm Hg, DBP=103.3 mm Hg, HR=72.7 bpm; | |
| Interventions | Enalapril 20 mg once daily; | |
| Outcomes | Mean change from baseline in trough standing SBP/DBP using mercury sphygmomanometer; | |
| Notes | BP change and SE of change reported; endpoint BP and SD not reported; calculated SD of change from N and SE of change; change in BP data from Table II, p. 1385; Jadad score=4; funding source= Boehringer Ingelheim Pharma | |
| Risk of bias | ||
| Bias | Authors' judgement | Support for judgement |
| Allocation concealment? | Low risk | A ‐ Adequate |
| Methods | No minimal BP inclusion criteria; 24‐week total double‐blind treatment, report BP at week 4 of double‐blind treatment | |
| Participants | All patients (normotensive and hypertensive) with non‐insulin‐dependent diabetes mellitus: | |
| Interventions | Ramipil 1.25 mg once daily; | |
| Outcomes | Mean change from baseline in sitting SBP/DBP using mercury sphygmomanometer; | |
| Notes | Used week 4 BP data only; no minimal BP inclusion criteria, trial included both hypertensive and non‐hypertensive patients; Used BP data from subgroup with BP >/= 160/95 mm Hg; BP change and SD of change not reported; endpoint BP and SD reported; imputed endpoint SD of change; BP data from Table 5, p. 881; time of BP measurement not reported; Jadad score=4; funding source= Hoechst | |
| Risk of bias | ||
| Bias | Authors' judgement | Support for judgement |
| Allocation concealment? | Unclear risk | B ‐ Unclear |
| Methods | 4‐week normal sodium, placebo run‐in (week 0‐4); inclusion criteria= mean supine DBP 95‐114 mm Hg and mean daytime ambulatory DBP 90‐105 mm Hg after run‐in; 8‐week low‐sodium placebo period (week 4‐12); 12‐week double‐blind treatment (week 12‐24) | |
| Participants | Cilazapril 2.5 mg: n=19(10 males,9 females); mean age=53.7(5.7) years; baseline sitting SBP=157.3(17.1) mm Hg, DBP=104.0(8.0) mm Hg, HR=70(13) bpm; | |
| Interventions | Cilazapril 2.5 mg once daily; | |
| Outcomes | Trough sitting SBP/DBP using mercury sphygmomanometer; | |
| Notes | BP change reported; SD of change not reported; 95% confidence interval of change reported; calculated SD of change from 95% CI of change; endpoint BP and SD reported; BP change data from Table 6, p. 323; endpoint BP data from Table 4, p. 322; Jadad score=3; funding source= Hoffmann‐La Roche Ltd. | |
| Risk of bias | ||
| Bias | Authors' judgement | Support for judgement |
| Allocation concealment? | Unclear risk | B ‐ Unclear |
| Methods | 2‐ to 5‐week single‐blind placebo run‐in; inclusion criteria= sitting DBP 92‐109 mm Hg on 2 consecutive clinic visits during run‐in; 7‐week double‐blind treatment | |
| Participants | Captopril 12.5 mg TID: n=83(all males); mean age=55.7(9.8) years; baseline sitting SBP=147.8(14.6) mm Hg, DBP=97.0(3.6) mm Hg; | |
| Interventions | Captopril 12.5 mg three times daily, | |
| Outcomes | Mean change from baseline in sitting SBP/DBP using mercury sphygmomanometer; WDAE; visits were scheduled approx 3 h from the time the patient took his last dose of medication | |
| Notes | BP change and SE of change reported; endpoint BP and SD reported; calculated SD of change from N and change SE; BP data from Table 4, p. 1953; Jadad score=4; funding source= E.R. Squibb & Sons Inc. | |
| Risk of bias | ||
| Bias | Authors' judgement | Support for judgement |
| Allocation concealment? | Low risk | A ‐ Adequate |
| Methods | 2‐week placebo run‐in; inclusion criteria= sitting DBP 95‐115 mm Hg; 4‐week double‐blind treatment | |
| Participants | Imidapril 5 mg: n=33(21 males,12 females); mean age=53.2(12.1) years; baseline sitting DBP=102.3(5.7) mm Hg; | |
| Interventions | Imidapril 5 mg once daily; | |
| Outcomes | Trough sitting SBP/DBP using mercury sphygmomanometer; | |
| Notes | BP change and SD of change reported; endpoint BP and SD reported; change in BP data from Table 4, p. 271; Jadad score=3; funding source= Tanabe Pharma | |
| Risk of bias | ||
| Bias | Authors' judgement | Support for judgement |
| Allocation concealment? | Unclear risk | B ‐ Unclear |
| Methods | 2‐week washout; 2‐week single‐blind placebo run‐in; inclusion criteria= mean supine DBP 95‐114 mm Hg after run‐in; 4‐week double‐blind treatment | |
| Participants | Trandolapril 2 mg: n=24(15 males,9 females); mean age=56(10) years; baseline sitting SBP=163(16) mm Hg, DBP=101(6) mm Hg; | |
| Interventions | Trandolapril 2 mg once daily; | |
| Outcomes | Mean change from baseline in trough sitting SBP/DBP using mercury sphygmomanometer | |
| Notes | BP change and SD of change reported; endpoint BP and SD not reported; SBP/DBP data from Table 3, p. 110; Jadad score=3; funding source= Roussel Pharma | |
| Risk of bias | ||
| Bias | Authors' judgement | Support for judgement |
| Allocation concealment? | Unclear risk | B ‐ Unclear |
| Methods | 2‐week placebo run‐in; inclusion criteria= supine and standing DBP 95‐120 mm Hg after run‐in; 4‐week double‐blind treatment | |
| Participants | Ramipril 2.5 mg: n=28(12 males,16 females); median age=54 years; baseline SBP=162.0 mm Hg, DBP=101.1 mm Hg; | |
| Interventions | Ramipril 2.5 mg once daily; | |
| Outcomes | Mean change from baseline in trough standing SBP/DBP using mercury sphygmomanometer; | |
| Notes | BP change and SEM of change reported, endpoint BP and SD not reported; calculated SD of change from N and change SE; BP data from Tables III and IV, p. 112D; Jadad score=3; funding source= Hoechst AG | |
| Risk of bias | ||
| Bias | Authors' judgement | Support for judgement |
| Allocation concealment? | Unclear risk | B ‐ Unclear |
| Methods | 4‐week placebo run‐in; inclusion criteria= sitting DBP 95‐110 mm Hg after run‐in; 12‐week total double‐blind treatment, titrated to response at 4 weeks | |
| Participants | Enalapril 10 mg: n=321(188 males,133 females); mean age=52.4(10.2) years; baseline sitting SBP=158.0(15.4) mm Hg, DBP=100.9(4.6) mm Hg; | |
| Interventions | Enalapril 10 mg once daily; | |
| Outcomes | Mean change from baseline in trough sitting SBP/DBP using mercury sphygmomanometer; | |
| Notes | Used week 4 BP data only; BP change and SD of change reported, endpoint BP and SD not reported; BP data from Figure I, p. 917; Jadad score=3; funding source= not reported | |
| Risk of bias | ||
| Bias | Authors' judgement | Support for judgement |
| Allocation concealment? | Unclear risk | B ‐ Unclear |
| Methods | 2‐ to 4‐week single‐blind placebo run‐in; inclusion criteria= sitting DBP 95‐114 mm Hg, inclusive, on 2 consecutive visits (weeks 2 and 4 of run‐in) with </= 10mm Hg difference between 2 visits; 4‐week double‐blind treatment | |
| Participants | Benazepril 5 mg: n=38(23 males,15 females); mean age=51.1 years; baseline sitting SBP=152.7(15.2) mm Hg, DBP=101.2(5.3) mm Hg; | |
| Interventions | Benazepril 5 mg once daily; | |
| Outcomes | Trough sitting DBP using mercury sphygmomanometer; | |
| Notes | BP change and SE of change reported, endpoint BP reported, endpoint SE not reported; calculated SD of change from N and SE of change; DBP data from Table III, p. 325; Jadad score=2; funding source= Ciba‐Geigy | |
| Risk of bias | ||
| Bias | Authors' judgement | Support for judgement |
| Allocation concealment? | Unclear risk | B ‐ Unclear |
| Methods | 4‐week single‐blind placebo run‐in; inclusion criteria= mean supine DBP 95‐114 mm Hg during both of final 2 consecutive weeks of run‐in; 6‐week double‐blind treatment | |
| Participants | Black and white patients reported in Weir 1995: | |
| Interventions | Trandolapril 0.25 mg once daily (black patients only); | |
| Outcomes | Mean change from baseline in trough sitting SBP/DBP using mercury sphygmomanometer (Trandolapril 1, 2, 4 mg treatment arms); | |
| Notes | Weir 1995: BP change and SE of change reported; calculated SD of change from N and SE of change; endpoint BP and SD not reported; SBP/DBP data from Table 2, p. 126; Jadad score=3; funding source= Knoll Pharma Weir 1998: BP change and SE of change reported for trandalopril groups; SBP SE of change in placebo group not reported; DBP SE of change in placebo group reported; imputed baseline SBP SE for SE of change; calculated SD of change from N and SE of change; endpoint BP and SD not reported; SBP/DBP data from Table 2, p. 191 | |
| Risk of bias | ||
| Bias | Authors' judgement | Support for judgement |
| Allocation concealment? | Unclear risk | B ‐ Unclear |
| Methods | 2‐ to 4‐week single‐blind placebo run‐in; inclusion criteria= sitting DBP 95‐114 mm Hg after run‐in; 8‐week double‐blind treatment | |
| Participants | All patients: n=165; | |
| Interventions | Benazepril 20 mg once daily; | |
| Outcomes | Mean change from baseline in trough sitting SBP/DBP; | |
| Notes | BP change reported; SD of change not reported, endpoint BP and SD not reported; imputed overall trial mean SD of change; BP data from abstract; BP measurement device not reported; Jadad score=2; funding source= Ciba‐Geigy Inc. | |
| Risk of bias | ||
| Bias | Authors' judgement | Support for judgement |
| Allocation concealment? | Unclear risk | B ‐ Unclear |
| Methods | 2‐week single‐blind placebo run‐in; inclusion criteria= sitting DBP 95‐114 mm Hg during run‐in; 4‐week double‐blind treatment | |
| Participants | Enalapril 10 mg: n=36(24 males,12 females); mean age=53 years; baseline sitting SBP=152.9 mm Hg, DBP=100.5 mm Hg; | |
| Interventions | Enalapril 10 mg once daily; | |
| Outcomes | Baseline adjusted mean change from baseline in trough sitting SBP/DBP using mercury sphygmomanometer; | |
| Notes | BP change and SE of change reported, endpoint BP and SD not reported; calculated SD of change from N and change SE; BP data from Table II, p. 328; Jadad score=3; funding source= ICI Americas Inc. | |
| Risk of bias | ||
| Bias | Authors' judgement | Support for judgement |
| Allocation concealment? | Unclear risk | B ‐ Unclear |
| Methods | 4‐week single‐blind placebo run‐in; inclusion criteria= DBP 95‐114 mm Hg after run‐in; 4‐week double‐bind treatment at fixed dose; after 4 weeks (week 0‐4), patients with inadequate BP response had their doses doubled during the second 4 weeks (week 4‐8); hydrochlorothiazide 12.5 mg (in a single morning dose) was added during final 4 weeks (week 8‐12) | |
| Participants | All patients: n=18(10 males,8 females); mean age=52(12) years; | |
| Interventions | Cilazapril 2.5 mg once daily; | |
| Outcomes | Trough sitting SBP/DBP using mercury sphygmomanometer; | |
| Notes | Used week 4 BP data only; BP change and SD of change not reported; endpoint BP and SD reported; imputed endpoint SD for SD of change; BP data from Table 1, p. 174; Jadad score=3; funding source= Hoffmann‐La Roche Ltd. | |
| Risk of bias | ||
| Bias | Authors' judgement | Support for judgement |
| Allocation concealment? | Unclear risk | B ‐ Unclear |
| Methods | Minimum 1‐week washout; 4‐week single‐blind placebo run‐in; inclusion criteria= sitting DBP 95‐114 mm Hg on 2 separate visits at end of placebo run‐in, with difference between visits of 10 mm Hg or less; 8‐week double‐blind treatment | |
| Participants | Moexipril 7.5 mg: n=16(12 males,4 females); mean age=56(12) years; baseline sitting SBP=161(12) mm Hg, DBP=103(4) mm Hg, HR=76(8) bpm; | |
| Interventions | Moexipril 7.5 mg once daily; | |
| Outcomes | Mean change from baseline in trough sitting SBP/DBP using mercury sphygmomanometer; | |
| Notes | BP change and SD of change reported, endpoint BP and SD not reported; change in BP data from Table II, p. 235; Jadad score=2; funding source= Schwarz Pharma | |
| Risk of bias | ||
| Bias | Authors' judgement | Support for judgement |
| Allocation concealment? | Unclear risk | B ‐ Unclear |
| Methods | 1‐ to 2‐week washout period for patients who were currently receiving antihypertensive therapy; 2‐ to 4‐week single‐blind placebo run‐in; inclusion criteria= sitting DBP 95‐115 mm Hg during 2 consecutive weeks of run‐in; also required that ambulatory awake DBP >/= 85 mm Hg; total 8‐week double‐blind treatment: 4‐week low‐dose treatment (week 0‐4), forced titration at week 4 to high‐dose, 4‐week high‐dose treatment (week 4‐8) | |
| Participants | Enalapril 10 mg: n=99(58 males,41 females); mean age=54(10) years; baseline SBP=145(16) mm Hg, DBP=93(8) mm Hg; baseline HR=72(10) bpm; | |
| Interventions | Enalapril 10 mg once daily; | |
| Outcomes | Mean change from baseline in trough sitting SBP/DBP using mercury sphygmomanometer; | |
| Notes | Used week 4 BP data only; BP change and SD of change reported, endpoint BP and SD not reported; BP data from Table IV, p. 663; Jadad score=3; funding source= not reported | |
| Risk of bias | ||
| Bias | Authors' judgement | Support for judgement |
| Allocation concealment? | Unclear risk | B ‐ Unclear |
| Methods | 4‐week single‐blind placebo washout; inclusion criteria= sitting DBP > 100 and < 115 mm Hg after washout; 8‐week double‐blind treatment, randomized to either placebo or quinapril 20 mg once daily for 4 weeks with optional titration to 40 mg once daily for subsequent 4 weeks based on diastolic response | |
| Participants | Quinapril: n=10; mean age=55(14.9) years; baseline SBP=161(22.2) mm Hg, DBP=105(5.6) mm Hg; | |
| Interventions | Quinapril 20 mg once daily; | |
| Outcomes | Mean change from baseline in sitting SBP/DBP | |
| Notes | Used week 4 BP data only; BP change and SD of change reported, endpoint BP and SD reported; time of dosing not reported; time of BP measurement not reported; SBP data from Table IA, p. 321, DBP data from Table IIA, p. 323; time of BP measurement not reported; BP measurement device not reported; Jadad score=3; funding source= not reported | |
| Risk of bias | ||
| Bias | Authors' judgement | Support for judgement |
| Allocation concealment? | Unclear risk | B ‐ Unclear |
| Methods | 4‐week single‐blind placebo run‐in; inclusion criteria= sitting DBP > 100 mm Hg after run‐in; 8‐week double‐blind treatment | |
| Participants | Cilazapril: n=94(67 males,27 females); mean age=52.4(8.1) years; baseline BP not reported; | |
| Interventions | Cilazapril 2.5 mg once daily; | |
| Outcomes | Mean change from baseline in trough sitting DBP using mercury sphygmomanometer; | |
| Notes | SBP change not reported; DBP change reported; SD of change not reported, endpoint SBP/DBP and SD not reported; imputed overall trial mean SD of change for DBP; baseline BP not reported; BP data from Figure 1, p. 119; Jadad score=3; funding source= not reported | |
| Risk of bias | ||
| Bias | Authors' judgement | Support for judgement |
| Allocation concealment? | Unclear risk | B ‐ Unclear |
| Methods | 4‐week washout; 2‐week single‐blind placebo run‐in; inclusion criteria= sitting DBP 95‐114 mm Hg at end of placebo run‐in; 4‐week double‐blind treatment | |
| Participants | Fosinopril 20 mg: n=12(8 males,4 females); mean age=51 years; baseline seated SBP=150.8(15.9) mm Hg, DBP=108.8(4.7) mm Hg; baseline HR=76.9(5.3) bpm; | |
| Interventions | Fosinopril 20 mg once daily; | |
| Outcomes | Sitting SBP/DBP using mercury sphygmomanometer; | |
| Notes | BP change and SD of change not reported, endpoint BP and SD reported; imputed endpoint SD for SD of change; time of BP measurement (peak and/or trough) not reported; BP data from Table 1, p. 254; Jadad score=3; funding source= Bristol‐Myers Squibb | |
| Risk of bias | ||
| Bias | Authors' judgement | Support for judgement |
| Allocation concealment? | Unclear risk | B ‐ Unclear |
BP=blood pressure, DBP=diastolic blood pressure; SBP=systolic blood pressure; SD=standard deviation; WDAE=withdrawal due to adverse effects; bpm=beats per minute
Characteristics of excluded studies [ordered by study ID]
Ir a:
| Study | Reason for exclusion |
| Crossover trial with no pre‐crossover data for first 4 weeks of treatment (ramipril 2.5 mg/day vs. placebo). | |
| Parallel group trial with 8‐week treatment period, forced titration at 4 weeks. Pre‐titration data not reported (enalapril 10 mg/day vs. losartan 50 mg/day vs. placebo). | |
| Crossover trial with no pre‐crossover data for first 4 weeks of treatment (fosinopril 20 mg/day vs. placebo). | |
| Balanced, two‐period, incomplete‐block design with 2 treatment periods of 3‐weeks duration. First treatment period data not reported (enalapril 2.5, 5, 10, 20, 40 vs. placebo). | |
| Parallel group trial with 6‐week treatment period, titration in non‐responders at 4 weeks. Pre‐titration data not reported (perindopril 4 mg/day vs. placebo). | |
| Parallel group trial with 8‐week treatment period. Number of patients per treatment arm not reported (quinapril 2.5, 10, 40 mg/day vs. placebo). | |
| Crossover trial with no pre‐crossover data for first 4 weeks of treatment (quniapril 20 mg/day vs. placebo). | |
| Crossover trial with no pre‐crossover data for first 4 weeks of treatment. 8‐week treatment periods but titration in non‐responders after 4 weeks treatment (quinapril 10 mg/day vs. placebo). | |
| Crossover trial with no pre‐crossover data for first 4 weeks of treatment (lisinopril 20 mg/day vs. placebo). | |
| Crossover trial with no pre‐crossover data for first 6 weeks of treatment (enalapril 20 mg/day vs. placebo). | |
| Crossover trial with no pre‐crossover data reported for first 6 weeks of treatment (enalapril 20 mg/day vs. losartan 50 mg/day vs. placebo). | |
| Crossover trial with no pre‐crossover data for first 4 weeks of treatment. 8‐week treatment periods but titration in non‐responders after 4 weeks treatment (captopril 50 mg/day vs. placebo). | |
| Parallel group trial with 8‐week treatment period, titration in non‐responders at 4 weeks. Pre‐titration data not reported (cilazapril 2.5 mg/day vs. placebo). | |
| Crossover trial with no pre‐crossover data reported for first 4 weeks of treatment (spirapril 6 mg/day vs. placebo). | |
| Crossover trial with no pre‐crossover data reported for first 3 weeks of treatment (spirapril 3, 6, 12, 24 mg/day vs. placebo). | |
| Crossover trial with no pre‐crossover data for first 4 weeks of treatment (quinapril 40 mg/day vs. placebo). | |
| Parallel group trial with 6‐week treatment period. BP data not extractable from figures (ramipril 2.5, 10, 20 mg/day vs. placebo). | |
| Parallel group trial with 12‐week treatment period, titration in non‐responders every 4 weeks. Pre‐titration data not reported (captopril 50 mg/day vs. placebo). | |
| Crossover trial with no pre‐crossover data reported for first 6 weeks of treatment (ramipril 5 mg/day vs. placebo). | |
| Parallel group trial with 4‐week treatment period. BP data for placebo group not reported at week 4 (ramipril 5 mg/day vs. ramipril 10 mg/day vs. placebo). | |
| Crossover trial with no pre‐crossover data reported for first 4 weeks of treatment (quinapril 40 mg/day vs. placebo). | |
| Parallel group trial with 8‐week treatment period. BP data for placebo group not reported (lisinopril 20 mg/day vs. telmisartan 80 mg/day vs. placebo). | |
| Crossover trial with no pre‐crossover data reported for first 4 weeks of treatment (captopril 100 mg/day vs. placebo). | |
| Parallel group trial with 8‐week treatment period, titration in non‐responders at 4 weeks. Pre‐titration data not reported (captopril 50 mg/day vs. placebo). | |
| Crossover trial with no pre‐crossover data reported for first 6 weeks of treatment (perindopril 8 mg/day vs. placebo). | |
| Parallel group trial with 4‐week treatment period. Only maximum BP reduction is reported (perindopril 2, 4, 8 mg/day vs. placebo). | |
| Parallel group trial with 12‐week treatment period, titration in non‐responders at 4 weeks. Pre‐titration data not reported (imidapril 5 mg/day vs. placebo). | |
| Crossover trial with no pre‐crossover data for first 4 weeks of treatment. 8‐week treatment periods but titration in non‐responders after 4 weeks treatment (enalapril 20 mg/day vs. perindopril 4 mg/day vs. placebo). | |
| Crossover trial with no pre‐crossover data reported for first 4 weeks of treatment (spirapril 24 mg/day vs. placebo). | |
| Crossover trial with no pre‐crossover data reported for first 4 weeks of treatment (trandolapril 2 mg/day vs. placebo). | |
| Crossover trial with no pre‐crossover data reported for first 6 weeks of treatment (enalapril 20 mg/day vs. losartan 50 mg/day vs. placebo). | |
| Parallel group trial with 8‐week treatment period, titration in non‐responders at 4 weeks. Pre‐titration data not reported (perindopril 4 mg/day vs. placebo). | |
| Crossover trial with no pre‐crossover data reported for first 3 weeks of treatment (trandolapril 2 mg/day vs. placebo). | |
| Parallel group trial with 12‐week treatment period, titration in non‐responders every 4 weeks. Pre‐titration data not reported (lisinopril 10 mg/day vs. placebo). | |
| Crossover trial with no baseline data and no pre‐crossover data reported for first 4 weeks of captopril 100 mg/day vs. placebo. Only mean arterial blood pressure values given. | |
| Crossover trial with no pre‐crossover data reported for first 4 weeks of treatment (captopril 50, 100 mg/day vs. placebo). | |
| Crossover trial with no pre‐crossover data reported for first 4 weeks of treatment (enalapril 10, 20, 40 mg/day vs. placebo). | |
| Parallel group trial with 8‐week treatment period, titration in non‐responders at 2 or 4 weeks. Pre‐titration data not reported (lisinopril 20 mg/day vs. placebo). | |
| Parallel group trial with 6‐month treatment period. Additional BP lowering drugs added to enalapril 20 mg in non‐responders at 4 weeks. Data during first 4 weeks not reported. | |
| Parallel group trial with 6‐week treatment period. Number of patients per treatment arm not reported (ramipril 2.5, 5, 10 mg/day vs. placebo). | |
| Crossover trial with no pre‐crossover data reported for first 8 weeks of treatment (lisinopril 20 mg/day vs. placebo). | |
| Crossover trial with no pre‐crossover data reported for first 4 weeks of treatment (lisinopril 20 mg/day vs. placebo). | |
| Crossover trial with no pre‐crossover data reported for first 8 weeks of treatment (captopril 100 mg/day vs. placebo). | |
| Parallel group trial with 12‐week treatment period, titration in non‐responders every 4 weeks. Pre‐titration data not reported (enalapril 10 mg/day vs. placebo). | |
| Crossover trial with no pre‐crossover data reported for first 4 weeks of treatment (enalapril 20 mg/day vs. placebo). | |
| Crossover trial with no pre‐crossover data reported for first 4 weeks of treatment (enalapril 20 mg/day vs. placebo). | |
| Parallel group trial with 8‐week treatment. Highly suspicious data (enalapril 20 mg/day vs. benazepril 10 mg/day vs. placebo). | |
| Parallel group trial with 8‐week treatment period, titration in non‐responders at 4 weeks. Pre‐titration data not reported (enalapril 10 mg/day vs. candesartan 4 mg/day vs. placebo). |
Data and analyses
| Outcome or subgroup title | No. of studies | No. of participants | Statistical method | Effect size |
| 1 Change in trough SBP Show forest plot | 7 | Mean Difference (IV, Fixed, 95% CI) | Subtotals only | |
| Analysis 1.1  Comparison 1 Benazepril vs Placebo, Outcome 1 Change in trough SBP. | ||||
| 1.1 2 mg | 1 | 36 | Mean Difference (IV, Fixed, 95% CI) | 0.20 [‐11.87, 12.27] |
| 1.2 4 mg | 1 | 71 | Mean Difference (IV, Fixed, 95% CI) | ‐5.5 [‐12.17, 1.17] |
| 1.3 5 mg | 2 | 60 | Mean Difference (IV, Fixed, 95% CI) | ‐6.52 [‐16.09, 3.06] |
| 1.4 10 mg | 3 | 284 | Mean Difference (IV, Fixed, 95% CI) | ‐2.68 [‐5.98, 0.61] |
| 1.5 20 mg | 6 | 422 | Mean Difference (IV, Fixed, 95% CI) | ‐8.30 [‐11.14, ‐5.46] |
| 1.6 40 mg (Max Dose) | 2 | 74 | Mean Difference (IV, Fixed, 95% CI) | ‐8.68 [‐14.00, ‐1.35] |
| 1.7 80 mg | 1 | 50 | Mean Difference (IV, Fixed, 95% CI) | ‐11.40 [‐19.95, ‐2.85] |
| 2 Change in trough DBP Show forest plot | 7 | Mean Difference (IV, Fixed, 95% CI) | Subtotals only | |
| Analysis 1.2  Comparison 1 Benazepril vs Placebo, Outcome 2 Change in trough DBP. | ||||
| 2.1 2 mg | 1 | 36 | Mean Difference (IV, Fixed, 95% CI) | 1.1 [‐6.54, 8.74] |
| 2.2 4 mg | 1 | 71 | Mean Difference (IV, Fixed, 95% CI) | ‐4.10 [‐7.95, ‐0.25] |
| 2.3 5 mg | 2 | 60 | Mean Difference (IV, Fixed, 95% CI) | ‐2.04 [‐8.60, 4.53] |
| 2.4 10 mg | 3 | 283 | Mean Difference (IV, Fixed, 95% CI) | ‐0.72 [‐2.67, 1.22] |
| 2.5 20 mg | 6 | 422 | Mean Difference (IV, Fixed, 95% CI) | ‐4.53 [‐6.14, ‐2.93] |
| 2.6 40 mg (Max Dose) | 2 | 74 | Mean Difference (IV, Fixed, 95% CI) | ‐4.73 [‐9.15, ‐0.31] |
| 2.7 80 mg | 1 | 51 | Mean Difference (IV, Fixed, 95% CI) | ‐6.80 [‐11.60, 0.00] |
| Outcome or subgroup title | No. of studies | No. of participants | Statistical method | Effect size |
| 1 Change in SBP Show forest plot | 5 | Mean Difference (IV, Fixed, 95% CI) | Subtotals only | |
| Analysis 2.1  Comparison 2 Captopril vs Placebo, Outcome 1 Change in SBP. | ||||
| 1.1 37.5 mg | 1 | 111 | Mean Difference (IV, Fixed, 95% CI) | ‐8.6 [‐14.95, ‐2.25] |
| 1.2 50 mg | 3 | 324 | Mean Difference (IV, Fixed, 95% CI) | ‐8.25 [‐11.34, ‐5.16] |
| 1.3 75 mg | 2 | 124 | Mean Difference (IV, Fixed, 95% CI) | ‐9.16 [‐15.09, ‐3.23] |
| 1.4 100 mg | 1 | 96 | Mean Difference (IV, Fixed, 95% CI) | ‐12.0 [‐18.17, ‐5.83] |
| 1.5 150 mg (Max Dose) | 1 | 117 | Mean Difference (IV, Fixed, 95% CI) | ‐12.0 [‐18.06, ‐5.94] |
| 1.6 200 mg | 1 | 94 | Mean Difference (IV, Fixed, 95% CI) | ‐12.20 [‐18.32, ‐6.08] |
| 2 Change in DBP Show forest plot | 6 | Mean Difference (IV, Fixed, 95% CI) | Subtotals only | |
| Analysis 2.2  Comparison 2 Captopril vs Placebo, Outcome 2 Change in DBP. | ||||
| 2.1 37.5 mg | 1 | 111 | Mean Difference (IV, Fixed, 95% CI) | ‐5.40 [‐8.74, ‐2.06] |
| 2.2 50 mg | 4 | 500 | Mean Difference (IV, Fixed, 95% CI) | ‐4.58 [‐6.02, ‐3.15] |
| 2.3 75 mg | 2 | 124 | Mean Difference (IV, Fixed, 95% CI) | ‐5.92 [‐9.16, ‐2.68] |
| 2.4 100 mg | 1 | 97 | Mean Difference (IV, Fixed, 95% CI) | ‐6.4 [‐9.91, ‐2.89] |
| 2.5 150 mg (Max Dose) | 1 | 117 | Mean Difference (IV, Fixed, 95% CI) | ‐7.3 [‐10.43, ‐4.17] |
| 2.6 200 mg | 1 | 94 | Mean Difference (IV, Fixed, 95% CI) | ‐6.70 [‐10.23, ‐3.17] |
| Outcome or subgroup title | No. of studies | No. of participants | Statistical method | Effect size |
| 1 Change in trough SBP Show forest plot | 9 | Mean Difference (IV, Fixed, 95% CI) | Subtotals only | |
| Analysis 3.1  Comparison 3 Cilazapril vs Placebo, Outcome 1 Change in trough SBP. | ||||
| 1.1 2.5 mg | 9 | 361 | Mean Difference (IV, Fixed, 95% CI) | ‐5.16 [‐8.32, 0.00] |
| 1.2 5 mg | 5 | 277 | Mean Difference (IV, Fixed, 95% CI) | ‐5.75 [‐9.38, ‐2.12] |
| 1.3 10 mg (Max Dose) | 1 | 67 | Mean Difference (IV, Fixed, 95% CI) | ‐7.0 [‐14.07, 0.07] |
| 2 Change in trough DBP Show forest plot | 14 | Mean Difference (IV, Fixed, 95% CI) | Subtotals only | |
| Analysis 3.2  Comparison 3 Cilazapril vs Placebo, Outcome 2 Change in trough DBP. | ||||
| 2.1 0.5 mg | 1 | 129 | Mean Difference (IV, Fixed, 95% CI) | ‐0.5 [‐3.45, 2.45] |
| 2.2 1 mg | 1 | 56 | Mean Difference (IV, Fixed, 95% CI) | 1.1 [‐3.66, 5.86] |
| 2.3 2.5 mg | 13 | 558 | Mean Difference (IV, Fixed, 95% CI) | ‐3.32 [‐4.70, ‐1.94] |
| 2.4 5 mg | 9 | 569 | Mean Difference (IV, Fixed, 95% CI) | ‐3.49 [‐4.87, ‐2.11] |
| 2.5 10 mg (Max Dose) | 2 | 190 | Mean Difference (IV, Fixed, 95% CI) | ‐4.06 [‐6.44, ‐1.67] |
| Outcome or subgroup title | No. of studies | No. of participants | Statistical method | Effect size |
| 1 Change in trough SBP Show forest plot | 17 | Mean Difference (IV, Fixed, 95% CI) | Subtotals only | |
| Analysis 4.1  Comparison 4 Enalapril vs Placebo, Outcome 1 Change in trough SBP. | ||||
| 1.1 5 mg | 4 | 552 | Mean Difference (IV, Fixed, 95% CI) | ‐5.56 [‐7.95, ‐3.18] |
| 1.2 10 mg | 8 | 1122 | Mean Difference (IV, Fixed, 95% CI) | ‐5.42 [‐5.00, ‐3.84] |
| 1.3 20 mg | 8 | 911 | Mean Difference (IV, Fixed, 95% CI) | ‐9.61 [‐11.35, ‐7.86] |
| 2 Change in trough DBP Show forest plot | 19 | Mean Difference (IV, Fixed, 95% CI) | Subtotals only | |
| Analysis 4.2  Comparison 4 Enalapril vs Placebo, Outcome 2 Change in trough DBP. | ||||
| 2.1 5 mg | 5 | 702 | Mean Difference (IV, Fixed, 95% CI) | ‐2.46 [‐3.67, ‐1.25] |
| 2.2 10 mg | 8 | 1122 | Mean Difference (IV, Fixed, 95% CI) | ‐3.10 [‐3.99, ‐2.20] |
| 2.3 20 mg | 9 | 984 | Mean Difference (IV, Fixed, 95% CI) | ‐5.34 [‐6.29, ‐4.38] |
| Outcome or subgroup title | No. of studies | No. of participants | Statistical method | Effect size |
| 1 Change in trough SBP Show forest plot | 6 | Mean Difference (IV, Fixed, 95% CI) | Subtotals only | |
| Analysis 5.1  Comparison 5 Fosinopril vs Placebo, Outcome 1 Change in trough SBP. | ||||
| 1.1 2.5 mg | 1 | 38 | Mean Difference (IV, Fixed, 95% CI) | ‐2.9 [‐13.01, 7.21] |
| 1.2 5 mg | 1 | 94 | Mean Difference (IV, Fixed, 95% CI) | ‐3.70 [‐10.37, 2.97] |
| 1.3 10 mg | 3 | 151 | Mean Difference (IV, Fixed, 95% CI) | ‐3.86 [‐9.03, 1.30] |
| 1.4 20 mg | 5 | 208 | Mean Difference (IV, Fixed, 95% CI) | ‐9.26 [‐13.72, ‐4.79] |
| 1.5 40 mg (Max Dose) | 3 | 158 | Mean Difference (IV, Fixed, 95% CI) | ‐7.81 [‐12.91, ‐2.72] |
| 2 Change in trough DBP Show forest plot | 6 | Mean Difference (IV, Fixed, 95% CI) | Subtotals only | |
| Analysis 5.2  Comparison 5 Fosinopril vs Placebo, Outcome 2 Change in trough DBP. | ||||
| 2.1 2.5 mg | 1 | 39 | Mean Difference (IV, Fixed, 95% CI) | ‐0.70 [‐6.31, 4.91] |
| 2.2 5 mg | 1 | 93 | Mean Difference (IV, Fixed, 95% CI) | ‐3.20 [‐7.12, 0.72] |
| 2.3 10 mg | 3 | 151 | Mean Difference (IV, Fixed, 95% CI) | ‐3.45 [‐6.42, ‐0.47] |
| 2.4 20 mg | 5 | 209 | Mean Difference (IV, Fixed, 95% CI) | ‐7.79 [‐10.12, ‐5.46] |
| 2.5 40 mg (Max Dose) | 3 | 157 | Mean Difference (IV, Fixed, 95% CI) | ‐4.73 [‐7.69, ‐1.76] |
| Outcome or subgroup title | No. of studies | No. of participants | Statistical method | Effect size |
| 1 Change in trough SBP Show forest plot | 1 | Mean Difference (IV, Fixed, 95% CI) | Subtotals only | |
| Analysis 6.1  Comparison 6 Imidapril vs Placebo, Outcome 1 Change in trough SBP. | ||||
| 1.1 5 mg | 1 | 41 | Mean Difference (IV, Fixed, 95% CI) | ‐4.90 [‐15.96, 6.16] |
| 1.2 10 mg | 1 | 40 | Mean Difference (IV, Fixed, 95% CI) | ‐8.90 [‐20.02, 2.22] |
| 1.3 20 mg (Max Dose) | 1 | 40 | Mean Difference (IV, Fixed, 95% CI) | ‐12.90 [‐24.22, ‐1.58] |
| 1.4 40 mg | 1 | 41 | Mean Difference (IV, Fixed, 95% CI) | ‐10.60 [‐21.36, 0.16] |
| 2 Change in trough DBP Show forest plot | 1 | Mean Difference (IV, Fixed, 95% CI) | Subtotals only | |
| Analysis 6.2  Comparison 6 Imidapril vs Placebo, Outcome 2 Change in trough DBP. | ||||
| 2.1 5 mg | 1 | 42 | Mean Difference (IV, Fixed, 95% CI) | ‐3.2 [‐10.28, 3.88] |
| 2.2 10 mg | 1 | 39 | Mean Difference (IV, Fixed, 95% CI) | ‐7.40 [‐15.16, 0.36] |
| 2.3 20 mg (Max Dose) | 1 | 40 | Mean Difference (IV, Fixed, 95% CI) | ‐6.3 [‐13.60, 1.00] |
| 2.4 40 mg | 1 | 41 | Mean Difference (IV, Fixed, 95% CI) | ‐6.50 [‐13.89, 0.89] |
| Outcome or subgroup title | No. of studies | No. of participants | Statistical method | Effect size |
| 1 Change in trough SBP Show forest plot | 5 | Mean Difference (IV, Fixed, 95% CI) | Subtotals only | |
| Analysis 7.1  Comparison 7 Lisinopril vs Placebo, Outcome 1 Change in trough SBP. | ||||
| 1.1 1.25 mg | 1 | 46 | Mean Difference (IV, Fixed, 95% CI) | 3.2 [‐5.00, 13.40] |
| 1.2 5 mg | 1 | 47 | Mean Difference (IV, Fixed, 95% CI) | ‐2.0 [‐13.22, 9.22] |
| 1.3 10 mg | 4 | 648 | Mean Difference (IV, Fixed, 95% CI) | ‐7.75 [‐9.98, ‐5.51] |
| 1.4 20 mg | 1 | 50 | Mean Difference (IV, Fixed, 95% CI) | ‐7.80 [‐18.67, 3.07] |
| 1.5 80 mg (Max Dose) | 1 | 50 | Mean Difference (IV, Fixed, 95% CI) | ‐13.8 [‐24.46, ‐3.14] |
| 2 Change in trough DBP Show forest plot | 5 | Mean Difference (IV, Fixed, 95% CI) | Subtotals only | |
| Analysis 7.2  Comparison 7 Lisinopril vs Placebo, Outcome 2 Change in trough DBP. | ||||
| 2.1 1.25 mg | 1 | 46 | Mean Difference (IV, Fixed, 95% CI) | 2.8 [‐2.34, 7.94] |
| 2.2 5 mg | 1 | 47 | Mean Difference (IV, Fixed, 95% CI) | 0.0 [‐5.32, 5.32] |
| 2.3 10 mg | 4 | 648 | Mean Difference (IV, Fixed, 95% CI) | ‐4.71 [‐5.92, ‐3.50] |
| 2.4 20 mg | 1 | 51 | Mean Difference (IV, Fixed, 95% CI) | ‐4.6 [‐10.17, 0.97] |
| 2.5 80 mg (Max Dose) | 1 | 49 | Mean Difference (IV, Fixed, 95% CI) | ‐6.00 [‐11.72, ‐0.28] |
| Outcome or subgroup title | No. of studies | No. of participants | Statistical method | Effect size |
| 1 Change in trough SBP Show forest plot | 4 | Mean Difference (IV, Fixed, 95% CI) | Subtotals only | |
| Analysis 8.1  Comparison 8 Moexipril vs Placebo, Outcome 1 Change in trough SBP. | ||||
| 1.1 7.5 mg | 3 | 168 | Mean Difference (IV, Fixed, 95% CI) | ‐1.83 [‐6.71, 3.05] |
| 1.2 15 mg | 4 | 265 | Mean Difference (IV, Fixed, 95% CI) | ‐8.45 [‐11.99, ‐4.91] |
| 2 Change in trough DBP Show forest plot | 4 | Mean Difference (IV, Fixed, 95% CI) | Subtotals only | |
| Analysis 8.2  Comparison 8 Moexipril vs Placebo, Outcome 2 Change in trough DBP. | ||||
| 2.1 7.5 mg | 3 | 167 | Mean Difference (IV, Fixed, 95% CI) | ‐2.23 [‐4.63, 0.16] |
| 2.2 15 mg | 4 | 266 | Mean Difference (IV, Fixed, 95% CI) | ‐4.38 [‐6.29, ‐2.46] |
| Outcome or subgroup title | No. of studies | No. of participants | Statistical method | Effect size |
| 1 Change in trough SBP Show forest plot | 6 | Mean Difference (IV, Fixed, 95% CI) | Subtotals only | |
| Analysis 9.1  Comparison 9 Perindopril vs Placebo, Outcome 1 Change in trough SBP. | ||||
| 1.1 2 mg | 2 | 85 | Mean Difference (IV, Fixed, 95% CI) | ‐3.24 [‐13.20, 6.72] |
| 1.2 4 mg | 6 | 820 | Mean Difference (IV, Fixed, 95% CI) | ‐6.76 [‐9.41, ‐4.12] |
| 1.3 8 mg (Max Dose) | 2 | 82 | Mean Difference (IV, Fixed, 95% CI) | ‐9.81 [‐19.32, ‐0.31] |
| 1.4 16 mg | 1 | 67 | Mean Difference (IV, Fixed, 95% CI) | ‐8.9 [‐19.65, 1.85] |
| 2 Change in trough DBP Show forest plot | 6 | Mean Difference (IV, Fixed, 95% CI) | Subtotals only | |
| Analysis 9.2  Comparison 9 Perindopril vs Placebo, Outcome 2 Change in trough DBP. | ||||
| 2.1 2 mg | 2 | 85 | Mean Difference (IV, Fixed, 95% CI) | ‐2.10 [‐6.40, 2.20] |
| 2.2 4 mg | 6 | 820 | Mean Difference (IV, Fixed, 95% CI) | ‐4.91 [‐6.21, ‐3.61] |
| 2.3 8 mg (Max Dose) | 2 | 82 | Mean Difference (IV, Fixed, 95% CI) | ‐5.81 [‐10.11, ‐1.52] |
| 2.4 16 mg | 1 | 67 | Mean Difference (IV, Fixed, 95% CI) | ‐5.50 [‐10.09, ‐0.91] |
| Outcome or subgroup title | No. of studies | No. of participants | Statistical method | Effect size |
| 1 Change in trough SBP Show forest plot | 3 | Mean Difference (IV, Fixed, 95% CI) | Subtotals only | |
| Analysis 10.1  Comparison 10 Quinapril vs Placebo, Outcome 1 Change in trough SBP. | ||||
| 1.1 20 mg | 3 | 196 | Mean Difference (IV, Fixed, 95% CI) | ‐5.87 [‐9.75, ‐1.99] |
| 2 Change in trough DBP Show forest plot | 3 | Mean Difference (IV, Fixed, 95% CI) | Subtotals only | |
| Analysis 10.2  Comparison 10 Quinapril vs Placebo, Outcome 2 Change in trough DBP. | ||||
| 2.1 20 mg | 3 | 196 | Mean Difference (IV, Fixed, 95% CI) | ‐3.26 [‐5.85, ‐0.68] |
| Outcome or subgroup title | No. of studies | No. of participants | Statistical method | Effect size |
| 1 Change in trough SBP Show forest plot | 6 | Mean Difference (IV, Fixed, 95% CI) | Subtotals only | |
| Analysis 11.1  Comparison 11 Ramipril vs Placebo, Outcome 1 Change in trough SBP. | ||||
| 1.1 1.25 mg | 2 | 98 | Mean Difference (IV, Fixed, 95% CI) | 4.06 [‐1.97, 10.08] |
| 1.2 2.5 mg | 4 | 197 | Mean Difference (IV, Fixed, 95% CI) | ‐4.38 [‐9.71, 0.95] |
| 1.3 5 mg | 4 | 195 | Mean Difference (IV, Fixed, 95% CI) | ‐7.47 [‐12.76, ‐2.19] |
| 1.4 10 mg | 4 | 257 | Mean Difference (IV, Fixed, 95% CI) | ‐5.74 [‐9.33, ‐2.16] |
| 2 Change in trough DBP Show forest plot | 6 | Mean Difference (IV, Fixed, 95% CI) | Subtotals only | |
| Analysis 11.2  Comparison 11 Ramipril vs Placebo, Outcome 2 Change in trough DBP. | ||||
| 2.1 1.25 mg | 2 | 97 | Mean Difference (IV, Fixed, 95% CI) | 1.78 [‐1.83, 5.39] |
| 2.2 2.5 mg | 4 | 195 | Mean Difference (IV, Fixed, 95% CI) | ‐2.39 [‐5.18, 0.39] |
| 2.3 5 mg | 4 | 197 | Mean Difference (IV, Fixed, 95% CI) | ‐3.70 [‐6.38, ‐1.02] |
| 2.4 10 mg | 4 | 258 | Mean Difference (IV, Fixed, 95% CI) | ‐4.42 [‐6.54, ‐2.30] |
| Outcome or subgroup title | No. of studies | No. of participants | Statistical method | Effect size |
| 1 Change in trough SBP Show forest plot | 3 | Mean Difference (IV, Fixed, 95% CI) | Subtotals only | |
| Analysis 12.1  Comparison 12 Spirapril vs Placebo, Outcome 1 Change in trough SBP. | ||||
| 1.1 3 mg | 2 | 130 | Mean Difference (IV, Fixed, 95% CI) | ‐4.09 [‐10.47, 2.29] |
| 1.2 6 mg | 3 | 210 | Mean Difference (IV, Fixed, 95% CI) | ‐7.66 [‐11.93, ‐3.40] |
| 1.3 12 mg (Max Dose) | 2 | 146 | Mean Difference (IV, Fixed, 95% CI) | ‐8.46 [‐13.27, ‐3.66] |
| 1.4 24 mg | 2 | 139 | Mean Difference (IV, Fixed, 95% CI) | ‐9.67 [‐14.39, ‐4.95] |
| 2 Change in trough DBP Show forest plot | 4 | Mean Difference (IV, Fixed, 95% CI) | Subtotals only | |
| Analysis 12.2  Comparison 12 Spirapril vs Placebo, Outcome 2 Change in trough DBP. | ||||
| 2.1 3 mg | 2 | 130 | Mean Difference (IV, Fixed, 95% CI) | ‐3.91 [‐7.52, ‐0.29] |
| 2.2 6 mg | 4 | 359 | Mean Difference (IV, Fixed, 95% CI) | ‐6.52 [‐8.42, ‐4.62] |
| 2.3 12 mg (Max Dose) | 2 | 146 | Mean Difference (IV, Fixed, 95% CI) | ‐6.20 [‐9.20, ‐3.20] |
| 2.4 24 mg | 2 | 140 | Mean Difference (IV, Fixed, 95% CI) | ‐4.84 [‐7.86, ‐1.83] |
| Outcome or subgroup title | No. of studies | No. of participants | Statistical method | Effect size |
| 1 Change in trough SBP Show forest plot | 1 | Mean Difference (IV, Fixed, 95% CI) | Subtotals only | |
| Analysis 13.1  Comparison 13 Temocapril vs Placebo, Outcome 1 Change in trough SBP. | ||||
| 1.1 20 mg | 1 | 30 | Mean Difference (IV, Fixed, 95% CI) | ‐10.0 [‐23.87, 3.87] |
| 2 Change in trough DBP Show forest plot | 1 | Mean Difference (IV, Fixed, 95% CI) | Subtotals only | |
| Analysis 13.2  Comparison 13 Temocapril vs Placebo, Outcome 2 Change in trough DBP. | ||||
| 2.1 20 mg | 1 | 30 | Mean Difference (IV, Fixed, 95% CI) | ‐5.0 [‐13.34, 3.34] |
| Outcome or subgroup title | No. of studies | No. of participants | Statistical method | Effect size |
| 1 Change in trough SBP Show forest plot | 10 | Mean Difference (IV, Fixed, 95% CI) | Subtotals only | |
| Analysis 14.1  Comparison 14 Trandolapril vs Placebo, Outcome 1 Change in trough SBP. | ||||
| 1.1 0.25 mg | 1 | 35 | Mean Difference (IV, Fixed, 95% CI) | ‐2.7 [‐13.26, 7.86] |
| 1.2 0.5 mg | 4 | 185 | Mean Difference (IV, Fixed, 95% CI) | ‐3.33 [‐6.00, 1.33] |
| 1.3 1 mg | 4 | 294 | Mean Difference (IV, Fixed, 95% CI) | ‐8.45 [‐11.84, ‐5.06] |
| 1.4 2 mg | 7 | 636 | Mean Difference (IV, Fixed, 95% CI) | ‐6.21 [‐8.76, ‐3.66] |
| 1.5 4 mg (Max Dose) | 3 | 430 | Mean Difference (IV, Fixed, 95% CI) | ‐8.15 [‐10.82, ‐5.49] |
| 1.6 8 mg | 2 | 111 | Mean Difference (IV, Fixed, 95% CI) | ‐5.74 [‐12.52, 1.05] |
| 1.7 12 mg | 1 | 49 | Mean Difference (IV, Fixed, 95% CI) | ‐5.7 [‐16.60, 5.20] |
| 1.8 16 mg | 1 | 48 | Mean Difference (IV, Fixed, 95% CI) | ‐7.10 [‐17.36, 3.16] |
| 2 Change in trough DBP Show forest plot | 10 | Mean Difference (IV, Fixed, 95% CI) | Subtotals only | |
| Analysis 14.2  Comparison 14 Trandolapril vs Placebo, Outcome 2 Change in trough DBP. | ||||
| 2.1 0.25 mg | 1 | 35 | Mean Difference (IV, Fixed, 95% CI) | 0.6 [‐4.46, 5.66] |
| 2.2 0.5 mg | 4 | 184 | Mean Difference (IV, Fixed, 95% CI) | ‐2.33 [‐4.90, 0.24] |
| 2.3 1 mg | 4 | 294 | Mean Difference (IV, Fixed, 95% CI) | ‐4.07 [‐5.89, ‐2.25] |
| 2.4 2 mg | 7 | 637 | Mean Difference (IV, Fixed, 95% CI) | ‐4.24 [‐5.55, ‐2.94] |
| 2.5 4 mg (Max Dose) | 3 | 431 | Mean Difference (IV, Fixed, 95% CI) | ‐4.62 [‐6.10, ‐3.13] |
| 2.6 8 mg | 2 | 110 | Mean Difference (IV, Fixed, 95% CI) | ‐4.41 [‐7.82, ‐1.01] |
| 2.7 12 mg | 1 | 49 | Mean Difference (IV, Fixed, 95% CI) | ‐6.2 [‐11.78, ‐0.62] |
| 2.8 16 mg | 1 | 48 | Mean Difference (IV, Fixed, 95% CI) | ‐6.2 [‐11.38, ‐1.02] |
| Outcome or subgroup title | No. of studies | No. of participants | Statistical method | Effect size |
| 1 Change in trough SBP Show forest plot | 4 | 262 | Mean Difference (IV, Fixed, 95% CI) | ‐0.16 [‐3.78, 3.46] |
| Analysis 15.1  Comparison 15 1/16 Max Dose vs Placebo, Outcome 1 Change in trough SBP. | ||||
| 1.1 Fosinopril 2.5 mg | 1 | 58 | Mean Difference (IV, Fixed, 95% CI) | ‐2.9 [‐9.93, 4.13] |
| 1.2 Lisinopril 5 mg | 1 | 76 | Mean Difference (IV, Fixed, 95% CI) | ‐2.0 [‐9.79, 5.79] |
| 1.3 Ramipril 1.25 mg | 2 | 128 | Mean Difference (IV, Fixed, 95% CI) | 2.01 [‐3.02, 7.05] |
| 2 Change in trough DBP Show forest plot | 4 | 262 | Mean Difference (IV, Fixed, 95% CI) | 0.15 [‐1.86, 2.16] |
| Analysis 15.2  Comparison 15 1/16 Max Dose vs Placebo, Outcome 2 Change in trough DBP. | ||||
| 2.1 Fosinopril 2.5 mg | 1 | 58 | Mean Difference (IV, Fixed, 95% CI) | ‐0.70 [‐4.77, 3.37] |
| 2.2 Lisinopril 5 mg | 1 | 76 | Mean Difference (IV, Fixed, 95% CI) | 0.0 [‐3.68, 3.68] |
| 2.3 Ramipril 1.25 mg | 2 | 128 | Mean Difference (IV, Fixed, 95% CI) | 0.70 [‐2.28, 3.67] |
| Outcome or subgroup title | No. of studies | No. of participants | Statistical method | Effect size |
| 1 Change in trough SBP Show forest plot | 18 | 2025 | Mean Difference (IV, Fixed, 95% CI) | ‐5.70 [‐6.95, ‐4.45] |
| Analysis 16.1  Comparison 16 1/8 Max Dose vs Placebo, Outcome 1 Change in trough SBP. | ||||
| 1.1 Benazepril 5 mg | 2 | 91 | Mean Difference (IV, Fixed, 95% CI) | ‐6.39 [‐12.32, ‐0.47] |
| 1.2 Enalapril 5 mg | 4 | 607 | Mean Difference (IV, Fixed, 95% CI) | ‐5.12 [‐7.33, ‐2.92] |
| 1.3 Fosinopril 5 mg | 1 | 151 | Mean Difference (IV, Fixed, 95% CI) | ‐3.7 [‐8.06, 0.66] |
| 1.4 Lisinopril 10 mg | 4 | 648 | Mean Difference (IV, Fixed, 95% CI) | ‐7.75 [‐9.98, ‐5.51] |
| 1.5 Ramipril 2.5 mg | 4 | 292 | Mean Difference (IV, Fixed, 95% CI) | ‐4.52 [‐8.05, ‐0.98] |
| 1.6 Trandolapril 0.5 mg | 3 | 236 | Mean Difference (IV, Fixed, 95% CI) | ‐4.19 [‐7.91, ‐0.46] |
| 2 Change in trough DBP Show forest plot | 19 | 2176 | Mean Difference (IV, Fixed, 95% CI) | ‐3.19 [‐3.88, ‐2.51] |
| Analysis 16.2  Comparison 16 1/8 Max Dose vs Placebo, Outcome 2 Change in trough DBP. | ||||
| 2.1 Benazepril 5 mg | 2 | 91 | Mean Difference (IV, Fixed, 95% CI) | ‐1.92 [‐5.89, 2.05] |
| 2.2 Enalapril 5 mg | 5 | 758 | Mean Difference (IV, Fixed, 95% CI) | ‐2.37 [‐3.52, ‐1.23] |
| 2.3 Fosinopril 5 mg | 1 | 151 | Mean Difference (IV, Fixed, 95% CI) | ‐3.20 [‐5.72, ‐0.68] |
| 2.4 Lisinopril 10 mg | 4 | 648 | Mean Difference (IV, Fixed, 95% CI) | ‐4.71 [‐5.92, ‐3.50] |
| 2.5 Ramipril 2.5 mg | 4 | 292 | Mean Difference (IV, Fixed, 95% CI) | ‐2.50 [‐4.50, ‐0.51] |
| 2.6 Trandolapril 0.5 mg | 3 | 236 | Mean Difference (IV, Fixed, 95% CI) | ‐2.46 [‐4.59, ‐0.33] |
| Outcome or subgroup title | No. of studies | No. of participants | Statistical method | Effect size |
| 1 Change in trough SBP Show forest plot | 40 | 3523 | Mean Difference (IV, Fixed, 95% CI) | ‐5.14 [‐6.05, ‐4.22] |
| Analysis 17.1  Comparison 17 1/4 Max Dose vs Placebo, Outcome 1 Change in trough SBP. | ||||
| 1.1 Benazepril 10 mg | 3 | 314 | Mean Difference (IV, Fixed, 95% CI) | ‐2.88 [‐5.92, 0.15] |
| 1.2 Cilazapril 2.5 mg | 9 | 462 | Mean Difference (IV, Fixed, 95% CI) | ‐4.76 [‐7.34, ‐2.18] |
| 1.3 Enalapril 10 mg | 8 | 1138 | Mean Difference (IV, Fixed, 95% CI) | ‐5.40 [‐6.93, ‐3.87] |
| 1.4 Fosinopril 10 mg | 3 | 239 | Mean Difference (IV, Fixed, 95% CI) | ‐3.93 [‐7.39, ‐0.46] |
| 1.5 Imidapril 5 mg | 1 | 68 | Mean Difference (IV, Fixed, 95% CI) | ‐4.90 [‐11.31, 1.51] |
| 1.6 Lisinopril 20 mg | 1 | 80 | Mean Difference (IV, Fixed, 95% CI) | ‐7.8 [‐14.38, ‐1.22] |
| 1.7 Moexipril 7.5 mg | 3 | 223 | Mean Difference (IV, Fixed, 95% CI) | ‐1.86 [‐5.86, 2.14] |
| 1.8 Perindopril 2 mg | 2 | 134 | Mean Difference (IV, Fixed, 95% CI) | ‐3.02 [‐9.36, 3.31] |
| 1.9 Ramipril 5 mg | 4 | 291 | Mean Difference (IV, Fixed, 95% CI) | ‐7.19 [‐10.71, ‐3.67] |
| 1.10 Spirapril 3 mg | 2 | 184 | Mean Difference (IV, Fixed, 95% CI) | ‐4.02 [‐8.33, 0.28] |
| 1.11 Trandolapril 1 mg | 4 | 390 | Mean Difference (IV, Fixed, 95% CI) | ‐7.74 [‐10.34, ‐5.15] |
| 2 Change in trough DBP Show forest plot | 43 | 3758 | Mean Difference (IV, Fixed, 95% CI) | ‐3.04 [‐3.53, ‐2.54] |
| Analysis 17.2  Comparison 17 1/4 Max Dose vs Placebo, Outcome 2 Change in trough DBP. | ||||
| 2.1 Benazepril 10 mg | 3 | 314 | Mean Difference (IV, Fixed, 95% CI) | ‐0.89 [‐2.70, 0.93] |
| 2.2 Cilazapril 2.5 mg | 12 | 697 | Mean Difference (IV, Fixed, 95% CI) | ‐3.15 [‐4.29, 0.00] |
| 2.3 Enalapril 10 mg | 8 | 1138 | Mean Difference (IV, Fixed, 95% CI) | ‐3.11 [‐2.00, ‐2.23] |
| 2.4 Fosinopril 10 mg | 3 | 239 | Mean Difference (IV, Fixed, 95% CI) | ‐3.42 [‐5.43, ‐1.42] |
| 2.5 Imidapril 5 mg | 1 | 68 | Mean Difference (IV, Fixed, 95% CI) | ‐3.2 [‐7.41, 1.01] |
| 2.6 Lisinopril 20 mg | 1 | 80 | Mean Difference (IV, Fixed, 95% CI) | ‐4.6 [‐8.63, ‐0.57] |
| 2.7 Moexipril 7.5 mg | 3 | 223 | Mean Difference (IV, Fixed, 95% CI) | ‐2.18 [‐4.11, ‐0.24] |
| 2.8 Perindopril 2 mg | 2 | 134 | Mean Difference (IV, Fixed, 95% CI) | ‐2.31 [‐5.06, 0.45] |
| 2.9 Ramipril 5 mg | 4 | 291 | Mean Difference (IV, Fixed, 95% CI) | ‐3.65 [‐5.62, ‐1.67] |
| 2.10 Spirapril 3 mg | 2 | 184 | Mean Difference (IV, Fixed, 95% CI) | ‐4.20 [‐6.66, ‐1.74] |
| 2.11 Trandolapril 1 mg | 4 | 390 | Mean Difference (IV, Fixed, 95% CI) | ‐3.52 [‐4.92, ‐2.11] |
| Outcome or subgroup title | No. of studies | No. of participants | Statistical method | Effect size |
| 1 Change in trough SBP Show forest plot | 51 | 4980 | Mean Difference (IV, Fixed, 95% CI) | ‐7.60 [‐8.40, ‐6.79] |
| Analysis 18.1  Comparison 18 1/2 Max Dose vs Placebo, Outcome 1 Change in trough SBP. | ||||
| 1.1 Benazepril 20 mg | 6 | 504 | Mean Difference (IV, Fixed, 95% CI) | ‐7.97 [‐10.41, ‐5.52] |
| 1.2 Cilazapril 5 mg | 5 | 379 | Mean Difference (IV, Fixed, 95% CI) | ‐5.92 [‐8.70, ‐3.14] |
| 1.3 Enalapril 20 mg | 8 | 967 | Mean Difference (IV, Fixed, 95% CI) | ‐9.54 [‐11.22, ‐7.86] |
| 1.4 Fosinopril 20 mg | 5 | 277 | Mean Difference (IV, Fixed, 95% CI) | ‐8.99 [‐12.35, ‐5.62] |
| 1.5 Imidapril 10 mg | 1 | 66 | Mean Difference (IV, Fixed, 95% CI) | ‐8.90 [‐16.26, ‐1.54] |
| 1.6 Lisinopril 40 mg | 0 | 0 | Mean Difference (IV, Fixed, 95% CI) | 0.0 [0.0, 0.0] |
| 1.7 Moexipril 15 mg | 4 | 321 | Mean Difference (IV, Fixed, 95% CI) | ‐8.02 [‐11.16, ‐4.88] |
| 1.8 Perindopril 4 mg | 6 | 868 | Mean Difference (IV, Fixed, 95% CI) | ‐6.53 [‐9.04, ‐4.02] |
| 1.9 Quinapril 20 mg | 2 | 182 | Mean Difference (IV, Fixed, 95% CI) | ‐7.05 [‐11.26, ‐2.84] |
| 1.10 Ramipril 10 mg | 4 | 344 | Mean Difference (IV, Fixed, 95% CI) | ‐6.17 [‐9.07, ‐3.27] |
| 1.11 Spirapril 6 mg | 3 | 303 | Mean Difference (IV, Fixed, 95% CI) | ‐7.43 [‐10.41, ‐4.46] |
| 1.12 Trandolapril 2 mg | 7 | 769 | Mean Difference (IV, Fixed, 95% CI) | ‐6.17 [‐8.24, ‐4.10] |
| 2 Change in trough DBP Show forest plot | 57 | 5623 | Mean Difference (IV, Fixed, 95% CI) | ‐4.67 [‐5.09, ‐4.25] |
| Analysis 18.2  Comparison 18 1/2 Max Dose vs Placebo, Outcome 2 Change in trough DBP. | ||||
| 2.1 Benazepril 20 mg | 6 | 504 | Mean Difference (IV, Fixed, 95% CI) | ‐4.30 [‐5.70, ‐2.90] |
| 2.2 Cilazapril 5 mg | 9 | 800 | Mean Difference (IV, Fixed, 95% CI) | ‐3.40 [‐4.45, ‐2.36] |
| 2.3 Enalapril 20 mg | 9 | 1039 | Mean Difference (IV, Fixed, 95% CI) | ‐5.29 [‐6.22, ‐4.37] |
| 2.4 Fosinopril 20 mg | 5 | 277 | Mean Difference (IV, Fixed, 95% CI) | ‐6.86 [‐8.70, ‐5.02] |
| 2.5 Imidapril 10 mg | 1 | 66 | Mean Difference (IV, Fixed, 95% CI) | ‐7.40 [‐12.13, ‐2.67] |
| 2.6 Lisinopril 40 mg | 0 | 0 | Mean Difference (IV, Fixed, 95% CI) | 0.0 [0.0, 0.0] |
| 2.7 Moexipril 15 mg | 4 | 321 | Mean Difference (IV, Fixed, 95% CI) | ‐4.26 [‐5.93, ‐2.60] |
| 2.8 Perindopril 4 mg | 6 | 868 | Mean Difference (IV, Fixed, 95% CI) | ‐4.81 [‐6.04, ‐3.58] |
| 2.9 Quinapril 20 mg | 2 | 182 | Mean Difference (IV, Fixed, 95% CI) | ‐3.35 [‐5.98, ‐0.72] |
| 2.10 Ramipril 10 mg | 4 | 344 | Mean Difference (IV, Fixed, 95% CI) | ‐4.47 [‐6.17, ‐2.76] |
| 2.11 Spirapril 6 mg | 4 | 453 | Mean Difference (IV, Fixed, 95% CI) | ‐5.92 [‐7.45, ‐4.39] |
| 2.12 Trandolapril 2 mg | 7 | 769 | Mean Difference (IV, Fixed, 95% CI) | ‐4.24 [‐5.35, ‐3.14] |
| Outcome or subgroup title | No. of studies | No. of participants | Statistical method | Effect size |
| 1 Change in trough SBP Show forest plot | 16 | 1450 | Mean Difference (IV, Fixed, 95% CI) | ‐8.48 [‐9.91, ‐7.06] |
| Analysis 19.1  Comparison 19 Max Dose vs Placebo, Outcome 1 Change in trough SBP. | ||||
| 1.1 Benazepril 40 mg | 2 | 112 | Mean Difference (IV, Fixed, 95% CI) | ‐8.67 [‐13.73, ‐3.62] |
| 1.2 Cilazapril 10 mg | 1 | 101 | Mean Difference (IV, Fixed, 95% CI) | ‐7.0 [‐11.99, ‐2.01] |
| 1.3 Enalapril 40 mg | 0 | 0 | Mean Difference (IV, Fixed, 95% CI) | 0.0 [0.0, 0.0] |
| 1.4 Fosinopril 40 mg | 3 | 245 | Mean Difference (IV, Fixed, 95% CI) | ‐7.78 [‐11.20, ‐4.36] |
| 1.5 Imidapril 20 mg | 1 | 66 | Mean Difference (IV, Fixed, 95% CI) | ‐12.90 [‐20.56, ‐5.24] |
| 1.6 Lisinopril 80 mg | 1 | 79 | Mean Difference (IV, Fixed, 95% CI) | ‐13.8 [‐20.77, ‐6.83] |
| 1.7 Moexipril 30 mg | 0 | 0 | Mean Difference (IV, Fixed, 95% CI) | 0.0 [0.0, 0.0] |
| 1.8 Perindopril 8 mg | 2 | 129 | Mean Difference (IV, Fixed, 95% CI) | ‐10.09 [‐16.14, ‐4.05] |
| 1.9 Quinapril 40 mg | 1 | 14 | Mean Difference (IV, Fixed, 95% CI) | ‐6.0 [‐20.16, 8.16] |
| 1.10 Ramipril 20 mg | 0 | 0 | Mean Difference (IV, Fixed, 95% CI) | 0.0 [0.0, 0.0] |
| 1.11 Spirapril 12 mg | 2 | 226 | Mean Difference (IV, Fixed, 95% CI) | ‐8.23 [‐11.65, ‐4.82] |
| 1.12 Trandolapril 4 mg | 3 | 478 | Mean Difference (IV, Fixed, 95% CI) | ‐6.00 [‐10.41, ‐5.59] |
| 2 Change in trough DBP Show forest plot | 17 | 1636 | Mean Difference (IV, Fixed, 95% CI) | ‐4.95 [‐5.71, ‐4.20] |
| Analysis 19.2  Comparison 19 Max Dose vs Placebo, Outcome 2 Change in trough DBP. | ||||
| 2.1 Benazepril 40 mg | 2 | 112 | Mean Difference (IV, Fixed, 95% CI) | ‐4.76 [‐7.84, ‐1.69] |
| 2.2 Cilazapril 10 mg | 2 | 287 | Mean Difference (IV, Fixed, 95% CI) | ‐4.06 [‐5.74, ‐2.37] |
| 2.3 Enalapril 40 mg | 0 | 0 | Mean Difference (IV, Fixed, 95% CI) | 0.0 [0.0, 0.0] |
| 2.4 Fosinopril 40 mg | 3 | 245 | Mean Difference (IV, Fixed, 95% CI) | ‐4.63 [‐6.61, ‐2.65] |
| 2.5 Imidapril 20 mg | 1 | 66 | Mean Difference (IV, Fixed, 95% CI) | ‐6.3 [‐10.88, ‐1.72] |
| 2.6 Lisinopril 80 mg | 1 | 79 | Mean Difference (IV, Fixed, 95% CI) | ‐6.00 [‐9.96, ‐2.04] |
| 2.7 Moexipril 30 mg | 0 | 0 | Mean Difference (IV, Fixed, 95% CI) | 0.0 [0.0, 0.0] |
| 2.8 Perindopril 8 mg | 2 | 129 | Mean Difference (IV, Fixed, 95% CI) | ‐5.94 [‐8.81, ‐3.07] |
| 2.9 Quinapril 40 mg | 1 | 14 | Mean Difference (IV, Fixed, 95% CI) | ‐9.0 [‐17.78, ‐0.22] |
| 2.10 Ramipril 20 mg | 0 | 0 | Mean Difference (IV, Fixed, 95% CI) | 0.0 [0.0, 0.0] |
| 2.11 Spirapril 12 mg | 2 | 226 | Mean Difference (IV, Fixed, 95% CI) | ‐6.02 [‐8.09, ‐3.96] |
| 2.12 Trandolapril 4 mg | 3 | 478 | Mean Difference (IV, Fixed, 95% CI) | ‐4.71 [‐6.05, ‐3.37] |
| Outcome or subgroup title | No. of studies | No. of participants | Statistical method | Effect size |
| 1 Change in trough SBP Show forest plot | 7 | 738 | Mean Difference (IV, Fixed, 95% CI) | ‐8.81 [‐10.92, ‐6.70] |
| Analysis 20.1  Comparison 20 2 Max and Higher Doses vs Placebo, Outcome 1 Change in trough SBP. | ||||
| 1.1 Benazepril 80 mg | 1 | 77 | Mean Difference (IV, Fixed, 95% CI) | ‐11.40 [‐17.51, ‐5.29] |
| 1.2 Imidapril 40 mg | 1 | 67 | Mean Difference (IV, Fixed, 95% CI) | ‐10.60 [‐17.40, ‐3.80] |
| 1.3 Perindopril 16 mg | 1 | 108 | Mean Difference (IV, Fixed, 95% CI) | ‐8.9 [‐15.36, ‐2.44] |
| 1.4 Spirapril 24 mg | 2 | 220 | Mean Difference (IV, Fixed, 95% CI) | ‐9.40 [‐12.67, ‐6.12] |
| 1.5 Trandolapril 8, 12, 16 mg | 2 | 266 | Mean Difference (IV, Fixed, 95% CI) | ‐6.03 [‐10.14, ‐1.93] |
| 2 Change in trough DBP Show forest plot | 7 | 738 | Mean Difference (IV, Fixed, 95% CI) | ‐5.25 [‐6.45, ‐4.05] |
| Analysis 20.2  Comparison 20 2 Max and Higher Doses vs Placebo, Outcome 2 Change in trough DBP. | ||||
| 2.1 Benazepril 80 mg | 1 | 77 | Mean Difference (IV, Fixed, 95% CI) | ‐6.80 [‐10.34, ‐3.26] |
| 2.2 Imidapril 40 mg | 1 | 67 | Mean Difference (IV, Fixed, 95% CI) | ‐6.5 [‐11.22, ‐1.78] |
| 2.3 Perindopril 16 mg | 1 | 108 | Mean Difference (IV, Fixed, 95% CI) | ‐5.5 [‐8.48, ‐2.52] |
| 2.4 Spirapril 24 mg | 2 | 220 | Mean Difference (IV, Fixed, 95% CI) | ‐4.56 [‐6.66, ‐2.47] |
| 2.5 Trandolapril 8, 12, 16 mg | 2 | 266 | Mean Difference (IV, Fixed, 95% CI) | ‐5.02 [‐7.12, ‐2.93] |
| Outcome or subgroup title | No. of studies | No. of participants | Statistical method | Effect size |
| 1 Change in trough SBP Show forest plot | 53 | 6113 | Mean Difference (IV, Fixed, 95% CI) | ‐7.85 [‐8.60, ‐7.09] |
| Analysis 21.1  Comparison 21 1/2 Max and Higher Doses vs Placebo, Outcome 1 Change in trough SBP. | ||||
| 1.1 Benazepril 20, 40, 80 mg | 6 | 598 | Mean Difference (IV, Fixed, 95% CI) | ‐8.54 [‐10.87, ‐6.21] |
| 1.2 Cilazapril 5, 10 mg | 5 | 429 | Mean Difference (IV, Fixed, 95% CI) | ‐5.79 [‐8.46, ‐3.12] |
| 1.3 Enalapril 20, (40) mg | 8 | 967 | Mean Difference (IV, Fixed, 95% CI) | ‐9.54 [‐11.22, ‐7.86] |
| 1.4 Fosinopril 20, 40 mg | 4 | 359 | Mean Difference (IV, Fixed, 95% CI) | ‐7.44 [‐10.44, ‐4.44] |
| 1.5 Imidapril 10, 20, 40 mg | 1 | 129 | Mean Difference (IV, Fixed, 95% CI) | ‐10.8 [‐16.60, ‐5.00] |
| 1.6 Lisinopril (40), 80 mg | 1 | 50 | Mean Difference (IV, Fixed, 95% CI) | ‐13.8 [‐24.46, ‐3.14] |
| 1.7 Moexipril 15, (30) mg | 4 | 321 | Mean Difference (IV, Fixed, 95% CI) | ‐8.02 [‐11.16, ‐4.88] |
| 1.8 Perindopril 4, 8, 16 mg | 6 | 985 | Mean Difference (IV, Fixed, 95% CI) | ‐7.12 [‐9.55, ‐4.70] |
| 1.9 Quinapril 20, (40) mg | 2 | 182 | Mean Difference (IV, Fixed, 95% CI) | ‐7.05 [‐11.26, ‐2.84] |
| 1.10 Ramipril 10, (20) mg | 4 | 257 | Mean Difference (IV, Fixed, 95% CI) | ‐5.74 [‐9.33, ‐2.16] |
| 1.11 Spirapril 6, 12, 24 mg | 3 | 521 | Mean Difference (IV, Fixed, 95% CI) | ‐8.31 [‐10.80, ‐5.82] |
| 1.12 Trandolapril 2, 4, 8, 12, 16 mg | 9 | 1315 | Mean Difference (IV, Fixed, 95% CI) | ‐7.02 [‐8.70, ‐5.34] |
| 2 Change in trough DBP Show forest plot | 59 | 6861 | Mean Difference (IV, Fixed, 95% CI) | ‐4.73 [‐5.13, ‐4.34] |
| Analysis 21.2  Comparison 21 1/2 Max and Higher Doses vs Placebo, Outcome 2 Change in trough DBP. | ||||
| 2.1 Benazepril 20, 40, 80 mg | 6 | 598 | Mean Difference (IV, Fixed, 95% CI) | ‐4.56 [‐5.91, ‐3.22] |
| 2.2 Cilazapril 5, 10 mg | 9 | 942 | Mean Difference (IV, Fixed, 95% CI) | ‐3.58 [‐4.57, ‐2.60] |
| 2.3 Enalapril 20, (40) mg | 9 | 1039 | Mean Difference (IV, Fixed, 95% CI) | ‐5.29 [‐6.22, ‐4.37] |
| 2.4 Fosinopril 20, 40 mg | 4 | 359 | Mean Difference (IV, Fixed, 95% CI) | ‐5.15 [‐6.85, ‐3.45] |
| 2.5 Imidapril 10, 20, 40 mg | 1 | 129 | Mean Difference (IV, Fixed, 95% CI) | ‐6.7 [‐10.54, ‐2.86] |
| 2.6 Lisinopril (40), 80 mg | 1 | 79 | Mean Difference (IV, Fixed, 95% CI) | ‐6.00 [‐9.96, ‐2.04] |
| 2.7 Moexipril 15, (30) mg | 4 | 321 | Mean Difference (IV, Fixed, 95% CI) | ‐4.26 [‐5.93, ‐2.60] |
| 2.8 Perindopril 4, 8, 16 mg | 6 | 985 | Mean Difference (IV, Fixed, 95% CI) | ‐5.01 [‐6.18, ‐3.84] |
| 2.9 Quinapril 20, (40) mg | 2 | 182 | Mean Difference (IV, Fixed, 95% CI) | ‐3.35 [‐5.98, ‐0.72] |
| 2.10 Ramipril 10, (20) mg | 4 | 257 | Mean Difference (IV, Fixed, 95% CI) | ‐4.42 [‐6.55, ‐2.29] |
| 2.11 Spirapril 6, 12, 24 mg | 4 | 671 | Mean Difference (IV, Fixed, 95% CI) | ‐5.84 [‐7.19, ‐4.49] |
| 2.12 Trandolapril 2, 4, 8, 12, 16 mg | 9 | 1299 | Mean Difference (IV, Fixed, 95% CI) | ‐4.65 [‐5.55, ‐3.74] |
| Outcome or subgroup title | No. of studies | No. of participants | Statistical method | Effect size |
| 1 Change in peak SBP [1/2 Max and Higher Doses Only] Show forest plot | 11 | 1154 | Mean Difference (IV, Fixed, 95% CI) | ‐11.53 [‐13.27, ‐9.78] |
| Analysis 22.1 ![Comparison 22 ACE Inhibitors vs Placebo, Outcome 1 Change in peak SBP [1/2 Max and Higher Doses Only].](/cdsr/doi/10.1002/14651858.CD003823.pub2/media/CDSR/CD003823/image_n/nCD003823-CMP-022-01.png) Comparison 22 ACE Inhibitors vs Placebo, Outcome 1 Change in peak SBP [1/2 Max and Higher Doses Only]. | ||||
| 1.1 1/2 Max Dose | 11 | 783 | Mean Difference (IV, Fixed, 95% CI) | ‐11.06 [‐13.11, ‐9.02] |
| 1.2 Max Dose | 3 | 143 | Mean Difference (IV, Fixed, 95% CI) | ‐11.48 [‐17.37, ‐5.60] |
| 1.3 2 Max Dose | 3 | 228 | Mean Difference (IV, Fixed, 95% CI) | ‐13.36 [‐17.40, ‐9.31] |
| 2 Change in peak DBP [1/2 Max and Higher Doses Only] Show forest plot | 15 | 1485 | Mean Difference (IV, Fixed, 95% CI) | ‐6.37 [‐7.15, ‐5.58] |
| Analysis 22.2 ![Comparison 22 ACE Inhibitors vs Placebo, Outcome 2 Change in peak DBP [1/2 Max and Higher Doses Only].](/cdsr/doi/10.1002/14651858.CD003823.pub2/media/CDSR/CD003823/image_n/nCD003823-CMP-022-02.png) Comparison 22 ACE Inhibitors vs Placebo, Outcome 2 Change in peak DBP [1/2 Max and Higher Doses Only]. | ||||
| 2.1 1/2 Max Dose | 15 | 1103 | Mean Difference (IV, Fixed, 95% CI) | ‐6.02 [‐6.95, ‐5.08] |
| 2.2 Max Dose | 4 | 157 | Mean Difference (IV, Fixed, 95% CI) | ‐6.49 [‐8.81, ‐4.16] |
| 2.3 2 Max Dose | 3 | 225 | Mean Difference (IV, Fixed, 95% CI) | ‐7.69 [‐9.56, ‐5.82] |
| 3 Change in peak SBP [All Doses] Show forest plot | 11 | Mean Difference (IV, Fixed, 95% CI) | Subtotals only | |
| Analysis 22.3 ![Comparison 22 ACE Inhibitors vs Placebo, Outcome 3 Change in peak SBP [All Doses].](/cdsr/doi/10.1002/14651858.CD003823.pub2/media/CDSR/CD003823/image_n/nCD003823-CMP-022-03.png) Comparison 22 ACE Inhibitors vs Placebo, Outcome 3 Change in peak SBP [All Doses]. | ||||
| 3.1 1/8 Max Dose | 1 | 11 | Mean Difference (IV, Fixed, 95% CI) | ‐11.3 [‐30.46, 7.86] |
| 3.2 1/4 Max Dose | 6 | 326 | Mean Difference (IV, Fixed, 95% CI) | ‐6.03 [‐9.93, ‐2.13] |
| 3.3 1/2 Max Dose | 11 | 724 | Mean Difference (IV, Fixed, 95% CI) | ‐10.97 [‐13.14, ‐8.80] |
| 3.4 Max Dose | 3 | 136 | Mean Difference (IV, Fixed, 95% CI) | ‐11.43 [‐17.69, ‐5.16] |
| 3.5 2 Max Dose | 3 | 211 | Mean Difference (IV, Fixed, 95% CI) | ‐13.58 [‐18.03, ‐9.13] |
| 4 Change in peak DBP [All Doses] Show forest plot | 15 | Mean Difference (IV, Fixed, 95% CI) | Subtotals only | |
| Analysis 22.4 ![Comparison 22 ACE Inhibitors vs Placebo, Outcome 4 Change in peak DBP [All Doses].](/cdsr/doi/10.1002/14651858.CD003823.pub2/media/CDSR/CD003823/image_n/nCD003823-CMP-022-04.png) Comparison 22 ACE Inhibitors vs Placebo, Outcome 4 Change in peak DBP [All Doses]. | ||||
| 4.1 1/8 Max Dose | 3 | 154 | Mean Difference (IV, Fixed, 95% CI) | ‐9.51 [‐12.64, ‐6.38] |
| 4.2 1/4 Max Dose | 9 | 451 | Mean Difference (IV, Fixed, 95% CI) | ‐3.69 [‐5.24, ‐2.15] |
| 4.3 1/2 Max Dose | 15 | 981 | Mean Difference (IV, Fixed, 95% CI) | ‐5.98 [‐7.02, ‐4.94] |
| 4.4 Max Dose | 4 | 157 | Mean Difference (IV, Fixed, 95% CI) | ‐6.49 [‐8.81, ‐4.16] |
| 4.5 2 Max Dose | 3 | 212 | Mean Difference (IV, Fixed, 95% CI) | ‐7.78 [‐9.74, ‐5.83] |
| 5 Change in trough heart rate Show forest plot | 16 | Mean Difference (IV, Fixed, 95% CI) | Subtotals only | |
| Analysis 22.5  Comparison 22 ACE Inhibitors vs Placebo, Outcome 5 Change in trough heart rate. | ||||
| 5.1 1/8 Max Dose | 1 | 114 | Mean Difference (IV, Fixed, 95% CI) | ‐3.0 [‐6.62, 0.62] |
| 5.2 1/4 Max Dose | 10 | 587 | Mean Difference (IV, Fixed, 95% CI) | ‐0.47 [‐1.76, 0.81] |
| 5.3 1/2 Max Dose | 9 | 917 | Mean Difference (IV, Fixed, 95% CI) | ‐0.71 [‐1.99, 0.57] |
| 5.4 Max Dose | 2 | 89 | Mean Difference (IV, Fixed, 95% CI) | 1.31 [‐2.15, 4.76] |
| 6 Total withdrawals due to adverse effects Show forest plot | 56 | Risk Ratio (M‐H, Fixed, 95% CI) | Subtotals only | |
| Analysis 22.6  Comparison 22 ACE Inhibitors vs Placebo, Outcome 6 Total withdrawals due to adverse effects. | ||||
| 6.1 1/16 Max Dose | 4 | 282 | Risk Ratio (M‐H, Fixed, 95% CI) | 1.01 [0.39, 2.57] |
| 6.2 1/8 Max Dose | 9 | 842 | Risk Ratio (M‐H, Fixed, 95% CI) | 0.88 [0.42, 1.82] |
| 6.3 1/4 Max Dose | 32 | 3385 | Risk Ratio (M‐H, Fixed, 95% CI) | 0.65 [0.42, 1.00] |
| 6.4 1/2 Max Dose | 38 | 3568 | Risk Ratio (M‐H, Fixed, 95% CI) | 0.81 [0.55, 1.19] |
| 6.5 Max Dose | 8 | 840 | Risk Ratio (M‐H, Fixed, 95% CI) | 1.15 [0.56, 2.35] |
| 6.6 2 Max Dose | 5 | 567 | Risk Ratio (M‐H, Fixed, 95% CI) | 1.51 [0.68, 3.34] |
QUOROM flow diagram

Number of included studies according to publication year

Number of included studies according to ACE inhibitor studied

Log dose‐response curve of benazepril 2 ‐ 80 mg/day
(Shaded area represents manufacturer's recommended dose range)

Log dose‐response curve of captopril 37.5 ‐ 200 mg/day
(Shaded area represents manufacturer's recommended dose range)

Log dose‐response curve of cilazapril 0.5 ‐ 10 mg/day
(Shaded area represents manufacturer's recommended dose range)

Log dose‐response curve of enalapril 5 ‐ 40 mg/day
(Shaded area represents manufacturer's recommended dose range)

Lose dose‐response curve of fosinopril 2.5 ‐ 40 mg/day
(Shaded area represents manufacturer's recommended dose range)

Log dose‐response curve of imidapril 5 ‐ 40 mg/day
(Shaded area represents manufacturer's recommended dose range)
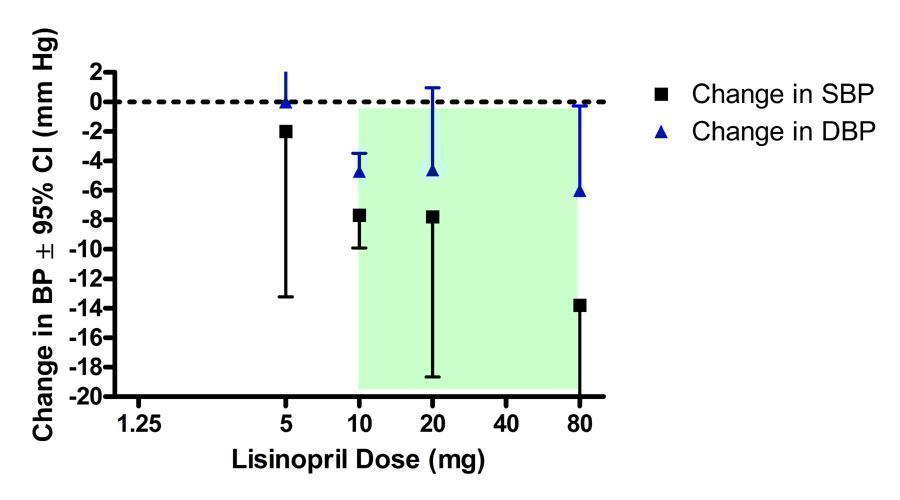
Lose dose‐response curve of lisinopril 1.25 ‐ 80 mg/day
(Shaded area represents manufacturer's recommended dose range)
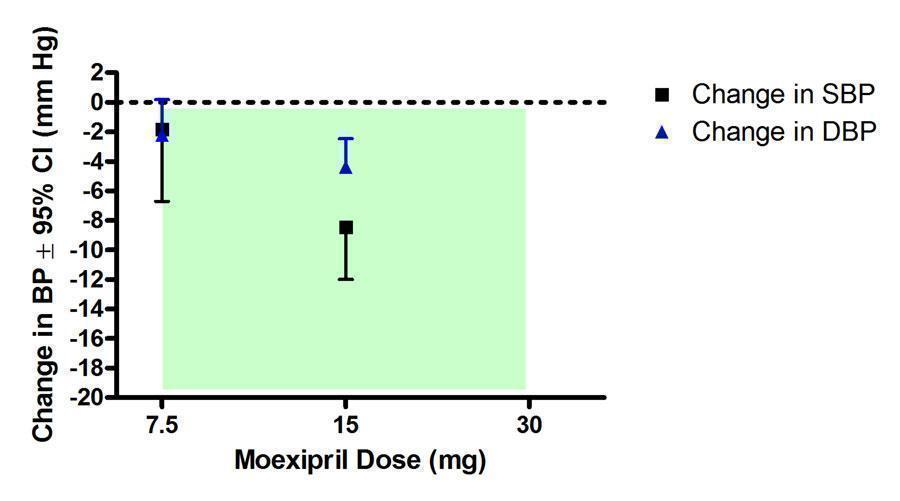
Log dose‐response curve of moexipril 7.5 ‐ 30 mg/day
(Shaded area represents manufacturer's recommended dose range)

Log dose‐response curve of perindopril 2 ‐ 16 mg/day
(Shaded area represents manufacturer's recommended dose range)

Log dose‐response curve of quinapril 10 ‐ 40 mg/day
(Shaded area represents manufacturer's recommended dose range)

Log dose‐response curve of ramipril 1.25 ‐ 20 mg/day
(Shaded area represents manufacturer's recommended dose range)
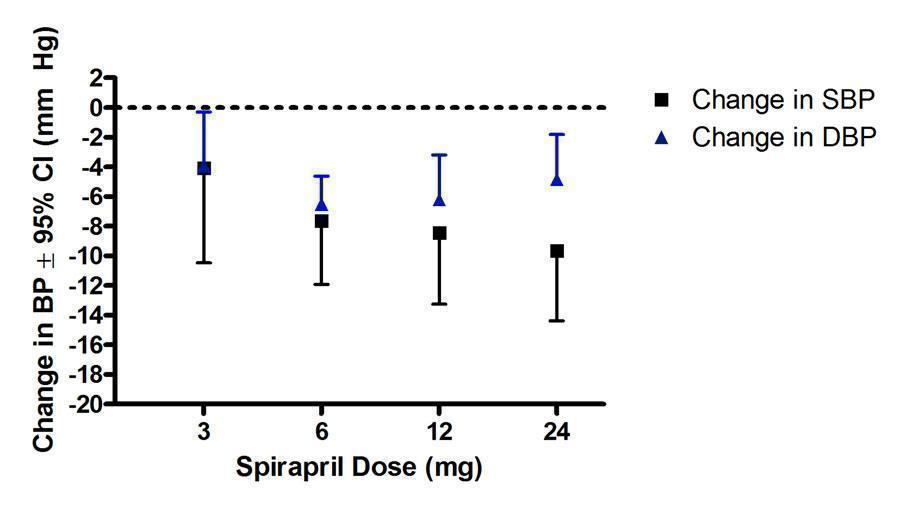
Log dose‐response curve of spirapril 3 ‐ 24 mg/day

Log dose‐response curve of temocapril 1 ‐ 20 mg/day
(Shaded area represents manufacturer's recommended dose range)
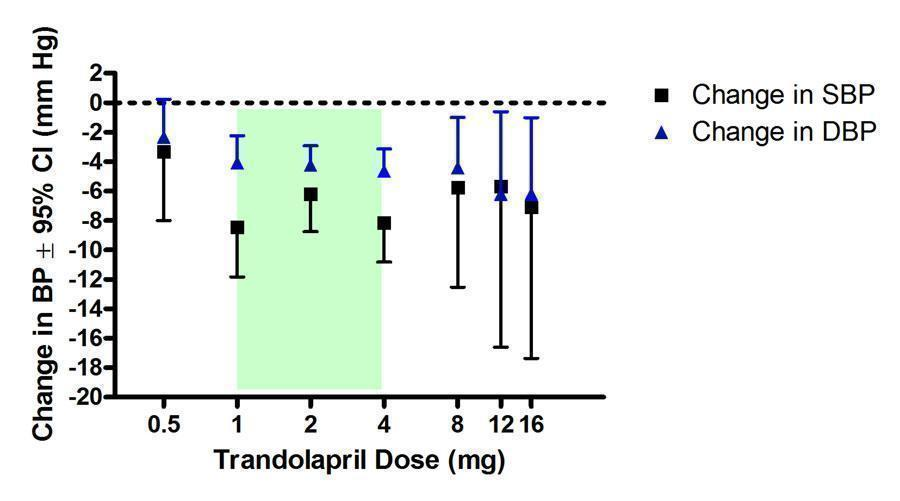
Log dose‐response curve of trandolapril 0.5 ‐ 16 mg/day
(Shaded area represents manufacturer's recommended dose range)

Blood pressure lowering efficacy of ACE inhibitors according to proportions of Max

Blood pressure lowering efficacy of ACE inhibitors according to proportions of Max

Blood pressure lowering efficacy of ACE inhibitors according to proportions of Max

Blood pressure lowering efficacy of ACE inhibitors according to proportions of Max
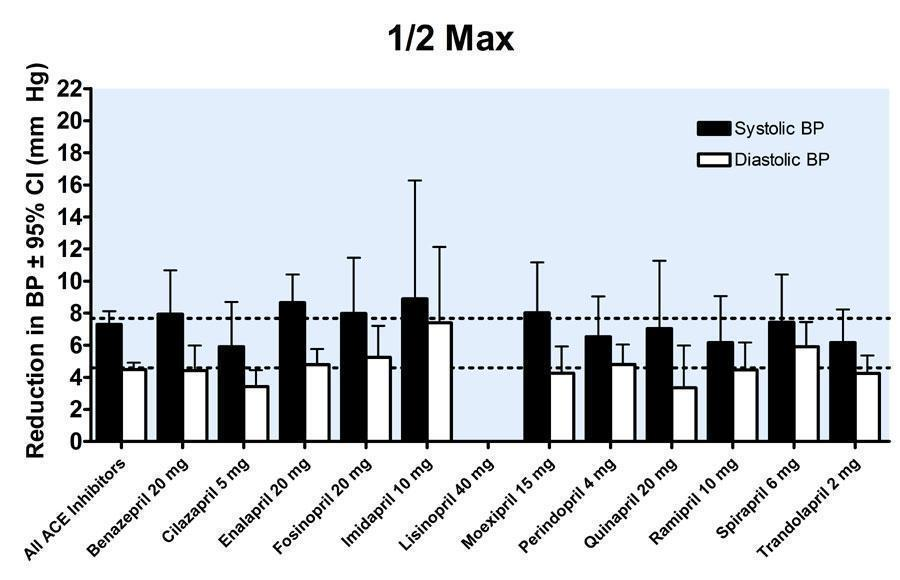
Blood pressure lowering efficacy of ACE inhibitors according to proportions of Max

Blood pressure lowering efficacy of ACE inhibitors according to proportions of Max

Blood pressure lowering efficacy of ACE inhibitors according to proportions of Max

Log dose‐response curve of ACE inhibitors according to proportions of Max

Near maximal blood pressure lowering efficacy of ACE inhibitors

Funnel plot of near maximal change in trough SBP for ACE inhibitors at 1/2 Max and higher doses

Funnel plot of near maximal change in trough DBP for ACE inhibitors at 1/2 Max and higher doses

Post‐hoc tertile analysis of the effect of trial size on reported trough BP lowering
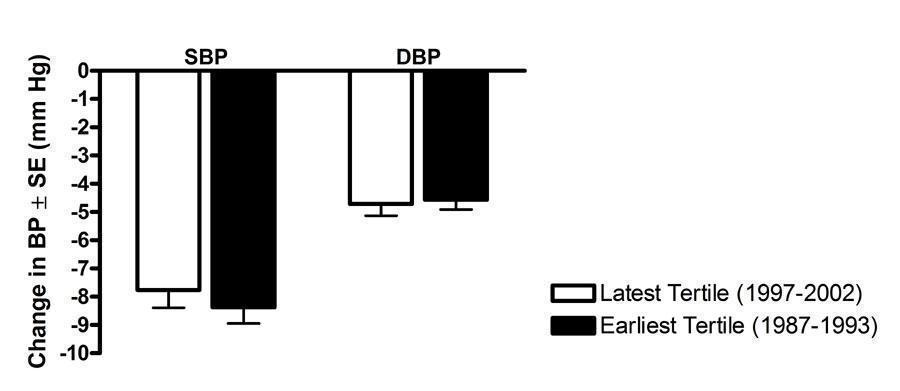
Post‐hoc tertile analysis of the effect of publication year on reported trough BP lowering

Log dose‐response curve of peak blood pressure lowering efficacy of ACE inhibitors according to proportions of Max

Log dose‐response curve assessing the effect of ACE inhibitors on heart rate

Log dose‐response curve assessing the effect of ACE inhibitors on withdrawals due to adverse effects

Comparison 1 Benazepril vs Placebo, Outcome 1 Change in trough SBP.

Comparison 1 Benazepril vs Placebo, Outcome 2 Change in trough DBP.

Comparison 2 Captopril vs Placebo, Outcome 1 Change in SBP.
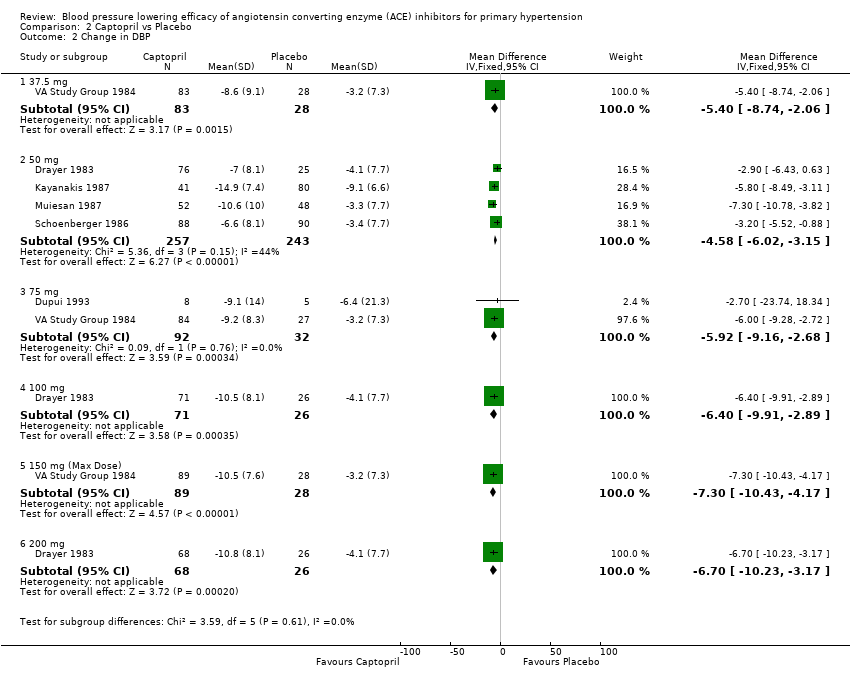
Comparison 2 Captopril vs Placebo, Outcome 2 Change in DBP.
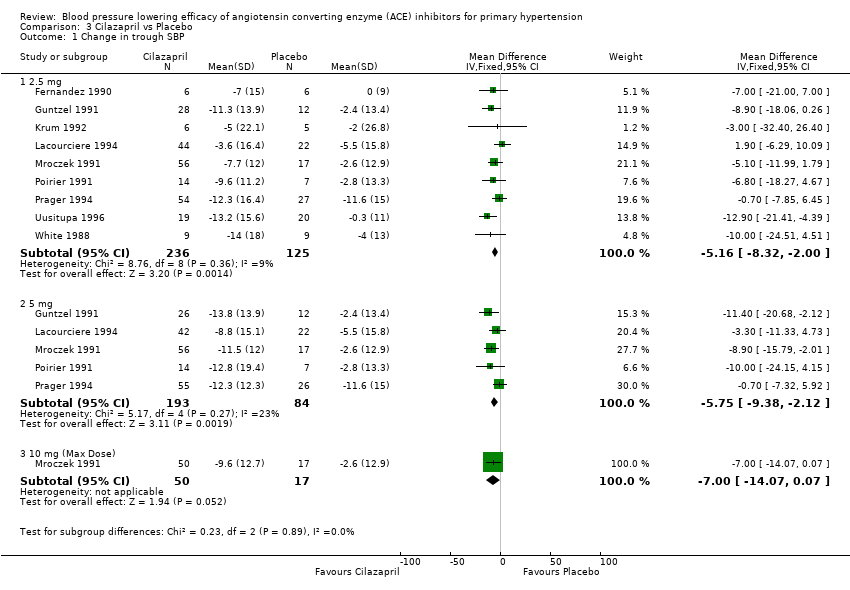
Comparison 3 Cilazapril vs Placebo, Outcome 1 Change in trough SBP.

Comparison 3 Cilazapril vs Placebo, Outcome 2 Change in trough DBP.
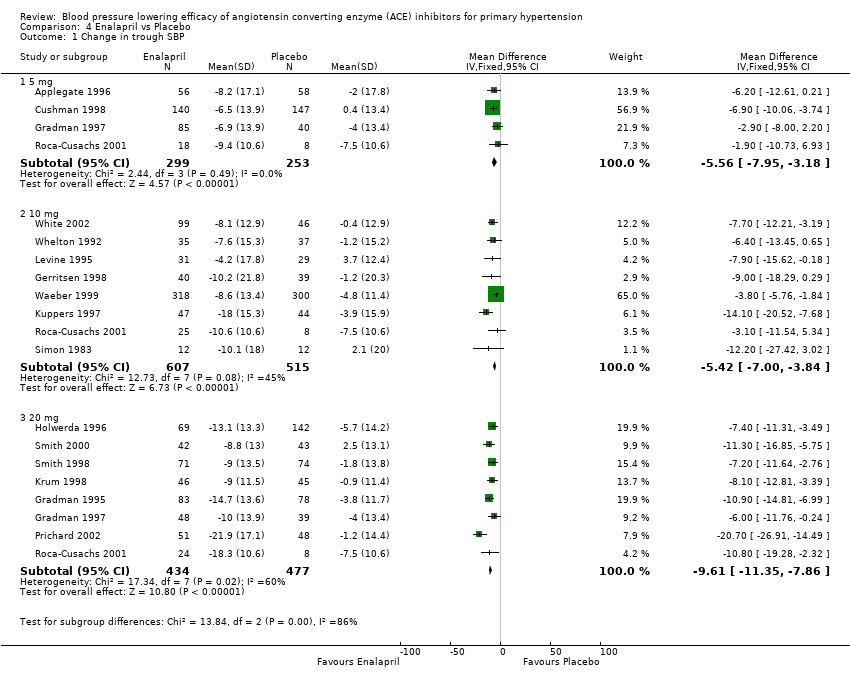
Comparison 4 Enalapril vs Placebo, Outcome 1 Change in trough SBP.

Comparison 4 Enalapril vs Placebo, Outcome 2 Change in trough DBP.

Comparison 5 Fosinopril vs Placebo, Outcome 1 Change in trough SBP.
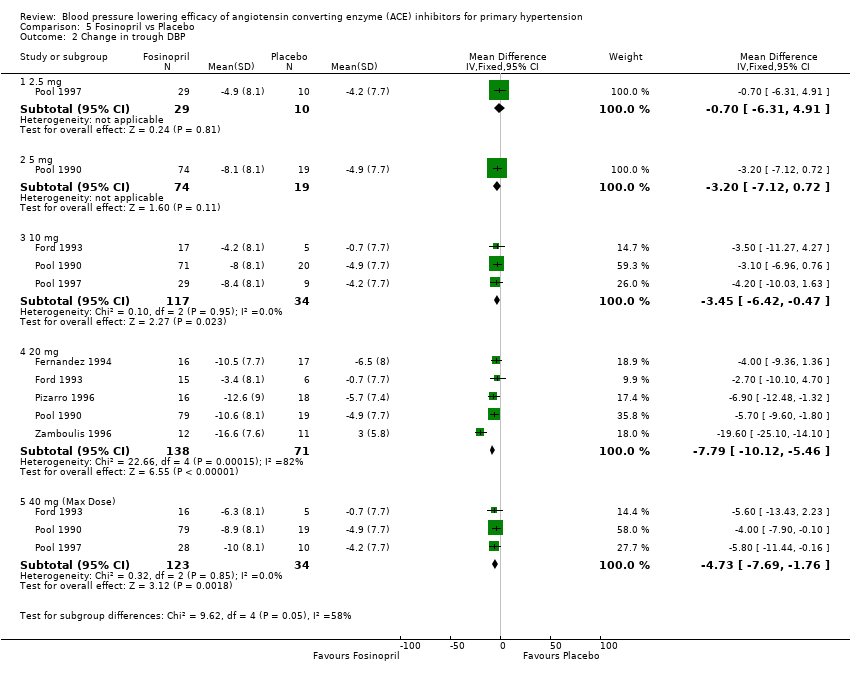
Comparison 5 Fosinopril vs Placebo, Outcome 2 Change in trough DBP.

Comparison 6 Imidapril vs Placebo, Outcome 1 Change in trough SBP.
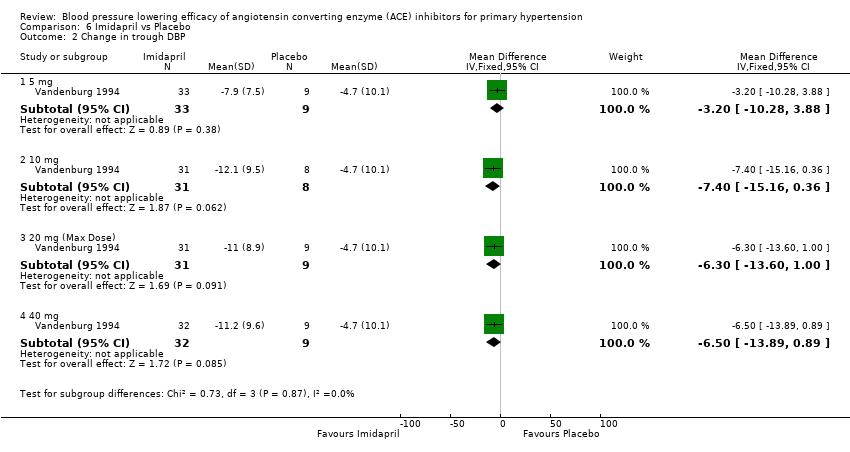
Comparison 6 Imidapril vs Placebo, Outcome 2 Change in trough DBP.

Comparison 7 Lisinopril vs Placebo, Outcome 1 Change in trough SBP.
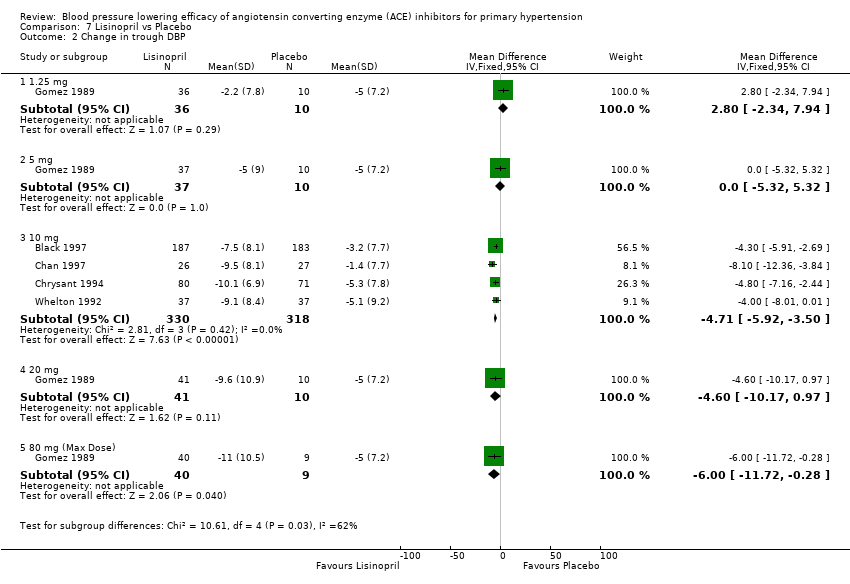
Comparison 7 Lisinopril vs Placebo, Outcome 2 Change in trough DBP.
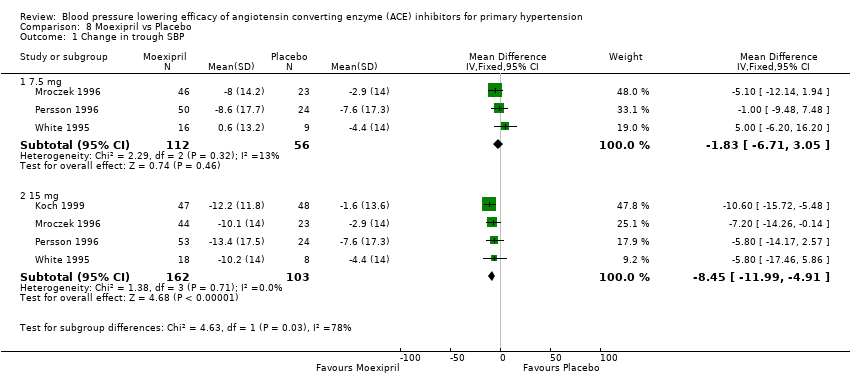
Comparison 8 Moexipril vs Placebo, Outcome 1 Change in trough SBP.
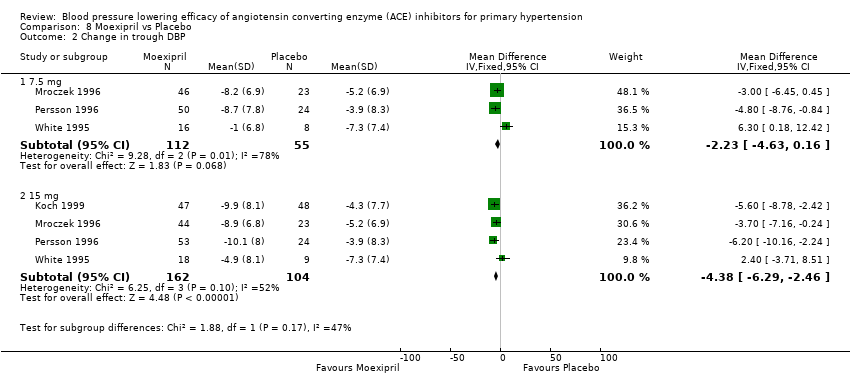
Comparison 8 Moexipril vs Placebo, Outcome 2 Change in trough DBP.

Comparison 9 Perindopril vs Placebo, Outcome 1 Change in trough SBP.
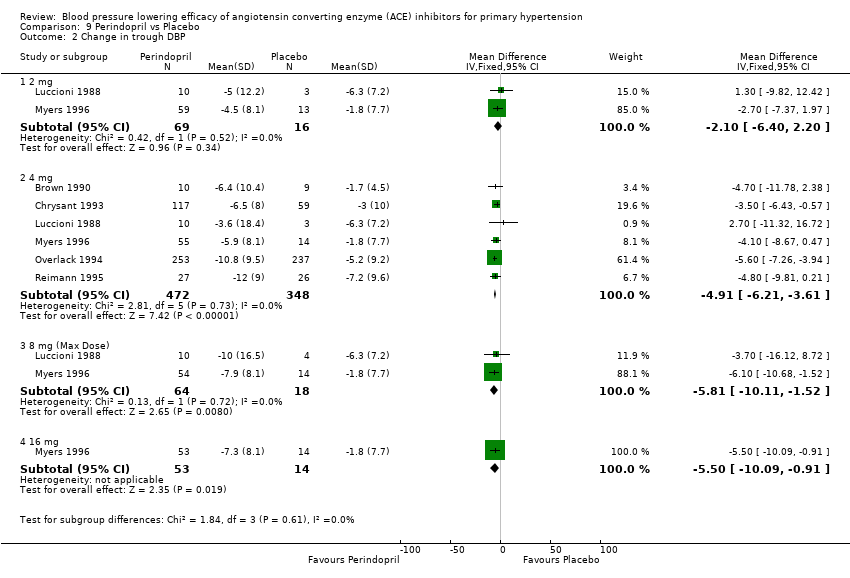
Comparison 9 Perindopril vs Placebo, Outcome 2 Change in trough DBP.
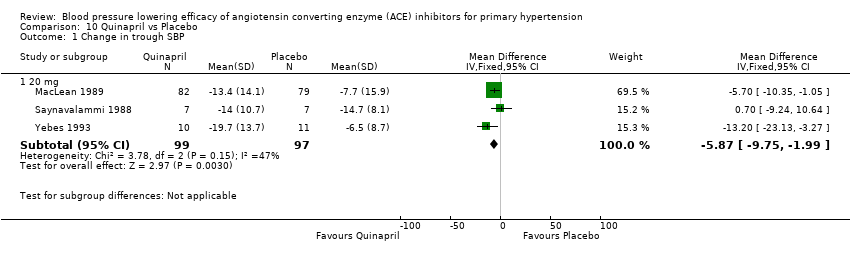
Comparison 10 Quinapril vs Placebo, Outcome 1 Change in trough SBP.

Comparison 10 Quinapril vs Placebo, Outcome 2 Change in trough DBP.

Comparison 11 Ramipril vs Placebo, Outcome 1 Change in trough SBP.

Comparison 11 Ramipril vs Placebo, Outcome 2 Change in trough DBP.

Comparison 12 Spirapril vs Placebo, Outcome 1 Change in trough SBP.
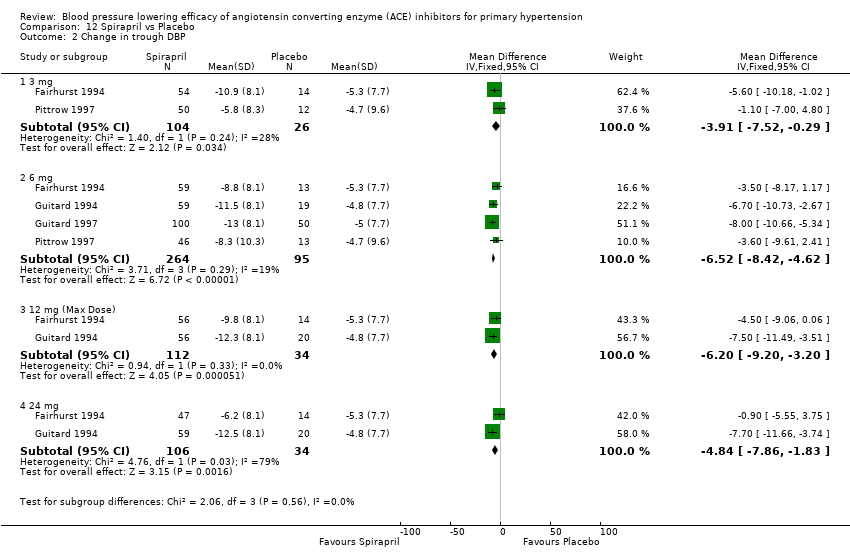
Comparison 12 Spirapril vs Placebo, Outcome 2 Change in trough DBP.

Comparison 13 Temocapril vs Placebo, Outcome 1 Change in trough SBP.
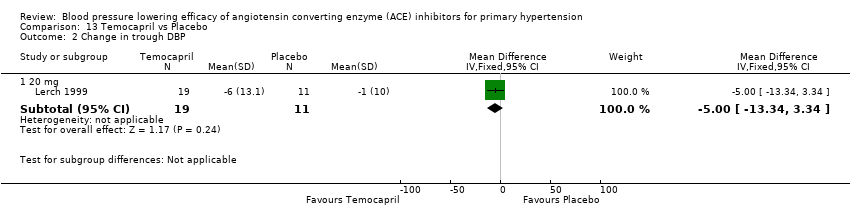
Comparison 13 Temocapril vs Placebo, Outcome 2 Change in trough DBP.
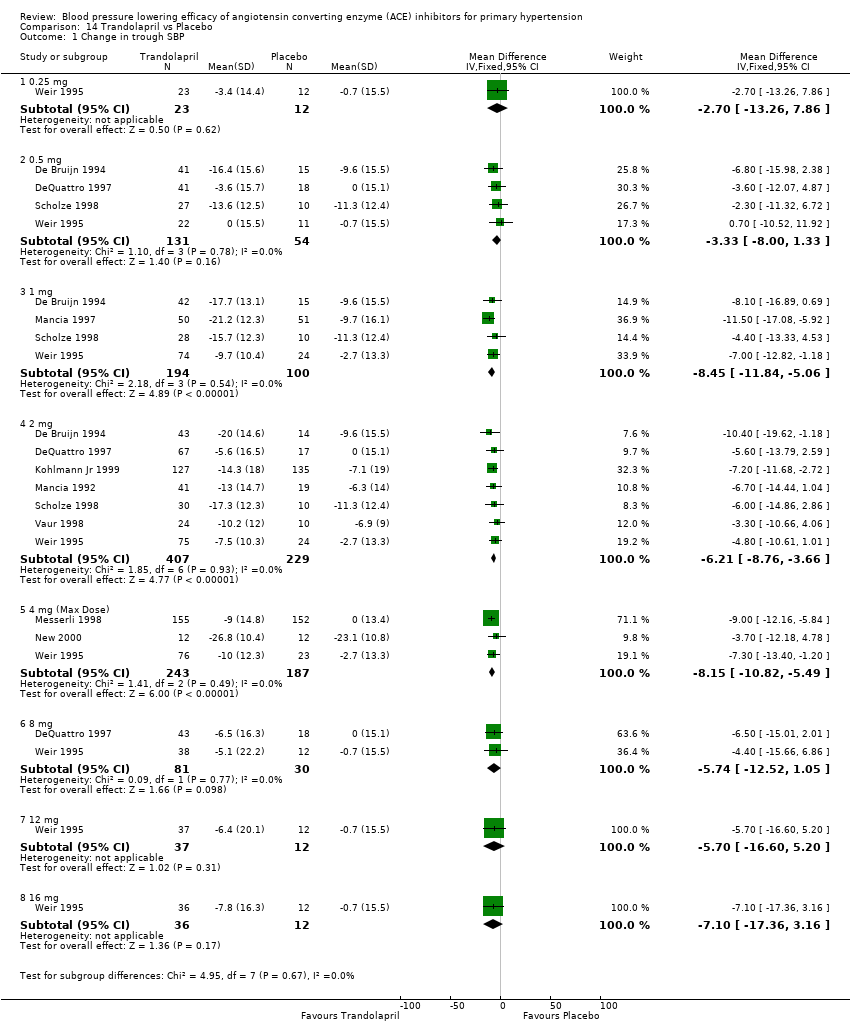
Comparison 14 Trandolapril vs Placebo, Outcome 1 Change in trough SBP.
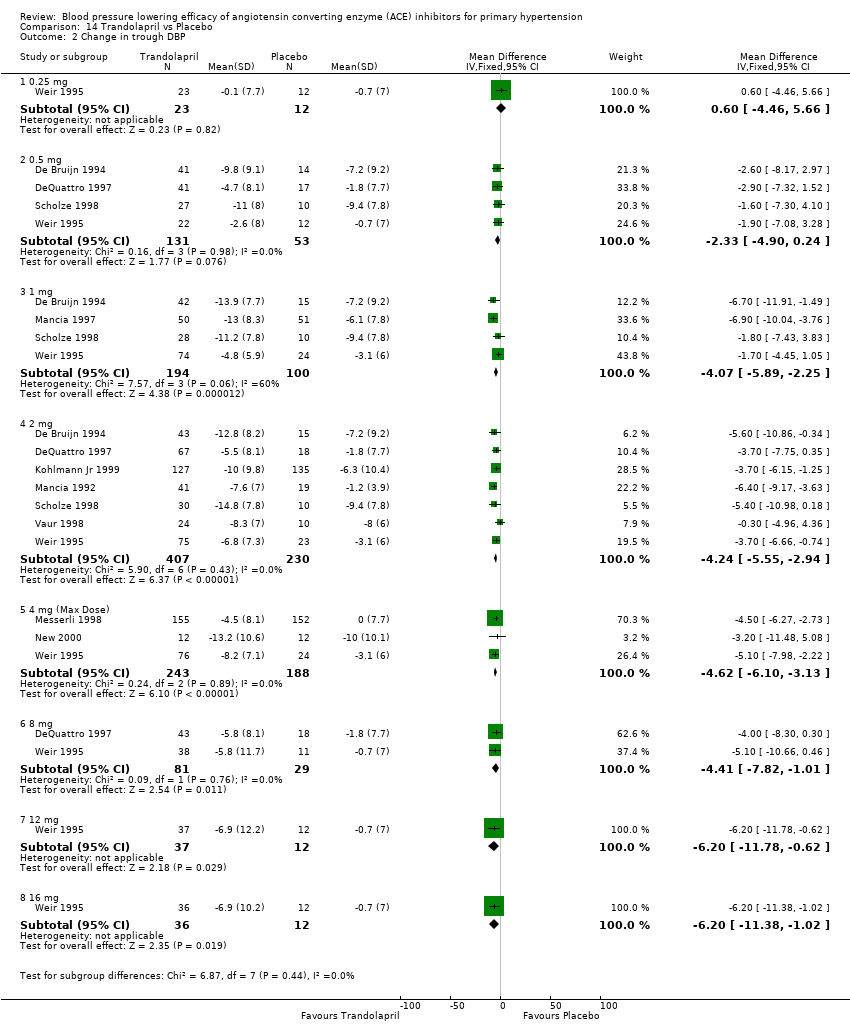
Comparison 14 Trandolapril vs Placebo, Outcome 2 Change in trough DBP.
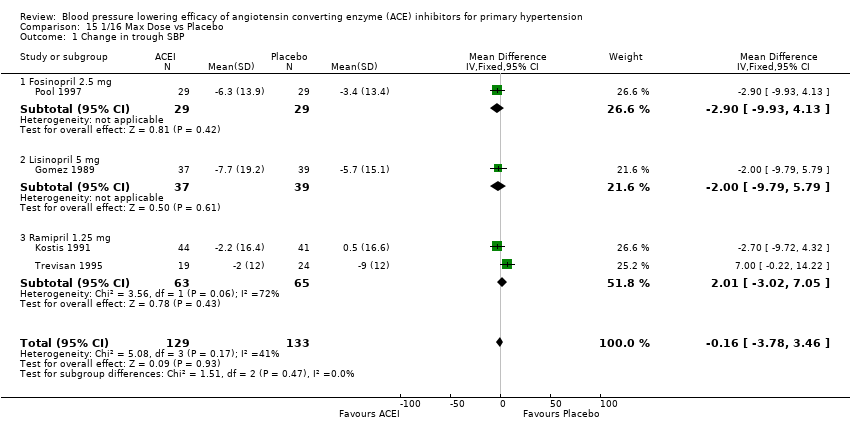
Comparison 15 1/16 Max Dose vs Placebo, Outcome 1 Change in trough SBP.

Comparison 15 1/16 Max Dose vs Placebo, Outcome 2 Change in trough DBP.

Comparison 16 1/8 Max Dose vs Placebo, Outcome 1 Change in trough SBP.
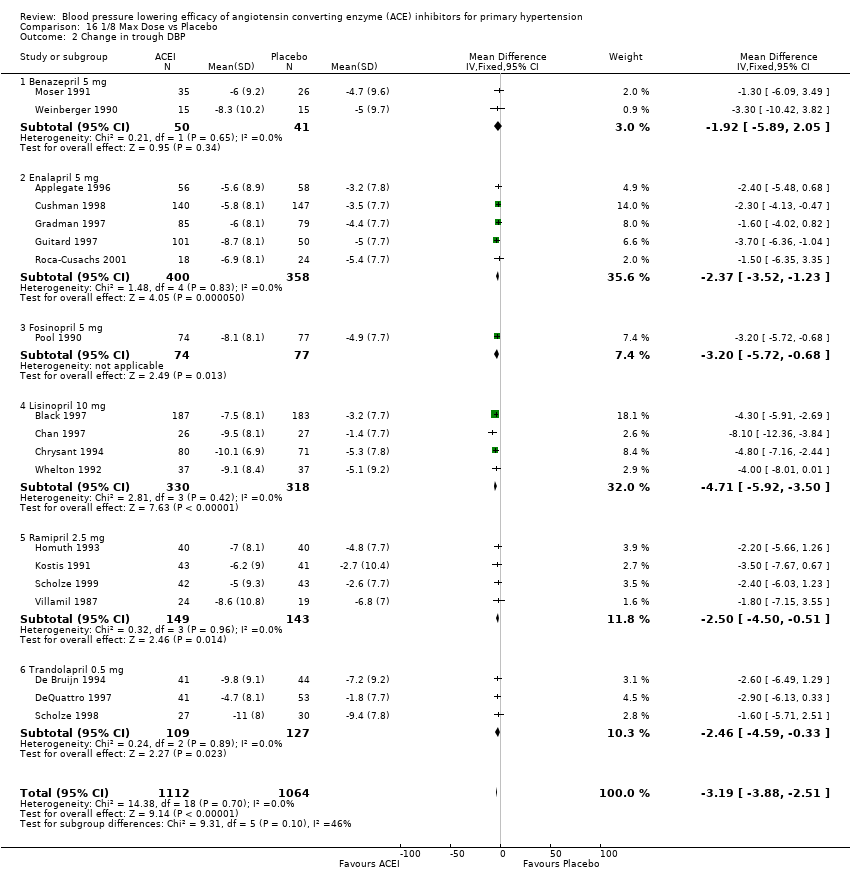
Comparison 16 1/8 Max Dose vs Placebo, Outcome 2 Change in trough DBP.

Comparison 17 1/4 Max Dose vs Placebo, Outcome 1 Change in trough SBP.
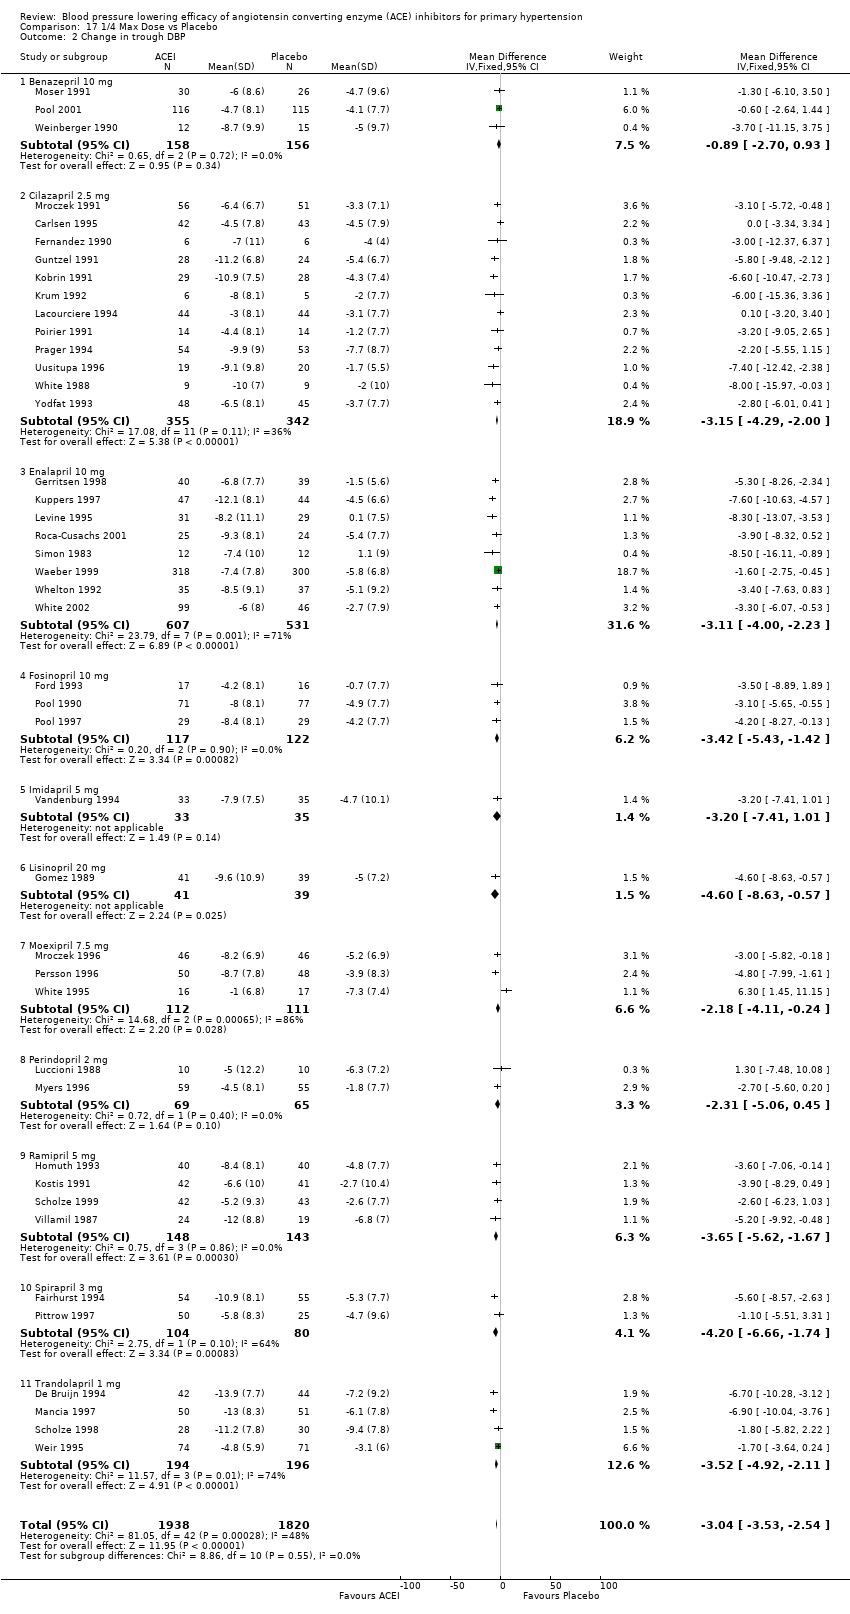
Comparison 17 1/4 Max Dose vs Placebo, Outcome 2 Change in trough DBP.

Comparison 18 1/2 Max Dose vs Placebo, Outcome 1 Change in trough SBP.
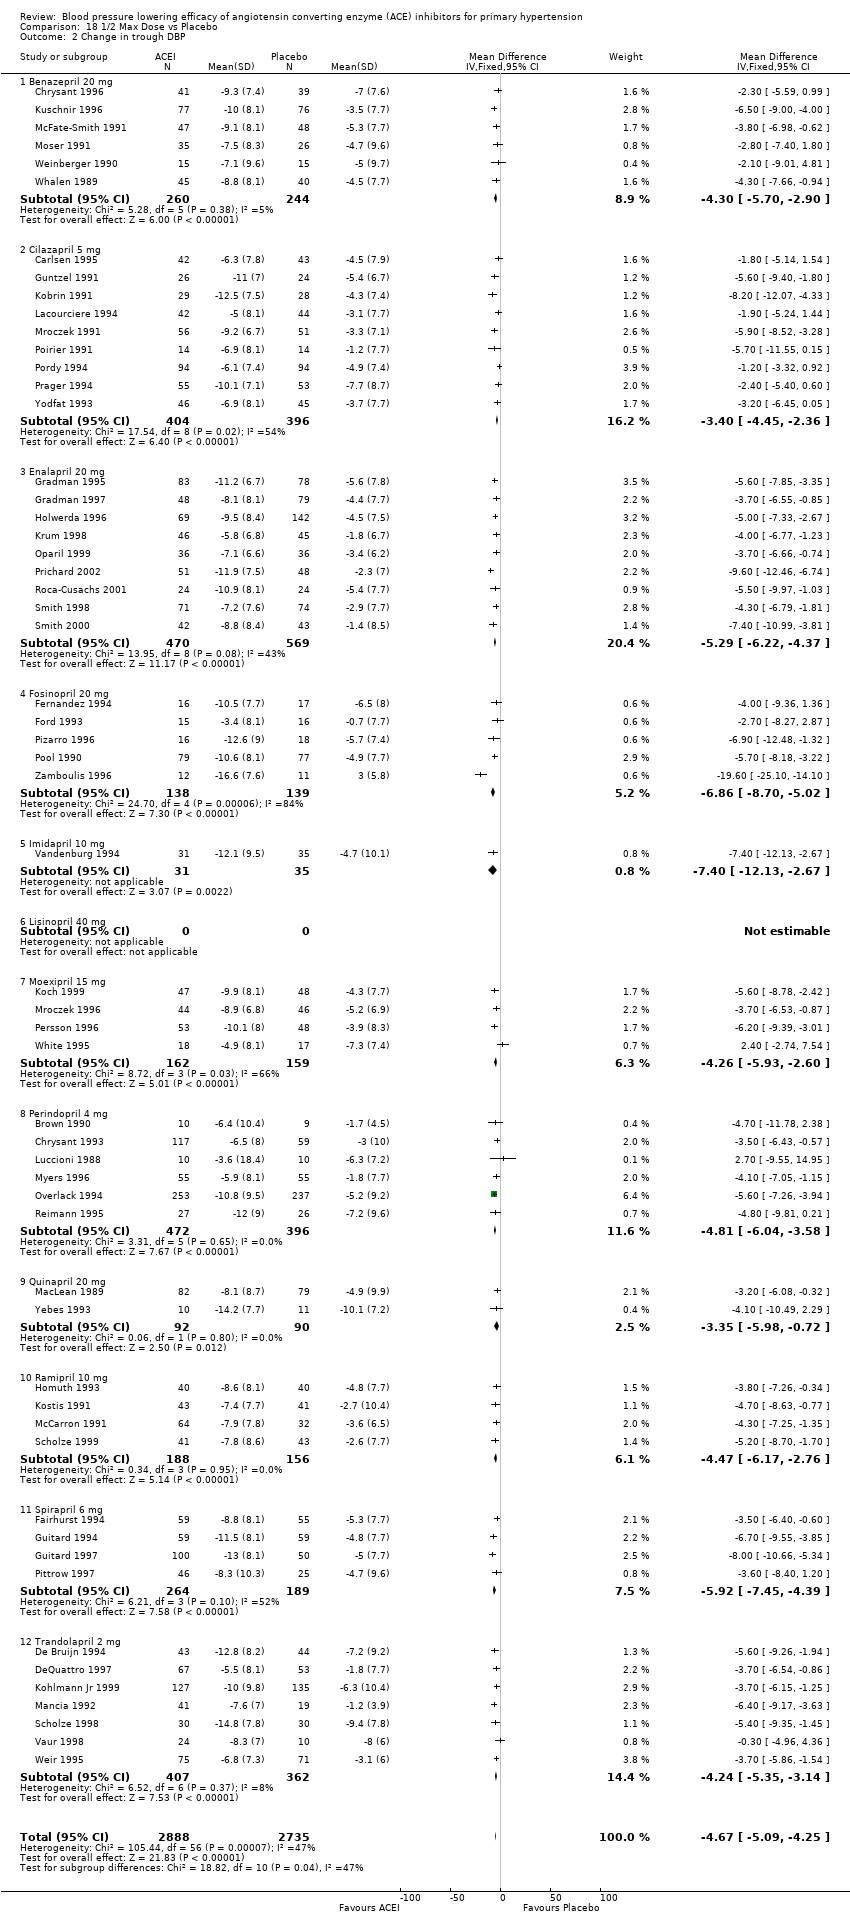
Comparison 18 1/2 Max Dose vs Placebo, Outcome 2 Change in trough DBP.

Comparison 19 Max Dose vs Placebo, Outcome 1 Change in trough SBP.
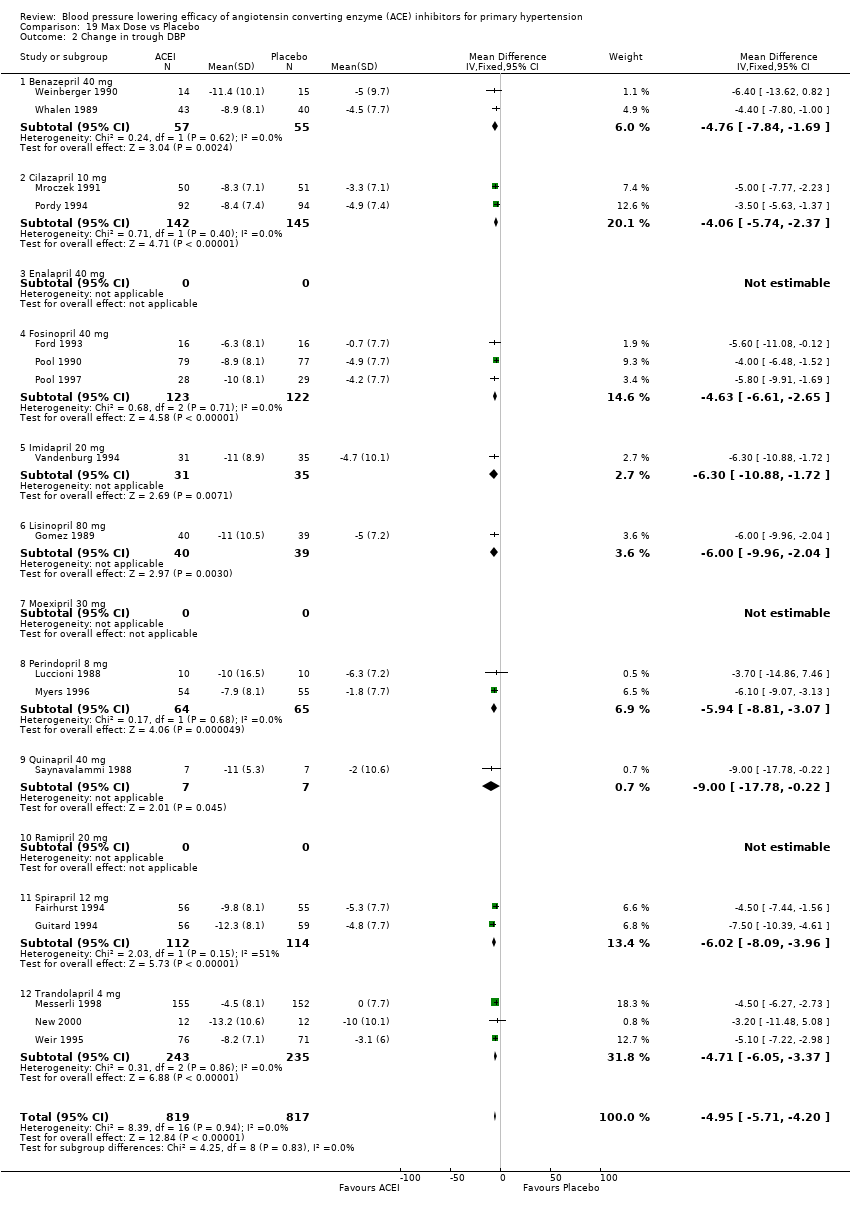
Comparison 19 Max Dose vs Placebo, Outcome 2 Change in trough DBP.
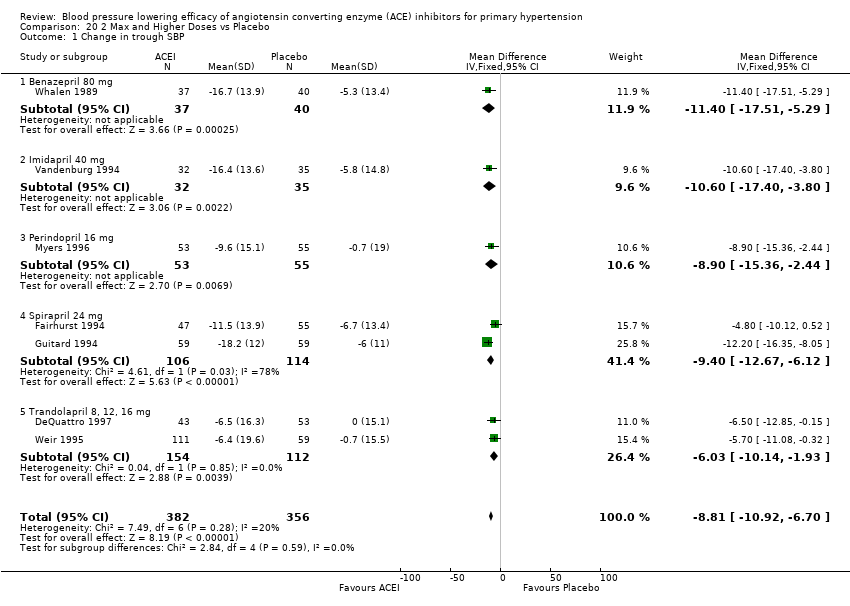
Comparison 20 2 Max and Higher Doses vs Placebo, Outcome 1 Change in trough SBP.

Comparison 20 2 Max and Higher Doses vs Placebo, Outcome 2 Change in trough DBP.

Comparison 21 1/2 Max and Higher Doses vs Placebo, Outcome 1 Change in trough SBP.

Comparison 21 1/2 Max and Higher Doses vs Placebo, Outcome 2 Change in trough DBP.
![Comparison 22 ACE Inhibitors vs Placebo, Outcome 1 Change in peak SBP [1/2 Max and Higher Doses Only].](/es/cdsr/doi/10.1002/14651858.CD003823.pub2/media/CDSR/CD003823/image_n/nCD003823-CMP-022-01.png)
Comparison 22 ACE Inhibitors vs Placebo, Outcome 1 Change in peak SBP [1/2 Max and Higher Doses Only].
![Comparison 22 ACE Inhibitors vs Placebo, Outcome 2 Change in peak DBP [1/2 Max and Higher Doses Only].](/es/cdsr/doi/10.1002/14651858.CD003823.pub2/media/CDSR/CD003823/image_n/nCD003823-CMP-022-02.png)
Comparison 22 ACE Inhibitors vs Placebo, Outcome 2 Change in peak DBP [1/2 Max and Higher Doses Only].
![Comparison 22 ACE Inhibitors vs Placebo, Outcome 3 Change in peak SBP [All Doses].](/es/cdsr/doi/10.1002/14651858.CD003823.pub2/media/CDSR/CD003823/image_n/nCD003823-CMP-022-03.png)
Comparison 22 ACE Inhibitors vs Placebo, Outcome 3 Change in peak SBP [All Doses].
![Comparison 22 ACE Inhibitors vs Placebo, Outcome 4 Change in peak DBP [All Doses].](/es/cdsr/doi/10.1002/14651858.CD003823.pub2/media/CDSR/CD003823/image_n/nCD003823-CMP-022-04.png)
Comparison 22 ACE Inhibitors vs Placebo, Outcome 4 Change in peak DBP [All Doses].
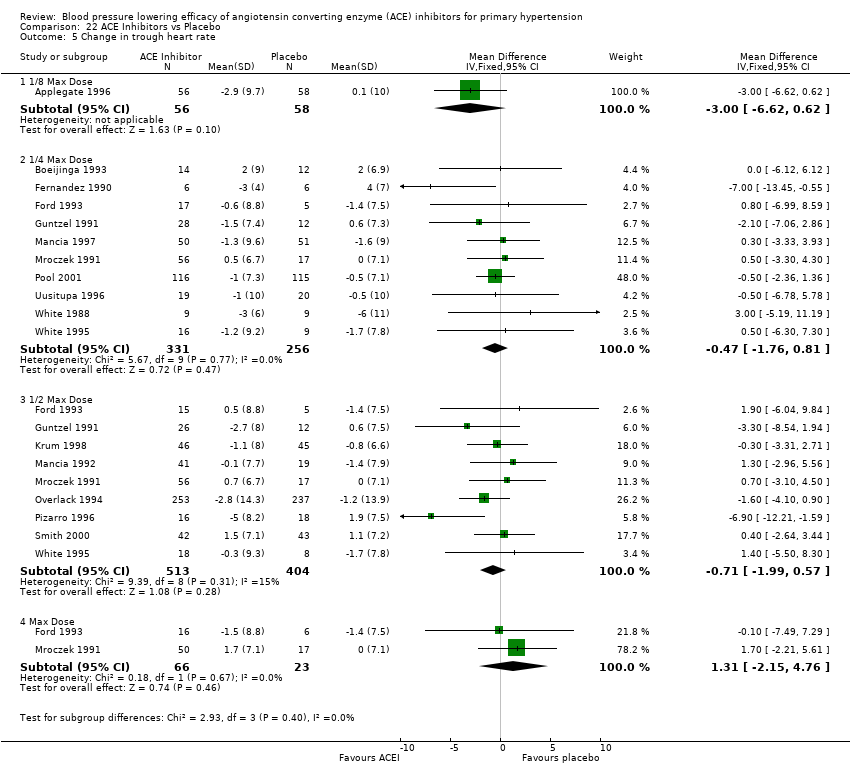
Comparison 22 ACE Inhibitors vs Placebo, Outcome 5 Change in trough heart rate.
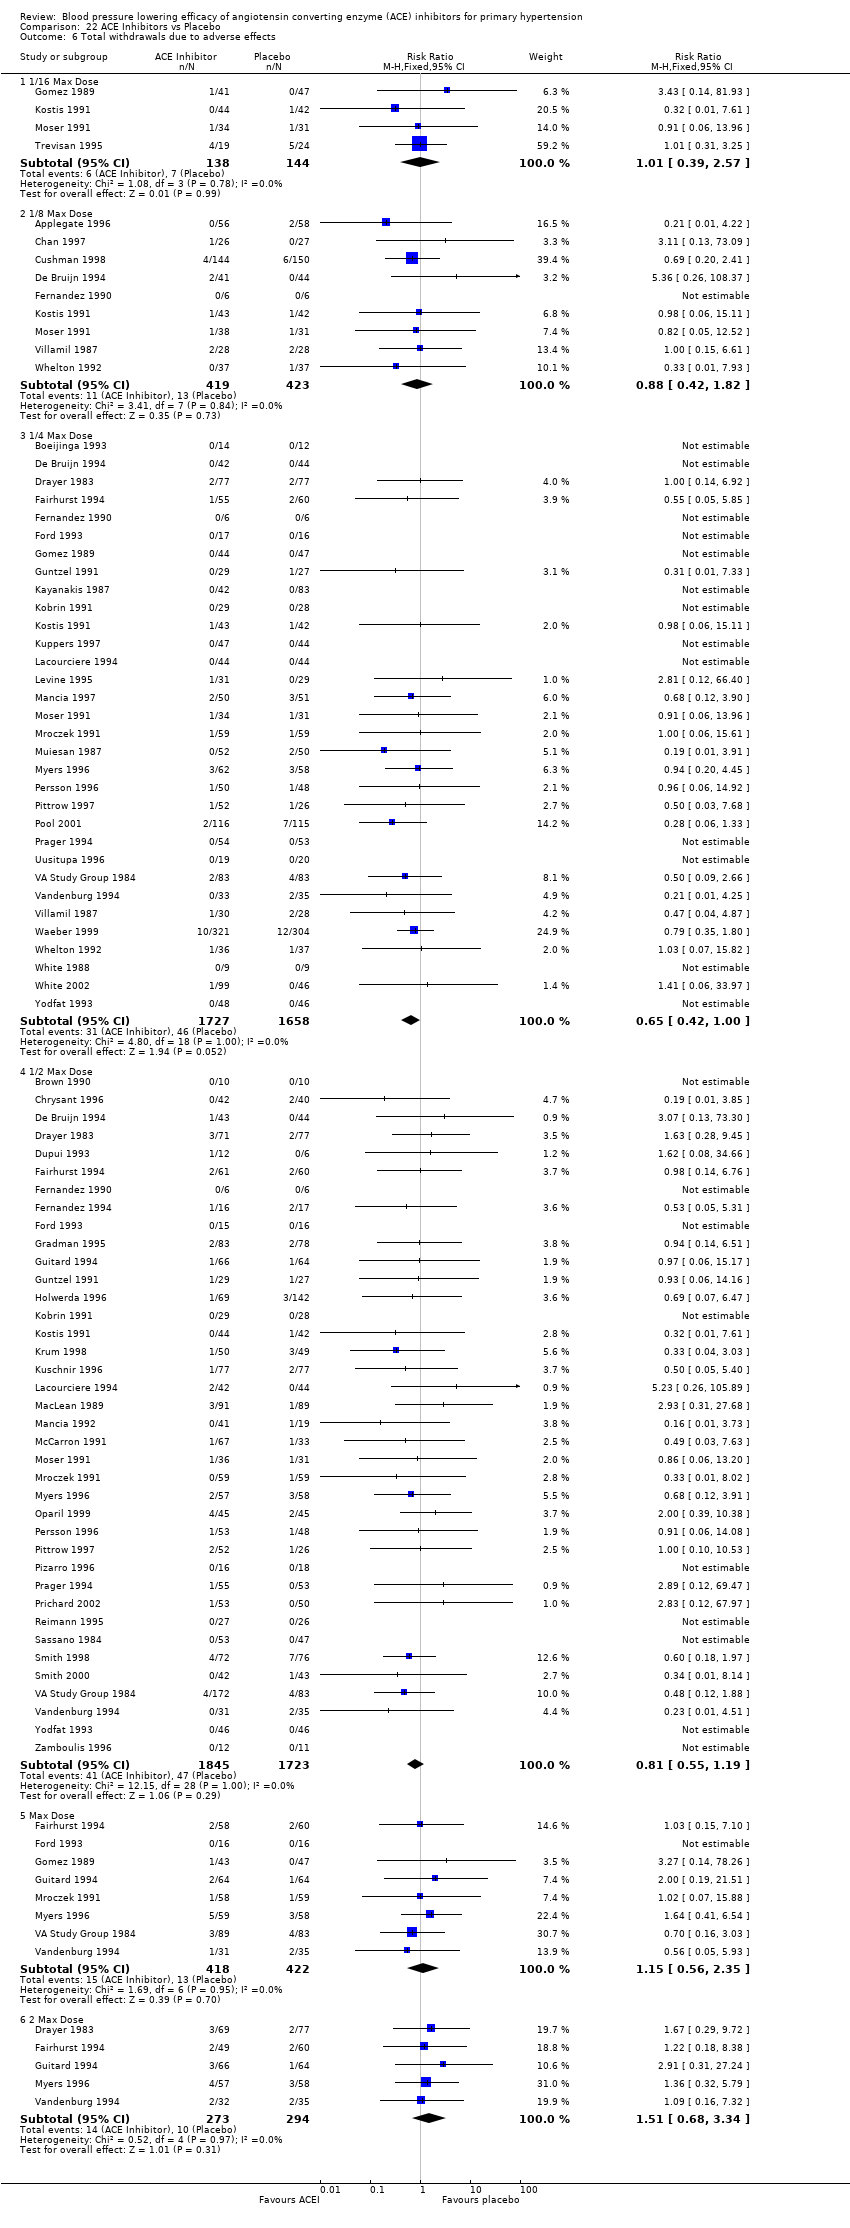
Comparison 22 ACE Inhibitors vs Placebo, Outcome 6 Total withdrawals due to adverse effects.
| ACE inhibitor | Dose range (mg/day) | Number of studies | ACEI patients (n) | Placebo patients (n) | Mean duration (wks) | Mean age (yrs) | Baseline BP (mm Hg) | Baseline PP (mm Hg) |
| Benazepril | 2 ‐ 80 | 7 | 591 | 335 | 6.0 | 56.3 | 159.5/103.5 | 56.0 |
| Captopril | 37.5 ‐ 200 | 6 | 660 | 383 | 6.5 | 54.9 | 155.0/100.1 | 54.9 |
| Cilazapril | 0.5 ‐ 10 | 14 | 1054 | 448 | 4.9 | 53.3 | 153.5/101.0 | 52.5 |
| Enalapril | 5 ‐ 20 | 19 | 1477 | 1331 | 6.5 | 54.2 | 157.5/100.5 | 57.0 |
| Fosinopril | 2.5 ‐ 40 | 6 | 481 | 168 | 5.0 | 52.5 | 152.1/101.2 | 50.9 |
| Imidapril | 5 ‐ 40 | 1 | 127 | 35 | 4.0 | 51.9 | 160.7/101.5 | 59.2 |
| Lisinopril | 1.25 ‐ 80 | 5 | 484 | 357 | 5.7 | 55.2 | 154.5/101.8 | 52.7 |
| Moexipril | 7.5 ‐ 15 | 4 | 274 | 159 | 10.7 | 60.5 | 160.4/101.7 | 58.7 |
| Perindopril | 2 ‐ 16 | 6 | 658 | 396 | 7.1 | 55.9 | 159.4/99.9 | 59.5 |
| Quinapril | 20 | 3 | 99 | 97 | 4.0 | 52.6 | 161.7/105.6 | 56.1 |
| Ramipril | 1.25 ‐ 10 | 6 | 548 | 199 | 6.6 | 51.2 | 156.6/100.9 | 55.7 |
| Spirapril | 3 ‐24 | 4 | 586 | 189 | 5.6 | 52.3 | 164.3/103.5 | 60.8 |
| Temocapril | 20 | 1 | 19 | 11 | 6.0 | 57.0 | 158.0/97.6 | 60.4 |
| Trandolapril | 0.25 ‐ 16 | 10 | 1152 | 636 | 6.1 | 53.4 | 155.4/100.7 | 54.7 |
| TOTAL | 92 | 8210 | 4744 | 6.2 | 54.4 | 157.1/101.2 | 55.9 |
| ACE Inhibitor | Lowest effective dose (mg/day) | Lowest dose with near maximal BP lowering (mg/day) | Near maximal trough SBP lowering (mm Hg), 95% CI | Near maximal trough DBP lowering (mm Hg), 95% CI |
| benazepril | 20 | 20 | ‐8.70 (‐11.43, ‐5.97) | ‐4.92 (‐6.47, ‐3.36) |
| captopril | 37.5 | 37.5 | ‐9.68 (‐11.73, ‐7.63) | ‐5.43 (‐6.47, ‐4.40) |
| cilazapril | 2.5 | 2.5 | ‐5.58 (‐7.84, ‐3.32) | ‐3.50 (‐4.40, ‐2.60) |
| enalapril | 5 | 20 | ‐8.66 (‐10.48, ‐6.84) | ‐4.80 (‐5.81, ‐3.79) |
| fosinopril | 10‐20 | 20 | ‐7.62 (‐11.07, ‐4.17) | ‐5.00 (‐6.94, ‐3.05) |
| imidapril | Not estimable | Not estimable | ‐9.30 (‐14.83, ‐3.78) | ‐5.76 (‐9.44, ‐2.07) |
| lisinopril | 10 | 10 | ‐8.00 (‐10.14, ‐5.85) | ‐4.76 (‐5.92, ‐3.60) |
| moexipril | 15 | Not estimable | ‐8.45 (‐11.99, ‐4.91) | ‐4.38 (‐6.29, ‐2.46) |
| perindopril | 4 | 4 | ‐7.09 (‐9.56, ‐4.61) | ‐5.02 (‐6.22, ‐3.82) |
| quinapril | Not estimable | Not estimable | ‐7.05 (‐11.26, ‐2.84) | ‐3.35 (‐5.98, ‐0.72) |
| ramipril | 5 | 5 | ‐6.29 (‐9.26, ‐3.32) | ‐4.14 (‐5.81, ‐2.48) |
| spirapril | 3‐6 | 6 | ‐8.54 (‐11.18, ‐5.89) | ‐6.08( ‐7.50, ‐4.66) |
| temocapril | Not estimable | Not estimable | ‐10.00 (‐23.87, 3.87) | ‐5.00 (‐13.34, 3.34) |
| trandolapril | 1 | 1 | ‐7.31 (‐8.85, ‐5.77) | ‐4.42 (‐5.24, ‐3.60) |
| ACE Inhibitor | Placebo | ||
| SBP | Weighted mean SD | 16.6 | 16.8 |
| SD of weighted mean SD | 3.1 | 3.0 | |
| Weighted mean SBP | 146.0 | 152.9 | |
| Weighted mean coefficient of variation (CV) | 11.2 | 11.0 | |
| SD of weighted mean CV | 2.1 | 2.0 | |
| Number of observations | 22 | 19 | |
| DBP | Weighted mean SD | 9.0 | 8.9 |
| SD of weighted mean SD | 1.7 | 1.8 | |
| Weighted mean DBP | 91.8 | 96.4 | |
| Weighted mean coefficient of variation (CV) | 9.8 | 9.2 | |
| SD of weighted mean CV | 1.8 | 1.9 | |
| Number of observations | 20 | 18 | |
| t‐test | SD of SBP vs SD of DBP | p < 0.0001 | p < 0.0001 |
| t‐test | CV SBP vs CV DBP | p = 0.0227 | p = 0.0045 |
| ACE Inhibitor | Placebo | ||
| Weighted mean SD of SBP | At baseline (SD) | 14.8 (3.0) | 14.9 (2.8) |
| At endpoint (SD) | 16.6 (3.1) | 16.8 (3.0) | |
| t‐test | baseline vs endpoint | p = 0.06 | p = 0.05 |
| Weighted mean SD of DBP | At baseline (SD) | 5.1 (1.5) | 5.1 (1.6) |
| At endpoint (SD) | 9.0 (1.7) | 8.9 (1.8) | |
| t‐test | baseline vs endpoint | p < 0.0001 | p < 0.0001 |
| Proportion of recommended maximum dose (Max) | Number of studies | Weighted mean change from baseline in pulse pressure (95% CI) | |
| ACE inhibitors | 1/8 Max | 18 | ‐1.2 (‐2.0, ‐0.4) |
| 1/4 Max | 40 | ‐1.8 (‐2.6, ‐0.9) | |
| 1/2 Max | 50 | ‐2.5 (‐3.2, ‐1.9) | |
| Max | 16 | ‐3.7 (‐5.5, ‐1.9) | |
| 2 Max | 6 | ‐4.1 (‐6.3, ‐1.9) | |
| 1/2 Max and above | 54 | ‐2.9 (‐3.5, ‐2.3) | |
| Placebo | 74 | 0.6 (0.1, 1.1) |
| ACE Inhibitor | Lowest effective dose (mg/day) | Manufacturer's recommended starting dose (mg/day) | Lowest dose with near maximal BP lowering (mg/day) | Manufacturer's recommended maximum dose (mg/day) |
| benazepril | 20 | 10 | 20 | 40 |
| captopril | 37.5 | 50 | 37.5 | 150 |
| cilazapril | 2.5 | 2.5 | 2.5 | 10 |
| enalapril | 5 | 5 | 20 | 40 |
| fosinopril | 10‐20 | 10 | 20 | 40 |
| imidapril | Not estimable | 5 | Not estimable | 30 |
| lisinopril | 10 | 10 | 10 | 80 |
| moexipril | 15 | 7.5 | Not estimable | 30 |
| perindopril | 4 | 4 | 4 | 8 |
| quinapril | Not estimable | 10 | Not estimable | 40 |
| ramipril | 5 | 2.5 | 5 | 20 |
| temocapril | Not estimable | 1 | Not estimable | 4 |
| trandolapril | 1 | 1 | 1 | 4 |
| Outcome or subgroup title | No. of studies | No. of participants | Statistical method | Effect size |
| 1 Change in trough SBP Show forest plot | 7 | Mean Difference (IV, Fixed, 95% CI) | Subtotals only | |
| 1.1 2 mg | 1 | 36 | Mean Difference (IV, Fixed, 95% CI) | 0.20 [‐11.87, 12.27] |
| 1.2 4 mg | 1 | 71 | Mean Difference (IV, Fixed, 95% CI) | ‐5.5 [‐12.17, 1.17] |
| 1.3 5 mg | 2 | 60 | Mean Difference (IV, Fixed, 95% CI) | ‐6.52 [‐16.09, 3.06] |
| 1.4 10 mg | 3 | 284 | Mean Difference (IV, Fixed, 95% CI) | ‐2.68 [‐5.98, 0.61] |
| 1.5 20 mg | 6 | 422 | Mean Difference (IV, Fixed, 95% CI) | ‐8.30 [‐11.14, ‐5.46] |
| 1.6 40 mg (Max Dose) | 2 | 74 | Mean Difference (IV, Fixed, 95% CI) | ‐8.68 [‐14.00, ‐1.35] |
| 1.7 80 mg | 1 | 50 | Mean Difference (IV, Fixed, 95% CI) | ‐11.40 [‐19.95, ‐2.85] |
| 2 Change in trough DBP Show forest plot | 7 | Mean Difference (IV, Fixed, 95% CI) | Subtotals only | |
| 2.1 2 mg | 1 | 36 | Mean Difference (IV, Fixed, 95% CI) | 1.1 [‐6.54, 8.74] |
| 2.2 4 mg | 1 | 71 | Mean Difference (IV, Fixed, 95% CI) | ‐4.10 [‐7.95, ‐0.25] |
| 2.3 5 mg | 2 | 60 | Mean Difference (IV, Fixed, 95% CI) | ‐2.04 [‐8.60, 4.53] |
| 2.4 10 mg | 3 | 283 | Mean Difference (IV, Fixed, 95% CI) | ‐0.72 [‐2.67, 1.22] |
| 2.5 20 mg | 6 | 422 | Mean Difference (IV, Fixed, 95% CI) | ‐4.53 [‐6.14, ‐2.93] |
| 2.6 40 mg (Max Dose) | 2 | 74 | Mean Difference (IV, Fixed, 95% CI) | ‐4.73 [‐9.15, ‐0.31] |
| 2.7 80 mg | 1 | 51 | Mean Difference (IV, Fixed, 95% CI) | ‐6.80 [‐11.60, 0.00] |
| Outcome or subgroup title | No. of studies | No. of participants | Statistical method | Effect size |
| 1 Change in SBP Show forest plot | 5 | Mean Difference (IV, Fixed, 95% CI) | Subtotals only | |
| 1.1 37.5 mg | 1 | 111 | Mean Difference (IV, Fixed, 95% CI) | ‐8.6 [‐14.95, ‐2.25] |
| 1.2 50 mg | 3 | 324 | Mean Difference (IV, Fixed, 95% CI) | ‐8.25 [‐11.34, ‐5.16] |
| 1.3 75 mg | 2 | 124 | Mean Difference (IV, Fixed, 95% CI) | ‐9.16 [‐15.09, ‐3.23] |
| 1.4 100 mg | 1 | 96 | Mean Difference (IV, Fixed, 95% CI) | ‐12.0 [‐18.17, ‐5.83] |
| 1.5 150 mg (Max Dose) | 1 | 117 | Mean Difference (IV, Fixed, 95% CI) | ‐12.0 [‐18.06, ‐5.94] |
| 1.6 200 mg | 1 | 94 | Mean Difference (IV, Fixed, 95% CI) | ‐12.20 [‐18.32, ‐6.08] |
| 2 Change in DBP Show forest plot | 6 | Mean Difference (IV, Fixed, 95% CI) | Subtotals only | |
| 2.1 37.5 mg | 1 | 111 | Mean Difference (IV, Fixed, 95% CI) | ‐5.40 [‐8.74, ‐2.06] |
| 2.2 50 mg | 4 | 500 | Mean Difference (IV, Fixed, 95% CI) | ‐4.58 [‐6.02, ‐3.15] |
| 2.3 75 mg | 2 | 124 | Mean Difference (IV, Fixed, 95% CI) | ‐5.92 [‐9.16, ‐2.68] |
| 2.4 100 mg | 1 | 97 | Mean Difference (IV, Fixed, 95% CI) | ‐6.4 [‐9.91, ‐2.89] |
| 2.5 150 mg (Max Dose) | 1 | 117 | Mean Difference (IV, Fixed, 95% CI) | ‐7.3 [‐10.43, ‐4.17] |
| 2.6 200 mg | 1 | 94 | Mean Difference (IV, Fixed, 95% CI) | ‐6.70 [‐10.23, ‐3.17] |
| Outcome or subgroup title | No. of studies | No. of participants | Statistical method | Effect size |
| 1 Change in trough SBP Show forest plot | 9 | Mean Difference (IV, Fixed, 95% CI) | Subtotals only | |
| 1.1 2.5 mg | 9 | 361 | Mean Difference (IV, Fixed, 95% CI) | ‐5.16 [‐8.32, 0.00] |
| 1.2 5 mg | 5 | 277 | Mean Difference (IV, Fixed, 95% CI) | ‐5.75 [‐9.38, ‐2.12] |
| 1.3 10 mg (Max Dose) | 1 | 67 | Mean Difference (IV, Fixed, 95% CI) | ‐7.0 [‐14.07, 0.07] |
| 2 Change in trough DBP Show forest plot | 14 | Mean Difference (IV, Fixed, 95% CI) | Subtotals only | |
| 2.1 0.5 mg | 1 | 129 | Mean Difference (IV, Fixed, 95% CI) | ‐0.5 [‐3.45, 2.45] |
| 2.2 1 mg | 1 | 56 | Mean Difference (IV, Fixed, 95% CI) | 1.1 [‐3.66, 5.86] |
| 2.3 2.5 mg | 13 | 558 | Mean Difference (IV, Fixed, 95% CI) | ‐3.32 [‐4.70, ‐1.94] |
| 2.4 5 mg | 9 | 569 | Mean Difference (IV, Fixed, 95% CI) | ‐3.49 [‐4.87, ‐2.11] |
| 2.5 10 mg (Max Dose) | 2 | 190 | Mean Difference (IV, Fixed, 95% CI) | ‐4.06 [‐6.44, ‐1.67] |
| Outcome or subgroup title | No. of studies | No. of participants | Statistical method | Effect size |
| 1 Change in trough SBP Show forest plot | 17 | Mean Difference (IV, Fixed, 95% CI) | Subtotals only | |
| 1.1 5 mg | 4 | 552 | Mean Difference (IV, Fixed, 95% CI) | ‐5.56 [‐7.95, ‐3.18] |
| 1.2 10 mg | 8 | 1122 | Mean Difference (IV, Fixed, 95% CI) | ‐5.42 [‐5.00, ‐3.84] |
| 1.3 20 mg | 8 | 911 | Mean Difference (IV, Fixed, 95% CI) | ‐9.61 [‐11.35, ‐7.86] |
| 2 Change in trough DBP Show forest plot | 19 | Mean Difference (IV, Fixed, 95% CI) | Subtotals only | |
| 2.1 5 mg | 5 | 702 | Mean Difference (IV, Fixed, 95% CI) | ‐2.46 [‐3.67, ‐1.25] |
| 2.2 10 mg | 8 | 1122 | Mean Difference (IV, Fixed, 95% CI) | ‐3.10 [‐3.99, ‐2.20] |
| 2.3 20 mg | 9 | 984 | Mean Difference (IV, Fixed, 95% CI) | ‐5.34 [‐6.29, ‐4.38] |
| Outcome or subgroup title | No. of studies | No. of participants | Statistical method | Effect size |
| 1 Change in trough SBP Show forest plot | 6 | Mean Difference (IV, Fixed, 95% CI) | Subtotals only | |
| 1.1 2.5 mg | 1 | 38 | Mean Difference (IV, Fixed, 95% CI) | ‐2.9 [‐13.01, 7.21] |
| 1.2 5 mg | 1 | 94 | Mean Difference (IV, Fixed, 95% CI) | ‐3.70 [‐10.37, 2.97] |
| 1.3 10 mg | 3 | 151 | Mean Difference (IV, Fixed, 95% CI) | ‐3.86 [‐9.03, 1.30] |
| 1.4 20 mg | 5 | 208 | Mean Difference (IV, Fixed, 95% CI) | ‐9.26 [‐13.72, ‐4.79] |
| 1.5 40 mg (Max Dose) | 3 | 158 | Mean Difference (IV, Fixed, 95% CI) | ‐7.81 [‐12.91, ‐2.72] |
| 2 Change in trough DBP Show forest plot | 6 | Mean Difference (IV, Fixed, 95% CI) | Subtotals only | |
| 2.1 2.5 mg | 1 | 39 | Mean Difference (IV, Fixed, 95% CI) | ‐0.70 [‐6.31, 4.91] |
| 2.2 5 mg | 1 | 93 | Mean Difference (IV, Fixed, 95% CI) | ‐3.20 [‐7.12, 0.72] |
| 2.3 10 mg | 3 | 151 | Mean Difference (IV, Fixed, 95% CI) | ‐3.45 [‐6.42, ‐0.47] |
| 2.4 20 mg | 5 | 209 | Mean Difference (IV, Fixed, 95% CI) | ‐7.79 [‐10.12, ‐5.46] |
| 2.5 40 mg (Max Dose) | 3 | 157 | Mean Difference (IV, Fixed, 95% CI) | ‐4.73 [‐7.69, ‐1.76] |
| Outcome or subgroup title | No. of studies | No. of participants | Statistical method | Effect size |
| 1 Change in trough SBP Show forest plot | 1 | Mean Difference (IV, Fixed, 95% CI) | Subtotals only | |
| 1.1 5 mg | 1 | 41 | Mean Difference (IV, Fixed, 95% CI) | ‐4.90 [‐15.96, 6.16] |
| 1.2 10 mg | 1 | 40 | Mean Difference (IV, Fixed, 95% CI) | ‐8.90 [‐20.02, 2.22] |
| 1.3 20 mg (Max Dose) | 1 | 40 | Mean Difference (IV, Fixed, 95% CI) | ‐12.90 [‐24.22, ‐1.58] |
| 1.4 40 mg | 1 | 41 | Mean Difference (IV, Fixed, 95% CI) | ‐10.60 [‐21.36, 0.16] |
| 2 Change in trough DBP Show forest plot | 1 | Mean Difference (IV, Fixed, 95% CI) | Subtotals only | |
| 2.1 5 mg | 1 | 42 | Mean Difference (IV, Fixed, 95% CI) | ‐3.2 [‐10.28, 3.88] |
| 2.2 10 mg | 1 | 39 | Mean Difference (IV, Fixed, 95% CI) | ‐7.40 [‐15.16, 0.36] |
| 2.3 20 mg (Max Dose) | 1 | 40 | Mean Difference (IV, Fixed, 95% CI) | ‐6.3 [‐13.60, 1.00] |
| 2.4 40 mg | 1 | 41 | Mean Difference (IV, Fixed, 95% CI) | ‐6.50 [‐13.89, 0.89] |
| Outcome or subgroup title | No. of studies | No. of participants | Statistical method | Effect size |
| 1 Change in trough SBP Show forest plot | 5 | Mean Difference (IV, Fixed, 95% CI) | Subtotals only | |
| 1.1 1.25 mg | 1 | 46 | Mean Difference (IV, Fixed, 95% CI) | 3.2 [‐5.00, 13.40] |
| 1.2 5 mg | 1 | 47 | Mean Difference (IV, Fixed, 95% CI) | ‐2.0 [‐13.22, 9.22] |
| 1.3 10 mg | 4 | 648 | Mean Difference (IV, Fixed, 95% CI) | ‐7.75 [‐9.98, ‐5.51] |
| 1.4 20 mg | 1 | 50 | Mean Difference (IV, Fixed, 95% CI) | ‐7.80 [‐18.67, 3.07] |
| 1.5 80 mg (Max Dose) | 1 | 50 | Mean Difference (IV, Fixed, 95% CI) | ‐13.8 [‐24.46, ‐3.14] |
| 2 Change in trough DBP Show forest plot | 5 | Mean Difference (IV, Fixed, 95% CI) | Subtotals only | |
| 2.1 1.25 mg | 1 | 46 | Mean Difference (IV, Fixed, 95% CI) | 2.8 [‐2.34, 7.94] |
| 2.2 5 mg | 1 | 47 | Mean Difference (IV, Fixed, 95% CI) | 0.0 [‐5.32, 5.32] |
| 2.3 10 mg | 4 | 648 | Mean Difference (IV, Fixed, 95% CI) | ‐4.71 [‐5.92, ‐3.50] |
| 2.4 20 mg | 1 | 51 | Mean Difference (IV, Fixed, 95% CI) | ‐4.6 [‐10.17, 0.97] |
| 2.5 80 mg (Max Dose) | 1 | 49 | Mean Difference (IV, Fixed, 95% CI) | ‐6.00 [‐11.72, ‐0.28] |
| Outcome or subgroup title | No. of studies | No. of participants | Statistical method | Effect size |
| 1 Change in trough SBP Show forest plot | 4 | Mean Difference (IV, Fixed, 95% CI) | Subtotals only | |
| 1.1 7.5 mg | 3 | 168 | Mean Difference (IV, Fixed, 95% CI) | ‐1.83 [‐6.71, 3.05] |
| 1.2 15 mg | 4 | 265 | Mean Difference (IV, Fixed, 95% CI) | ‐8.45 [‐11.99, ‐4.91] |
| 2 Change in trough DBP Show forest plot | 4 | Mean Difference (IV, Fixed, 95% CI) | Subtotals only | |
| 2.1 7.5 mg | 3 | 167 | Mean Difference (IV, Fixed, 95% CI) | ‐2.23 [‐4.63, 0.16] |
| 2.2 15 mg | 4 | 266 | Mean Difference (IV, Fixed, 95% CI) | ‐4.38 [‐6.29, ‐2.46] |
| Outcome or subgroup title | No. of studies | No. of participants | Statistical method | Effect size |
| 1 Change in trough SBP Show forest plot | 6 | Mean Difference (IV, Fixed, 95% CI) | Subtotals only | |
| 1.1 2 mg | 2 | 85 | Mean Difference (IV, Fixed, 95% CI) | ‐3.24 [‐13.20, 6.72] |
| 1.2 4 mg | 6 | 820 | Mean Difference (IV, Fixed, 95% CI) | ‐6.76 [‐9.41, ‐4.12] |
| 1.3 8 mg (Max Dose) | 2 | 82 | Mean Difference (IV, Fixed, 95% CI) | ‐9.81 [‐19.32, ‐0.31] |
| 1.4 16 mg | 1 | 67 | Mean Difference (IV, Fixed, 95% CI) | ‐8.9 [‐19.65, 1.85] |
| 2 Change in trough DBP Show forest plot | 6 | Mean Difference (IV, Fixed, 95% CI) | Subtotals only | |
| 2.1 2 mg | 2 | 85 | Mean Difference (IV, Fixed, 95% CI) | ‐2.10 [‐6.40, 2.20] |
| 2.2 4 mg | 6 | 820 | Mean Difference (IV, Fixed, 95% CI) | ‐4.91 [‐6.21, ‐3.61] |
| 2.3 8 mg (Max Dose) | 2 | 82 | Mean Difference (IV, Fixed, 95% CI) | ‐5.81 [‐10.11, ‐1.52] |
| 2.4 16 mg | 1 | 67 | Mean Difference (IV, Fixed, 95% CI) | ‐5.50 [‐10.09, ‐0.91] |
| Outcome or subgroup title | No. of studies | No. of participants | Statistical method | Effect size |
| 1 Change in trough SBP Show forest plot | 3 | Mean Difference (IV, Fixed, 95% CI) | Subtotals only | |
| 1.1 20 mg | 3 | 196 | Mean Difference (IV, Fixed, 95% CI) | ‐5.87 [‐9.75, ‐1.99] |
| 2 Change in trough DBP Show forest plot | 3 | Mean Difference (IV, Fixed, 95% CI) | Subtotals only | |
| 2.1 20 mg | 3 | 196 | Mean Difference (IV, Fixed, 95% CI) | ‐3.26 [‐5.85, ‐0.68] |
| Outcome or subgroup title | No. of studies | No. of participants | Statistical method | Effect size |
| 1 Change in trough SBP Show forest plot | 6 | Mean Difference (IV, Fixed, 95% CI) | Subtotals only | |
| 1.1 1.25 mg | 2 | 98 | Mean Difference (IV, Fixed, 95% CI) | 4.06 [‐1.97, 10.08] |
| 1.2 2.5 mg | 4 | 197 | Mean Difference (IV, Fixed, 95% CI) | ‐4.38 [‐9.71, 0.95] |
| 1.3 5 mg | 4 | 195 | Mean Difference (IV, Fixed, 95% CI) | ‐7.47 [‐12.76, ‐2.19] |
| 1.4 10 mg | 4 | 257 | Mean Difference (IV, Fixed, 95% CI) | ‐5.74 [‐9.33, ‐2.16] |
| 2 Change in trough DBP Show forest plot | 6 | Mean Difference (IV, Fixed, 95% CI) | Subtotals only | |
| 2.1 1.25 mg | 2 | 97 | Mean Difference (IV, Fixed, 95% CI) | 1.78 [‐1.83, 5.39] |
| 2.2 2.5 mg | 4 | 195 | Mean Difference (IV, Fixed, 95% CI) | ‐2.39 [‐5.18, 0.39] |
| 2.3 5 mg | 4 | 197 | Mean Difference (IV, Fixed, 95% CI) | ‐3.70 [‐6.38, ‐1.02] |
| 2.4 10 mg | 4 | 258 | Mean Difference (IV, Fixed, 95% CI) | ‐4.42 [‐6.54, ‐2.30] |
| Outcome or subgroup title | No. of studies | No. of participants | Statistical method | Effect size |
| 1 Change in trough SBP Show forest plot | 3 | Mean Difference (IV, Fixed, 95% CI) | Subtotals only | |
| 1.1 3 mg | 2 | 130 | Mean Difference (IV, Fixed, 95% CI) | ‐4.09 [‐10.47, 2.29] |
| 1.2 6 mg | 3 | 210 | Mean Difference (IV, Fixed, 95% CI) | ‐7.66 [‐11.93, ‐3.40] |
| 1.3 12 mg (Max Dose) | 2 | 146 | Mean Difference (IV, Fixed, 95% CI) | ‐8.46 [‐13.27, ‐3.66] |
| 1.4 24 mg | 2 | 139 | Mean Difference (IV, Fixed, 95% CI) | ‐9.67 [‐14.39, ‐4.95] |
| 2 Change in trough DBP Show forest plot | 4 | Mean Difference (IV, Fixed, 95% CI) | Subtotals only | |
| 2.1 3 mg | 2 | 130 | Mean Difference (IV, Fixed, 95% CI) | ‐3.91 [‐7.52, ‐0.29] |
| 2.2 6 mg | 4 | 359 | Mean Difference (IV, Fixed, 95% CI) | ‐6.52 [‐8.42, ‐4.62] |
| 2.3 12 mg (Max Dose) | 2 | 146 | Mean Difference (IV, Fixed, 95% CI) | ‐6.20 [‐9.20, ‐3.20] |
| 2.4 24 mg | 2 | 140 | Mean Difference (IV, Fixed, 95% CI) | ‐4.84 [‐7.86, ‐1.83] |
| Outcome or subgroup title | No. of studies | No. of participants | Statistical method | Effect size |
| 1 Change in trough SBP Show forest plot | 1 | Mean Difference (IV, Fixed, 95% CI) | Subtotals only | |
| 1.1 20 mg | 1 | 30 | Mean Difference (IV, Fixed, 95% CI) | ‐10.0 [‐23.87, 3.87] |
| 2 Change in trough DBP Show forest plot | 1 | Mean Difference (IV, Fixed, 95% CI) | Subtotals only | |
| 2.1 20 mg | 1 | 30 | Mean Difference (IV, Fixed, 95% CI) | ‐5.0 [‐13.34, 3.34] |
| Outcome or subgroup title | No. of studies | No. of participants | Statistical method | Effect size |
| 1 Change in trough SBP Show forest plot | 10 | Mean Difference (IV, Fixed, 95% CI) | Subtotals only | |
| 1.1 0.25 mg | 1 | 35 | Mean Difference (IV, Fixed, 95% CI) | ‐2.7 [‐13.26, 7.86] |
| 1.2 0.5 mg | 4 | 185 | Mean Difference (IV, Fixed, 95% CI) | ‐3.33 [‐6.00, 1.33] |
| 1.3 1 mg | 4 | 294 | Mean Difference (IV, Fixed, 95% CI) | ‐8.45 [‐11.84, ‐5.06] |
| 1.4 2 mg | 7 | 636 | Mean Difference (IV, Fixed, 95% CI) | ‐6.21 [‐8.76, ‐3.66] |
| 1.5 4 mg (Max Dose) | 3 | 430 | Mean Difference (IV, Fixed, 95% CI) | ‐8.15 [‐10.82, ‐5.49] |
| 1.6 8 mg | 2 | 111 | Mean Difference (IV, Fixed, 95% CI) | ‐5.74 [‐12.52, 1.05] |
| 1.7 12 mg | 1 | 49 | Mean Difference (IV, Fixed, 95% CI) | ‐5.7 [‐16.60, 5.20] |
| 1.8 16 mg | 1 | 48 | Mean Difference (IV, Fixed, 95% CI) | ‐7.10 [‐17.36, 3.16] |
| 2 Change in trough DBP Show forest plot | 10 | Mean Difference (IV, Fixed, 95% CI) | Subtotals only | |
| 2.1 0.25 mg | 1 | 35 | Mean Difference (IV, Fixed, 95% CI) | 0.6 [‐4.46, 5.66] |
| 2.2 0.5 mg | 4 | 184 | Mean Difference (IV, Fixed, 95% CI) | ‐2.33 [‐4.90, 0.24] |
| 2.3 1 mg | 4 | 294 | Mean Difference (IV, Fixed, 95% CI) | ‐4.07 [‐5.89, ‐2.25] |
| 2.4 2 mg | 7 | 637 | Mean Difference (IV, Fixed, 95% CI) | ‐4.24 [‐5.55, ‐2.94] |
| 2.5 4 mg (Max Dose) | 3 | 431 | Mean Difference (IV, Fixed, 95% CI) | ‐4.62 [‐6.10, ‐3.13] |
| 2.6 8 mg | 2 | 110 | Mean Difference (IV, Fixed, 95% CI) | ‐4.41 [‐7.82, ‐1.01] |
| 2.7 12 mg | 1 | 49 | Mean Difference (IV, Fixed, 95% CI) | ‐6.2 [‐11.78, ‐0.62] |
| 2.8 16 mg | 1 | 48 | Mean Difference (IV, Fixed, 95% CI) | ‐6.2 [‐11.38, ‐1.02] |
| Outcome or subgroup title | No. of studies | No. of participants | Statistical method | Effect size |
| 1 Change in trough SBP Show forest plot | 4 | 262 | Mean Difference (IV, Fixed, 95% CI) | ‐0.16 [‐3.78, 3.46] |
| 1.1 Fosinopril 2.5 mg | 1 | 58 | Mean Difference (IV, Fixed, 95% CI) | ‐2.9 [‐9.93, 4.13] |
| 1.2 Lisinopril 5 mg | 1 | 76 | Mean Difference (IV, Fixed, 95% CI) | ‐2.0 [‐9.79, 5.79] |
| 1.3 Ramipril 1.25 mg | 2 | 128 | Mean Difference (IV, Fixed, 95% CI) | 2.01 [‐3.02, 7.05] |
| 2 Change in trough DBP Show forest plot | 4 | 262 | Mean Difference (IV, Fixed, 95% CI) | 0.15 [‐1.86, 2.16] |
| 2.1 Fosinopril 2.5 mg | 1 | 58 | Mean Difference (IV, Fixed, 95% CI) | ‐0.70 [‐4.77, 3.37] |
| 2.2 Lisinopril 5 mg | 1 | 76 | Mean Difference (IV, Fixed, 95% CI) | 0.0 [‐3.68, 3.68] |
| 2.3 Ramipril 1.25 mg | 2 | 128 | Mean Difference (IV, Fixed, 95% CI) | 0.70 [‐2.28, 3.67] |
| Outcome or subgroup title | No. of studies | No. of participants | Statistical method | Effect size |
| 1 Change in trough SBP Show forest plot | 18 | 2025 | Mean Difference (IV, Fixed, 95% CI) | ‐5.70 [‐6.95, ‐4.45] |
| 1.1 Benazepril 5 mg | 2 | 91 | Mean Difference (IV, Fixed, 95% CI) | ‐6.39 [‐12.32, ‐0.47] |
| 1.2 Enalapril 5 mg | 4 | 607 | Mean Difference (IV, Fixed, 95% CI) | ‐5.12 [‐7.33, ‐2.92] |
| 1.3 Fosinopril 5 mg | 1 | 151 | Mean Difference (IV, Fixed, 95% CI) | ‐3.7 [‐8.06, 0.66] |
| 1.4 Lisinopril 10 mg | 4 | 648 | Mean Difference (IV, Fixed, 95% CI) | ‐7.75 [‐9.98, ‐5.51] |
| 1.5 Ramipril 2.5 mg | 4 | 292 | Mean Difference (IV, Fixed, 95% CI) | ‐4.52 [‐8.05, ‐0.98] |
| 1.6 Trandolapril 0.5 mg | 3 | 236 | Mean Difference (IV, Fixed, 95% CI) | ‐4.19 [‐7.91, ‐0.46] |
| 2 Change in trough DBP Show forest plot | 19 | 2176 | Mean Difference (IV, Fixed, 95% CI) | ‐3.19 [‐3.88, ‐2.51] |
| 2.1 Benazepril 5 mg | 2 | 91 | Mean Difference (IV, Fixed, 95% CI) | ‐1.92 [‐5.89, 2.05] |
| 2.2 Enalapril 5 mg | 5 | 758 | Mean Difference (IV, Fixed, 95% CI) | ‐2.37 [‐3.52, ‐1.23] |
| 2.3 Fosinopril 5 mg | 1 | 151 | Mean Difference (IV, Fixed, 95% CI) | ‐3.20 [‐5.72, ‐0.68] |
| 2.4 Lisinopril 10 mg | 4 | 648 | Mean Difference (IV, Fixed, 95% CI) | ‐4.71 [‐5.92, ‐3.50] |
| 2.5 Ramipril 2.5 mg | 4 | 292 | Mean Difference (IV, Fixed, 95% CI) | ‐2.50 [‐4.50, ‐0.51] |
| 2.6 Trandolapril 0.5 mg | 3 | 236 | Mean Difference (IV, Fixed, 95% CI) | ‐2.46 [‐4.59, ‐0.33] |
| Outcome or subgroup title | No. of studies | No. of participants | Statistical method | Effect size |
| 1 Change in trough SBP Show forest plot | 40 | 3523 | Mean Difference (IV, Fixed, 95% CI) | ‐5.14 [‐6.05, ‐4.22] |
| 1.1 Benazepril 10 mg | 3 | 314 | Mean Difference (IV, Fixed, 95% CI) | ‐2.88 [‐5.92, 0.15] |
| 1.2 Cilazapril 2.5 mg | 9 | 462 | Mean Difference (IV, Fixed, 95% CI) | ‐4.76 [‐7.34, ‐2.18] |
| 1.3 Enalapril 10 mg | 8 | 1138 | Mean Difference (IV, Fixed, 95% CI) | ‐5.40 [‐6.93, ‐3.87] |
| 1.4 Fosinopril 10 mg | 3 | 239 | Mean Difference (IV, Fixed, 95% CI) | ‐3.93 [‐7.39, ‐0.46] |
| 1.5 Imidapril 5 mg | 1 | 68 | Mean Difference (IV, Fixed, 95% CI) | ‐4.90 [‐11.31, 1.51] |
| 1.6 Lisinopril 20 mg | 1 | 80 | Mean Difference (IV, Fixed, 95% CI) | ‐7.8 [‐14.38, ‐1.22] |
| 1.7 Moexipril 7.5 mg | 3 | 223 | Mean Difference (IV, Fixed, 95% CI) | ‐1.86 [‐5.86, 2.14] |
| 1.8 Perindopril 2 mg | 2 | 134 | Mean Difference (IV, Fixed, 95% CI) | ‐3.02 [‐9.36, 3.31] |
| 1.9 Ramipril 5 mg | 4 | 291 | Mean Difference (IV, Fixed, 95% CI) | ‐7.19 [‐10.71, ‐3.67] |
| 1.10 Spirapril 3 mg | 2 | 184 | Mean Difference (IV, Fixed, 95% CI) | ‐4.02 [‐8.33, 0.28] |
| 1.11 Trandolapril 1 mg | 4 | 390 | Mean Difference (IV, Fixed, 95% CI) | ‐7.74 [‐10.34, ‐5.15] |
| 2 Change in trough DBP Show forest plot | 43 | 3758 | Mean Difference (IV, Fixed, 95% CI) | ‐3.04 [‐3.53, ‐2.54] |
| 2.1 Benazepril 10 mg | 3 | 314 | Mean Difference (IV, Fixed, 95% CI) | ‐0.89 [‐2.70, 0.93] |
| 2.2 Cilazapril 2.5 mg | 12 | 697 | Mean Difference (IV, Fixed, 95% CI) | ‐3.15 [‐4.29, 0.00] |
| 2.3 Enalapril 10 mg | 8 | 1138 | Mean Difference (IV, Fixed, 95% CI) | ‐3.11 [‐2.00, ‐2.23] |
| 2.4 Fosinopril 10 mg | 3 | 239 | Mean Difference (IV, Fixed, 95% CI) | ‐3.42 [‐5.43, ‐1.42] |
| 2.5 Imidapril 5 mg | 1 | 68 | Mean Difference (IV, Fixed, 95% CI) | ‐3.2 [‐7.41, 1.01] |
| 2.6 Lisinopril 20 mg | 1 | 80 | Mean Difference (IV, Fixed, 95% CI) | ‐4.6 [‐8.63, ‐0.57] |
| 2.7 Moexipril 7.5 mg | 3 | 223 | Mean Difference (IV, Fixed, 95% CI) | ‐2.18 [‐4.11, ‐0.24] |
| 2.8 Perindopril 2 mg | 2 | 134 | Mean Difference (IV, Fixed, 95% CI) | ‐2.31 [‐5.06, 0.45] |
| 2.9 Ramipril 5 mg | 4 | 291 | Mean Difference (IV, Fixed, 95% CI) | ‐3.65 [‐5.62, ‐1.67] |
| 2.10 Spirapril 3 mg | 2 | 184 | Mean Difference (IV, Fixed, 95% CI) | ‐4.20 [‐6.66, ‐1.74] |
| 2.11 Trandolapril 1 mg | 4 | 390 | Mean Difference (IV, Fixed, 95% CI) | ‐3.52 [‐4.92, ‐2.11] |
| Outcome or subgroup title | No. of studies | No. of participants | Statistical method | Effect size |
| 1 Change in trough SBP Show forest plot | 51 | 4980 | Mean Difference (IV, Fixed, 95% CI) | ‐7.60 [‐8.40, ‐6.79] |
| 1.1 Benazepril 20 mg | 6 | 504 | Mean Difference (IV, Fixed, 95% CI) | ‐7.97 [‐10.41, ‐5.52] |
| 1.2 Cilazapril 5 mg | 5 | 379 | Mean Difference (IV, Fixed, 95% CI) | ‐5.92 [‐8.70, ‐3.14] |
| 1.3 Enalapril 20 mg | 8 | 967 | Mean Difference (IV, Fixed, 95% CI) | ‐9.54 [‐11.22, ‐7.86] |
| 1.4 Fosinopril 20 mg | 5 | 277 | Mean Difference (IV, Fixed, 95% CI) | ‐8.99 [‐12.35, ‐5.62] |
| 1.5 Imidapril 10 mg | 1 | 66 | Mean Difference (IV, Fixed, 95% CI) | ‐8.90 [‐16.26, ‐1.54] |
| 1.6 Lisinopril 40 mg | 0 | 0 | Mean Difference (IV, Fixed, 95% CI) | 0.0 [0.0, 0.0] |
| 1.7 Moexipril 15 mg | 4 | 321 | Mean Difference (IV, Fixed, 95% CI) | ‐8.02 [‐11.16, ‐4.88] |
| 1.8 Perindopril 4 mg | 6 | 868 | Mean Difference (IV, Fixed, 95% CI) | ‐6.53 [‐9.04, ‐4.02] |
| 1.9 Quinapril 20 mg | 2 | 182 | Mean Difference (IV, Fixed, 95% CI) | ‐7.05 [‐11.26, ‐2.84] |
| 1.10 Ramipril 10 mg | 4 | 344 | Mean Difference (IV, Fixed, 95% CI) | ‐6.17 [‐9.07, ‐3.27] |
| 1.11 Spirapril 6 mg | 3 | 303 | Mean Difference (IV, Fixed, 95% CI) | ‐7.43 [‐10.41, ‐4.46] |
| 1.12 Trandolapril 2 mg | 7 | 769 | Mean Difference (IV, Fixed, 95% CI) | ‐6.17 [‐8.24, ‐4.10] |
| 2 Change in trough DBP Show forest plot | 57 | 5623 | Mean Difference (IV, Fixed, 95% CI) | ‐4.67 [‐5.09, ‐4.25] |
| 2.1 Benazepril 20 mg | 6 | 504 | Mean Difference (IV, Fixed, 95% CI) | ‐4.30 [‐5.70, ‐2.90] |
| 2.2 Cilazapril 5 mg | 9 | 800 | Mean Difference (IV, Fixed, 95% CI) | ‐3.40 [‐4.45, ‐2.36] |
| 2.3 Enalapril 20 mg | 9 | 1039 | Mean Difference (IV, Fixed, 95% CI) | ‐5.29 [‐6.22, ‐4.37] |
| 2.4 Fosinopril 20 mg | 5 | 277 | Mean Difference (IV, Fixed, 95% CI) | ‐6.86 [‐8.70, ‐5.02] |
| 2.5 Imidapril 10 mg | 1 | 66 | Mean Difference (IV, Fixed, 95% CI) | ‐7.40 [‐12.13, ‐2.67] |
| 2.6 Lisinopril 40 mg | 0 | 0 | Mean Difference (IV, Fixed, 95% CI) | 0.0 [0.0, 0.0] |
| 2.7 Moexipril 15 mg | 4 | 321 | Mean Difference (IV, Fixed, 95% CI) | ‐4.26 [‐5.93, ‐2.60] |
| 2.8 Perindopril 4 mg | 6 | 868 | Mean Difference (IV, Fixed, 95% CI) | ‐4.81 [‐6.04, ‐3.58] |
| 2.9 Quinapril 20 mg | 2 | 182 | Mean Difference (IV, Fixed, 95% CI) | ‐3.35 [‐5.98, ‐0.72] |
| 2.10 Ramipril 10 mg | 4 | 344 | Mean Difference (IV, Fixed, 95% CI) | ‐4.47 [‐6.17, ‐2.76] |
| 2.11 Spirapril 6 mg | 4 | 453 | Mean Difference (IV, Fixed, 95% CI) | ‐5.92 [‐7.45, ‐4.39] |
| 2.12 Trandolapril 2 mg | 7 | 769 | Mean Difference (IV, Fixed, 95% CI) | ‐4.24 [‐5.35, ‐3.14] |
| Outcome or subgroup title | No. of studies | No. of participants | Statistical method | Effect size |
| 1 Change in trough SBP Show forest plot | 16 | 1450 | Mean Difference (IV, Fixed, 95% CI) | ‐8.48 [‐9.91, ‐7.06] |
| 1.1 Benazepril 40 mg | 2 | 112 | Mean Difference (IV, Fixed, 95% CI) | ‐8.67 [‐13.73, ‐3.62] |
| 1.2 Cilazapril 10 mg | 1 | 101 | Mean Difference (IV, Fixed, 95% CI) | ‐7.0 [‐11.99, ‐2.01] |
| 1.3 Enalapril 40 mg | 0 | 0 | Mean Difference (IV, Fixed, 95% CI) | 0.0 [0.0, 0.0] |
| 1.4 Fosinopril 40 mg | 3 | 245 | Mean Difference (IV, Fixed, 95% CI) | ‐7.78 [‐11.20, ‐4.36] |
| 1.5 Imidapril 20 mg | 1 | 66 | Mean Difference (IV, Fixed, 95% CI) | ‐12.90 [‐20.56, ‐5.24] |
| 1.6 Lisinopril 80 mg | 1 | 79 | Mean Difference (IV, Fixed, 95% CI) | ‐13.8 [‐20.77, ‐6.83] |
| 1.7 Moexipril 30 mg | 0 | 0 | Mean Difference (IV, Fixed, 95% CI) | 0.0 [0.0, 0.0] |
| 1.8 Perindopril 8 mg | 2 | 129 | Mean Difference (IV, Fixed, 95% CI) | ‐10.09 [‐16.14, ‐4.05] |
| 1.9 Quinapril 40 mg | 1 | 14 | Mean Difference (IV, Fixed, 95% CI) | ‐6.0 [‐20.16, 8.16] |
| 1.10 Ramipril 20 mg | 0 | 0 | Mean Difference (IV, Fixed, 95% CI) | 0.0 [0.0, 0.0] |
| 1.11 Spirapril 12 mg | 2 | 226 | Mean Difference (IV, Fixed, 95% CI) | ‐8.23 [‐11.65, ‐4.82] |
| 1.12 Trandolapril 4 mg | 3 | 478 | Mean Difference (IV, Fixed, 95% CI) | ‐6.00 [‐10.41, ‐5.59] |
| 2 Change in trough DBP Show forest plot | 17 | 1636 | Mean Difference (IV, Fixed, 95% CI) | ‐4.95 [‐5.71, ‐4.20] |
| 2.1 Benazepril 40 mg | 2 | 112 | Mean Difference (IV, Fixed, 95% CI) | ‐4.76 [‐7.84, ‐1.69] |
| 2.2 Cilazapril 10 mg | 2 | 287 | Mean Difference (IV, Fixed, 95% CI) | ‐4.06 [‐5.74, ‐2.37] |
| 2.3 Enalapril 40 mg | 0 | 0 | Mean Difference (IV, Fixed, 95% CI) | 0.0 [0.0, 0.0] |
| 2.4 Fosinopril 40 mg | 3 | 245 | Mean Difference (IV, Fixed, 95% CI) | ‐4.63 [‐6.61, ‐2.65] |
| 2.5 Imidapril 20 mg | 1 | 66 | Mean Difference (IV, Fixed, 95% CI) | ‐6.3 [‐10.88, ‐1.72] |
| 2.6 Lisinopril 80 mg | 1 | 79 | Mean Difference (IV, Fixed, 95% CI) | ‐6.00 [‐9.96, ‐2.04] |
| 2.7 Moexipril 30 mg | 0 | 0 | Mean Difference (IV, Fixed, 95% CI) | 0.0 [0.0, 0.0] |
| 2.8 Perindopril 8 mg | 2 | 129 | Mean Difference (IV, Fixed, 95% CI) | ‐5.94 [‐8.81, ‐3.07] |
| 2.9 Quinapril 40 mg | 1 | 14 | Mean Difference (IV, Fixed, 95% CI) | ‐9.0 [‐17.78, ‐0.22] |
| 2.10 Ramipril 20 mg | 0 | 0 | Mean Difference (IV, Fixed, 95% CI) | 0.0 [0.0, 0.0] |
| 2.11 Spirapril 12 mg | 2 | 226 | Mean Difference (IV, Fixed, 95% CI) | ‐6.02 [‐8.09, ‐3.96] |
| 2.12 Trandolapril 4 mg | 3 | 478 | Mean Difference (IV, Fixed, 95% CI) | ‐4.71 [‐6.05, ‐3.37] |
| Outcome or subgroup title | No. of studies | No. of participants | Statistical method | Effect size |
| 1 Change in trough SBP Show forest plot | 7 | 738 | Mean Difference (IV, Fixed, 95% CI) | ‐8.81 [‐10.92, ‐6.70] |
| 1.1 Benazepril 80 mg | 1 | 77 | Mean Difference (IV, Fixed, 95% CI) | ‐11.40 [‐17.51, ‐5.29] |
| 1.2 Imidapril 40 mg | 1 | 67 | Mean Difference (IV, Fixed, 95% CI) | ‐10.60 [‐17.40, ‐3.80] |
| 1.3 Perindopril 16 mg | 1 | 108 | Mean Difference (IV, Fixed, 95% CI) | ‐8.9 [‐15.36, ‐2.44] |
| 1.4 Spirapril 24 mg | 2 | 220 | Mean Difference (IV, Fixed, 95% CI) | ‐9.40 [‐12.67, ‐6.12] |
| 1.5 Trandolapril 8, 12, 16 mg | 2 | 266 | Mean Difference (IV, Fixed, 95% CI) | ‐6.03 [‐10.14, ‐1.93] |
| 2 Change in trough DBP Show forest plot | 7 | 738 | Mean Difference (IV, Fixed, 95% CI) | ‐5.25 [‐6.45, ‐4.05] |
| 2.1 Benazepril 80 mg | 1 | 77 | Mean Difference (IV, Fixed, 95% CI) | ‐6.80 [‐10.34, ‐3.26] |
| 2.2 Imidapril 40 mg | 1 | 67 | Mean Difference (IV, Fixed, 95% CI) | ‐6.5 [‐11.22, ‐1.78] |
| 2.3 Perindopril 16 mg | 1 | 108 | Mean Difference (IV, Fixed, 95% CI) | ‐5.5 [‐8.48, ‐2.52] |
| 2.4 Spirapril 24 mg | 2 | 220 | Mean Difference (IV, Fixed, 95% CI) | ‐4.56 [‐6.66, ‐2.47] |
| 2.5 Trandolapril 8, 12, 16 mg | 2 | 266 | Mean Difference (IV, Fixed, 95% CI) | ‐5.02 [‐7.12, ‐2.93] |
| Outcome or subgroup title | No. of studies | No. of participants | Statistical method | Effect size |
| 1 Change in trough SBP Show forest plot | 53 | 6113 | Mean Difference (IV, Fixed, 95% CI) | ‐7.85 [‐8.60, ‐7.09] |
| 1.1 Benazepril 20, 40, 80 mg | 6 | 598 | Mean Difference (IV, Fixed, 95% CI) | ‐8.54 [‐10.87, ‐6.21] |
| 1.2 Cilazapril 5, 10 mg | 5 | 429 | Mean Difference (IV, Fixed, 95% CI) | ‐5.79 [‐8.46, ‐3.12] |
| 1.3 Enalapril 20, (40) mg | 8 | 967 | Mean Difference (IV, Fixed, 95% CI) | ‐9.54 [‐11.22, ‐7.86] |
| 1.4 Fosinopril 20, 40 mg | 4 | 359 | Mean Difference (IV, Fixed, 95% CI) | ‐7.44 [‐10.44, ‐4.44] |
| 1.5 Imidapril 10, 20, 40 mg | 1 | 129 | Mean Difference (IV, Fixed, 95% CI) | ‐10.8 [‐16.60, ‐5.00] |
| 1.6 Lisinopril (40), 80 mg | 1 | 50 | Mean Difference (IV, Fixed, 95% CI) | ‐13.8 [‐24.46, ‐3.14] |
| 1.7 Moexipril 15, (30) mg | 4 | 321 | Mean Difference (IV, Fixed, 95% CI) | ‐8.02 [‐11.16, ‐4.88] |
| 1.8 Perindopril 4, 8, 16 mg | 6 | 985 | Mean Difference (IV, Fixed, 95% CI) | ‐7.12 [‐9.55, ‐4.70] |
| 1.9 Quinapril 20, (40) mg | 2 | 182 | Mean Difference (IV, Fixed, 95% CI) | ‐7.05 [‐11.26, ‐2.84] |
| 1.10 Ramipril 10, (20) mg | 4 | 257 | Mean Difference (IV, Fixed, 95% CI) | ‐5.74 [‐9.33, ‐2.16] |
| 1.11 Spirapril 6, 12, 24 mg | 3 | 521 | Mean Difference (IV, Fixed, 95% CI) | ‐8.31 [‐10.80, ‐5.82] |
| 1.12 Trandolapril 2, 4, 8, 12, 16 mg | 9 | 1315 | Mean Difference (IV, Fixed, 95% CI) | ‐7.02 [‐8.70, ‐5.34] |
| 2 Change in trough DBP Show forest plot | 59 | 6861 | Mean Difference (IV, Fixed, 95% CI) | ‐4.73 [‐5.13, ‐4.34] |
| 2.1 Benazepril 20, 40, 80 mg | 6 | 598 | Mean Difference (IV, Fixed, 95% CI) | ‐4.56 [‐5.91, ‐3.22] |
| 2.2 Cilazapril 5, 10 mg | 9 | 942 | Mean Difference (IV, Fixed, 95% CI) | ‐3.58 [‐4.57, ‐2.60] |
| 2.3 Enalapril 20, (40) mg | 9 | 1039 | Mean Difference (IV, Fixed, 95% CI) | ‐5.29 [‐6.22, ‐4.37] |
| 2.4 Fosinopril 20, 40 mg | 4 | 359 | Mean Difference (IV, Fixed, 95% CI) | ‐5.15 [‐6.85, ‐3.45] |
| 2.5 Imidapril 10, 20, 40 mg | 1 | 129 | Mean Difference (IV, Fixed, 95% CI) | ‐6.7 [‐10.54, ‐2.86] |
| 2.6 Lisinopril (40), 80 mg | 1 | 79 | Mean Difference (IV, Fixed, 95% CI) | ‐6.00 [‐9.96, ‐2.04] |
| 2.7 Moexipril 15, (30) mg | 4 | 321 | Mean Difference (IV, Fixed, 95% CI) | ‐4.26 [‐5.93, ‐2.60] |
| 2.8 Perindopril 4, 8, 16 mg | 6 | 985 | Mean Difference (IV, Fixed, 95% CI) | ‐5.01 [‐6.18, ‐3.84] |
| 2.9 Quinapril 20, (40) mg | 2 | 182 | Mean Difference (IV, Fixed, 95% CI) | ‐3.35 [‐5.98, ‐0.72] |
| 2.10 Ramipril 10, (20) mg | 4 | 257 | Mean Difference (IV, Fixed, 95% CI) | ‐4.42 [‐6.55, ‐2.29] |
| 2.11 Spirapril 6, 12, 24 mg | 4 | 671 | Mean Difference (IV, Fixed, 95% CI) | ‐5.84 [‐7.19, ‐4.49] |
| 2.12 Trandolapril 2, 4, 8, 12, 16 mg | 9 | 1299 | Mean Difference (IV, Fixed, 95% CI) | ‐4.65 [‐5.55, ‐3.74] |
| Outcome or subgroup title | No. of studies | No. of participants | Statistical method | Effect size |
| 1 Change in peak SBP [1/2 Max and Higher Doses Only] Show forest plot | 11 | 1154 | Mean Difference (IV, Fixed, 95% CI) | ‐11.53 [‐13.27, ‐9.78] |
| 1.1 1/2 Max Dose | 11 | 783 | Mean Difference (IV, Fixed, 95% CI) | ‐11.06 [‐13.11, ‐9.02] |
| 1.2 Max Dose | 3 | 143 | Mean Difference (IV, Fixed, 95% CI) | ‐11.48 [‐17.37, ‐5.60] |
| 1.3 2 Max Dose | 3 | 228 | Mean Difference (IV, Fixed, 95% CI) | ‐13.36 [‐17.40, ‐9.31] |
| 2 Change in peak DBP [1/2 Max and Higher Doses Only] Show forest plot | 15 | 1485 | Mean Difference (IV, Fixed, 95% CI) | ‐6.37 [‐7.15, ‐5.58] |
| 2.1 1/2 Max Dose | 15 | 1103 | Mean Difference (IV, Fixed, 95% CI) | ‐6.02 [‐6.95, ‐5.08] |
| 2.2 Max Dose | 4 | 157 | Mean Difference (IV, Fixed, 95% CI) | ‐6.49 [‐8.81, ‐4.16] |
| 2.3 2 Max Dose | 3 | 225 | Mean Difference (IV, Fixed, 95% CI) | ‐7.69 [‐9.56, ‐5.82] |
| 3 Change in peak SBP [All Doses] Show forest plot | 11 | Mean Difference (IV, Fixed, 95% CI) | Subtotals only | |
| 3.1 1/8 Max Dose | 1 | 11 | Mean Difference (IV, Fixed, 95% CI) | ‐11.3 [‐30.46, 7.86] |
| 3.2 1/4 Max Dose | 6 | 326 | Mean Difference (IV, Fixed, 95% CI) | ‐6.03 [‐9.93, ‐2.13] |
| 3.3 1/2 Max Dose | 11 | 724 | Mean Difference (IV, Fixed, 95% CI) | ‐10.97 [‐13.14, ‐8.80] |
| 3.4 Max Dose | 3 | 136 | Mean Difference (IV, Fixed, 95% CI) | ‐11.43 [‐17.69, ‐5.16] |
| 3.5 2 Max Dose | 3 | 211 | Mean Difference (IV, Fixed, 95% CI) | ‐13.58 [‐18.03, ‐9.13] |
| 4 Change in peak DBP [All Doses] Show forest plot | 15 | Mean Difference (IV, Fixed, 95% CI) | Subtotals only | |
| 4.1 1/8 Max Dose | 3 | 154 | Mean Difference (IV, Fixed, 95% CI) | ‐9.51 [‐12.64, ‐6.38] |
| 4.2 1/4 Max Dose | 9 | 451 | Mean Difference (IV, Fixed, 95% CI) | ‐3.69 [‐5.24, ‐2.15] |
| 4.3 1/2 Max Dose | 15 | 981 | Mean Difference (IV, Fixed, 95% CI) | ‐5.98 [‐7.02, ‐4.94] |
| 4.4 Max Dose | 4 | 157 | Mean Difference (IV, Fixed, 95% CI) | ‐6.49 [‐8.81, ‐4.16] |
| 4.5 2 Max Dose | 3 | 212 | Mean Difference (IV, Fixed, 95% CI) | ‐7.78 [‐9.74, ‐5.83] |
| 5 Change in trough heart rate Show forest plot | 16 | Mean Difference (IV, Fixed, 95% CI) | Subtotals only | |
| 5.1 1/8 Max Dose | 1 | 114 | Mean Difference (IV, Fixed, 95% CI) | ‐3.0 [‐6.62, 0.62] |
| 5.2 1/4 Max Dose | 10 | 587 | Mean Difference (IV, Fixed, 95% CI) | ‐0.47 [‐1.76, 0.81] |
| 5.3 1/2 Max Dose | 9 | 917 | Mean Difference (IV, Fixed, 95% CI) | ‐0.71 [‐1.99, 0.57] |
| 5.4 Max Dose | 2 | 89 | Mean Difference (IV, Fixed, 95% CI) | 1.31 [‐2.15, 4.76] |
| 6 Total withdrawals due to adverse effects Show forest plot | 56 | Risk Ratio (M‐H, Fixed, 95% CI) | Subtotals only | |
| 6.1 1/16 Max Dose | 4 | 282 | Risk Ratio (M‐H, Fixed, 95% CI) | 1.01 [0.39, 2.57] |
| 6.2 1/8 Max Dose | 9 | 842 | Risk Ratio (M‐H, Fixed, 95% CI) | 0.88 [0.42, 1.82] |
| 6.3 1/4 Max Dose | 32 | 3385 | Risk Ratio (M‐H, Fixed, 95% CI) | 0.65 [0.42, 1.00] |
| 6.4 1/2 Max Dose | 38 | 3568 | Risk Ratio (M‐H, Fixed, 95% CI) | 0.81 [0.55, 1.19] |
| 6.5 Max Dose | 8 | 840 | Risk Ratio (M‐H, Fixed, 95% CI) | 1.15 [0.56, 2.35] |
| 6.6 2 Max Dose | 5 | 567 | Risk Ratio (M‐H, Fixed, 95% CI) | 1.51 [0.68, 3.34] |