| 1 Severe anaemia Show forest plot | 4 | | Various (Fixed, 95% CI) | Subtotals only |
|
| 1.1 Odds ratio (third trimester) | 2 | | Various (Fixed, 95% CI) | 0.77 [0.56, 1.08] |
| 1.2 Risk ratio (at delivery) | 2 | | Various (Fixed, 95% CI) | 0.98 [0.63, 1.52] |
| 1.3 Hazard ratio | 2 | | Various (Fixed, 95% CI) | 0.89 [0.61, 1.31] |
| 2 Any anaemia Show forest plot | 5 | | Various (Random, 95% CI) | Subtotals only |
|
| 2.1 Odds ratio (third trimester) | 1 | | Various (Random, 95% CI) | 0.88 [0.71, 1.10] |
| 2.2 Odds ratio (at delivery) | 2 | | Various (Random, 95% CI) | 0.95 [0.50, 1.79] |
| 2.3 Hazard ratio | 2 | | Various (Random, 95% CI) | 0.90 [0.71, 1.13] |
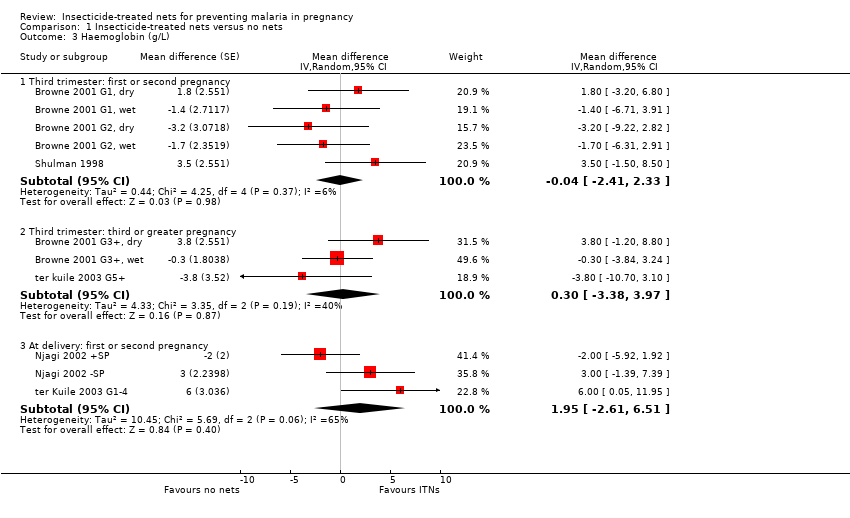
| 3 Haemoglobin (g/L) Show forest plot | 11 | | Mean difference (Random, 95% CI) | Subtotals only |
|
| 3.1 Third trimester: first or second pregnancy | 5 | | Mean difference (Random, 95% CI) | ‐0.04 [‐2.41, 2.33] |
| 3.2 Third trimester: third or greater pregnancy | 3 | | Mean difference (Random, 95% CI) | 0.30 [‐3.38, 3.97] |
| 3.3 At delivery: first or second pregnancy | 3 | | Mean difference (Random, 95% CI) | 1.95 [‐2.61, 6.51] |
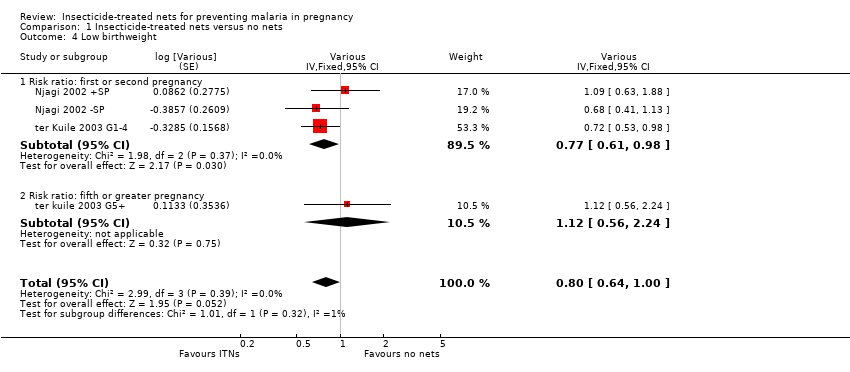
| 4 Low birthweight Show forest plot | 4 | | Various (Fixed, 95% CI) | 0.80 [0.64, 1.00] |
|
| 4.1 Risk ratio: first or second pregnancy | 3 | | Various (Fixed, 95% CI) | 0.77 [0.61, 0.98] |
| 4.2 Risk ratio: fifth or greater pregnancy | 1 | | Various (Fixed, 95% CI) | 1.12 [0.56, 2.24] |
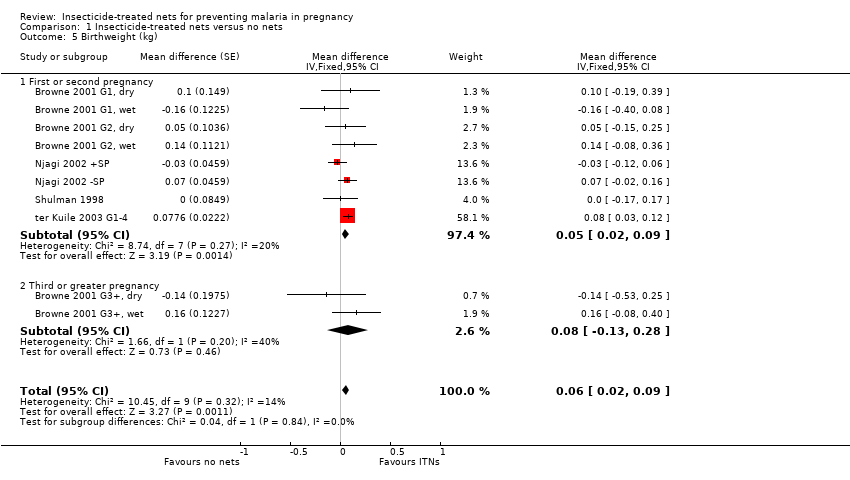
| 5 Birthweight (kg) Show forest plot | 10 | | Mean difference (Fixed, 95% CI) | 0.06 [0.02, 0.09] |
|
| 5.1 First or second pregnancy | 8 | | Mean difference (Fixed, 95% CI) | 0.05 [0.02, 0.09] |
| 5.2 Third or greater pregnancy | 2 | | Mean difference (Fixed, 95% CI) | 0.08 [‐0.13, 0.28] |
| 6 Clinical malaria illness during pregnancy Show forest plot | 2 | | Various (Fixed, 95% CI) | Totals not selected |
|
| 6.1 Odds ratio | 1 | | Various (Fixed, 95% CI) | 0.0 [0.0, 0.0] |
| 6.2 Hazard ratio | 1 | | Various (Fixed, 95% CI) | 0.0 [0.0, 0.0] |
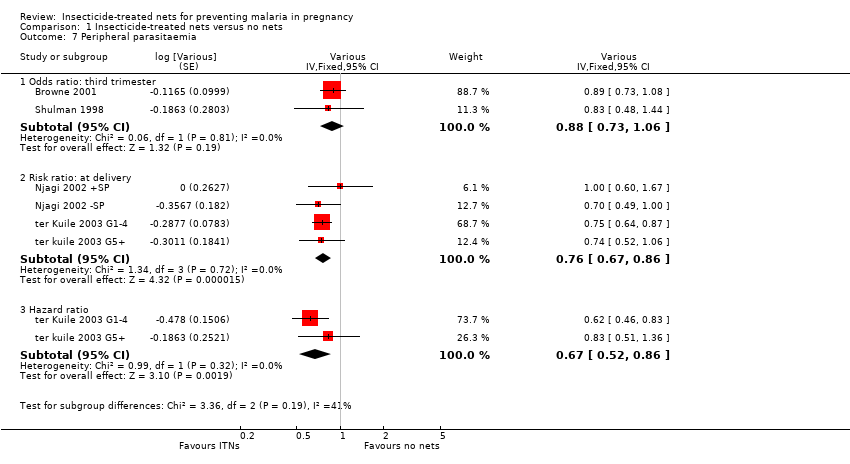
| 7 Peripheral parasitaemia Show forest plot | 6 | | Various (Fixed, 95% CI) | Subtotals only |
|
| 7.1 Odds ratio: third trimester | 2 | | Various (Fixed, 95% CI) | 0.88 [0.73, 1.06] |
| 7.2 Risk ratio: at delivery | 4 | | Various (Fixed, 95% CI) | 0.76 [0.67, 0.86] |
| 7.3 Hazard ratio | 2 | | Various (Fixed, 95% CI) | 0.67 [0.52, 0.86] |
| 8 Parasite density Show forest plot | 8 | | Geometric mean ratio (Fixed, 95% CI) | 0.93 [0.77, 1.11] |
|
| 8.1 First or second pregnancy | 6 | | Geometric mean ratio (Fixed, 95% CI) | 0.82 [0.66, 1.02] |
| 8.2 Third or greater pregnancy | 2 | | Geometric mean ratio (Fixed, 95% CI) | 1.28 [0.90, 1.82] |
| 9 Placental parasitaemia Show forest plot | 5 | | Risk Ratio (Random, 95% CI) | 0.79 [0.63, 0.98] |
|
| 9.1 First or second pregnancy | 4 | | Risk Ratio (Random, 95% CI) | 0.82 [0.61, 1.11] |
| 9.2 Fifth or greater pregnancy | 1 | | Risk Ratio (Random, 95% CI) | 0.72 [0.48, 1.08] |
| 10 Fetal loss Show forest plot | 5 | | Risk Ratio (Fixed, 95% CI) | 0.68 [0.48, 0.98] |
|
| 10.1 First or second pregnancy | 4 | | Risk Ratio (Fixed, 95% CI) | 0.67 [0.47, 0.97] |
| 10.2 Fifth or greater pregnancy | 1 | | Risk Ratio (Fixed, 95% CI) | 1.02 [0.17, 6.23] |