Tramadol untuk sakit neuropatik dalam kalangan orang dewasa
Abstract
Background
This review is an update of a review of tramadol for neuropathic pain, published in 2006; updating was to bring the review in line with current standards. Neuropathic pain, which is caused by a lesion or disease affecting the somatosensory system, may be central or peripheral in origin. Peripheral neuropathic pain often includes symptoms such as burning or shooting sensations, abnormal sensitivity to normally painless stimuli, or an increased sensitivity to normally painful stimuli. Neuropathic pain is a common symptom in many diseases of the peripheral nervous system.
Objectives
To assess the analgesic efficacy of tramadol compared with placebo or other active interventions for chronic neuropathic pain in adults, and the adverse events associated with its use in clinical trials.
Search methods
We searched CENTRAL, MEDLINE, and Embase for randomised controlled trials from inception to January 2017. We also searched the reference lists of retrieved studies and reviews, and online clinical trial registries.
Selection criteria
We included randomised, double‐blind trials of two weeks' duration or longer, comparing tramadol (any route of administration) with placebo or another active treatment for neuropathic pain, with subjective pain assessment by the participant.
Data collection and analysis
Two review authors independently extracted data and assessed trial quality and potential bias. Primary outcomes were participants with substantial pain relief (at least 50% pain relief over baseline or very much improved on Patient Global Impression of Change scale (PGIC)), or moderate pain relief (at least 30% pain relief over baseline or much or very much improved on PGIC). Where pooled analysis was possible, we used dichotomous data to calculate risk ratio (RR) and number needed to treat for an additional beneficial outcome (NNT) or harmful outcome (NNH), using standard methods. We assessed the quality of the evidence using GRADE and created 'Summary of findings' tables.
Main results
We identified six randomised, double‐blind studies involving 438 participants with suitably characterised neuropathic pain. In each, tramadol was started at a dose of about 100 mg daily and increased over one to two weeks to a maximum of 400 mg daily or the maximum tolerated dose, and then maintained for the remainder of the study. Participants had experienced moderate or severe neuropathic pain for at least three months due to cancer, cancer treatment, postherpetic neuralgia, peripheral diabetic neuropathy, spinal cord injury, or polyneuropathy. The mean age was 50 to 67 years with approximately equal numbers of men and women. Exclusions were typically people with other significant comorbidity or pain from other causes. Study duration for treatments was four to six weeks, and two studies had a cross‐over design.
Not all studies reported all the outcomes of interest, and there were limited data for pain outcomes. At least 50% pain intensity reduction was reported in three studies (265 participants, 110 events). Using a random‐effects analysis, 70/132 (53%) had at least 50% pain relief with tramadol, and 40/133 (30%) with placebo; the risk ratio (RR) was 2.2 (95% confidence interval (CI) 1.02 to 4.6). The NNT calculated from these data was 4.4 (95% CI 2.9 to 8.8). We downgraded the evidence for this outcome by two levels to low quality because of the small size of studies and of the pooled data set, because there were only 110 actual events, the analysis included different types of neuropathic pain, the studies all had at least one high risk of potential bias, and because of the limited duration of the studies.
Participants experienced more adverse events with tramadol than placebo. Report of any adverse event was higher with tramadol (58%) than placebo (34%) (4 studies, 266 participants, 123 events; RR 1.6 (95% CI 1.2 to 2.1); NNH 4.2 (95% CI 2.8 to 8.3)). Adverse event withdrawal was higher with tramadol (16%) than placebo (3%) (6 studies, 485 participants, 45 events; RR 4.1 (95% CI 2.0 to 8.4); NNH 8.2 (95% CI 5.8 to 14)). Only four serious adverse events were reported, without obvious attribution to treatment, and no deaths were reported. We downgraded the evidence for this outcome by two or three levels to low or very low quality because of small study size, because there were few actual events, and because of the limited duration of the studies.
Authors' conclusions
There is only modest information about the use of tramadol in neuropathic pain, coming from small, largely inadequate studies with potential risk of bias. That bias would normally increase the apparent benefits of tramadol. The evidence of benefit from tramadol was of low or very low quality, meaning that it does not provide a reliable indication of the likely effect, and the likelihood is very high that the effect will be substantially different from the estimate in this systematic review.
PICO
Ringkasan bahasa mudah
Tramadol untuk merawat sakit neuropatik
Kesimpulannya
Penyelidik menjumpai kualiti bukti yang sangat rendah bahawa tramadol yang dimakan mempunyai kesan berfaedah yang penting pada kesakitan dalam orang dengan sakit neuropatik sederhana atau teruk. Terdapat bukti yang teramat sedikit untuk menerima kesimpulan ini.
Latar belakang
Sakit neuropatik adalah sakit yang datang dengan spontan atau secara tidak normal dari kecederaan saraf. Ia adalah berbeza dari mesej sakit yang dibawa oleh saraf sihat dari tisu tercedera (jatuh atau terpotong, atau terbakar). Sakit neuropatik sering dirawat dengan ubat‐ubatan yang berbeza dengan yang digunakan untuk sakit dari tisu yang rosak, yang kita panggil ubat penahan sakit.
Ubat penahan sakit opioid (ubat seperti morfin) kadang‐kala digunakan untuk merawat sakit neuropatik. Morfin berasal dari tumbuh‐tumbuhan, tetapi kebanyakkan opioids adalah dibuat di makmal daripada yang diekstrak daripada tumbuh‐tumbuhan. Tramadol adalah ubat opioid yang dibuat di makmal.
Ciri‐ciri kajian
Pada Januari 2017, penyelidik telah mencari ujian klinikal di mana tramadol digunakan untuk merawat sakit neuropatik keatas orang dewasa. Enam kajian yang memenuhi kriteria kemasukan, 236 peserta secara rawak, diberikan rawatan dengan tramadol atau plasebo. Tempoh kajian adalah di antara empat dan enam minggu. Tidak semua hasil yang dilaporkan menepati kehendak penyelidik.
Penyelidik menakrifkan keputusan yang baik adalah seseorang yang mempunyai tahap kelegaan kesakitan yang tinggi dan mampu untuk terus mengambil ubat tanpa kesan sampingan yang menyebabkan mereka menghentikan rawatan.
Keputusan utama
Tiga kajian kecil melaporkan bahawa sakit berkurangan sebanyak separuh atau lebih baik dalam sesetengah orang. Pengurangan kesakitan kepada separuh atau lebih baik dicapai oleh 5 dalam 10 dengan tramadol dan 3 dalam 10 dengan plasebo. Kesan sampingan yang dialami oleh 6 dalam 10 dengan tramadol dan 3 dalam 10 dengan plasebo, dan 2 dalam 10 dengan tramadol dan hampir tiada seorang dengan plasebo berhenti mengambil ubat tersebut disebabkan oleh kesan sampingan.
Kualiti bukti
Bukti tersebut mempunyai kualiti yang sangat rendah. Ini bermakna bahawa penyelidikan tersebut tidak memberikan petunjuk yang boleh dipercayai terhadap kesan yang berkemungkinan dan kebarangkalian yang tinggi bahawa kesan akan berbeza daripada apa yang ditunjukkan dalam analisis ujian ini. Kajian kecil seperti dalam ulasan ini lebih cenderung kepada keputusan yang berlebihan berbanding dengan kesan yang dijumpai dalam kajian yang lebih besar dan lebih baik. Terdapat masalah‐masalah lain yang mungkin membawa kepada keputusan yang bersifat optimistik berlebihan. Kualiti bukti yang rendah dan kekurangan dalam sebarang faedah yang penting bermakna bahawa kita memerlukan kajian yang besar dan baru, sebelum kita dapat mengetahui sama ada tramadol berguna untuk pengurusan sakit neuropatik ataupun tidak.
Authors' conclusions
Summary of findings
| Tramadol compared with placebo for neuropathic pain | ||||||
| Patient or population: adults with neuropathic pain (any origin) Settings: community Intervention: oral tramadol (typically started at a dose of about 100 mg daily and increased over 1 to 2 weeks to a maximum of 400 mg daily) Comparison: placebo | ||||||
| Outcomes (at trial end) | Probable outcome with | Probable outcome with | Relative effect | No of participants | Quality of the evidence | Comments |
| At least 30% reduction in pain | Not analysed | Not analysed | Not analysed | 157 participants (2 studies) 60 events | Low quality1 | ‐ |
| At least 50% reduction in pain | 530 per 1000 | 300 per 1000 | RR 2.2 (1.02, 4.6) NNT 4.4 (2.9 to 8.8) | 265 participants (3 studies) 110 events | Low quality1 | ‐ |
| PGIC much or very much improved | Not analysed | Not analysed | Not analysed | 35 participants (1 study) 4 events | Very low quality2 | ‐ |
| Withdrawal due to adverse event | 160 per 100 | 30 per 1000 | RR 4.1 (2.0 to 8.4) NNH 8.2 (5.8 to 14) | 485 participants (6 studies) 45 events | Low quality1 | ‐ |
| Participants experiencing any adverse event | 580 per 1000 | 340 per 1000 | RR 1.6 (1.2 to 2.1) NNH 4.2 (2.8 to 8.3) | 266 participants (4 studies) 123 events | Low quality1 | ‐ |
| Serious adverse events | 4 serious adverse events reported in total | Not all studies reported specifically on serious adverse events | Very low quality2 | ‐ | ||
| Death | No data | No data | Not calculated | No data | Very low quality3 | ‐ |
| CI: confidence interval; NNH: number needed to treat for one additional harmful outcome; PGIC: Patient Global Impression of Change; RR: risk ratio | ||||||
| Descriptors for levels of evidence (EPOC 2015): † Substantially different: a large enough difference that it might affect a decision. | ||||||
| 1Downgraded 2 levels due to small number of studies and participants and relatively few events, and several sources of potential bias. | ||||||
Background
This review is an update of a review of tramadol for neuropathic pain, published in 2006 (Hollingshead 2006). The standards for Cochrane reviews have changed substantially since 2006, and this review is based on a template for reviews of drugs used to relieve neuropathic pain. The aim is for all reviews to use the same methods, based on new criteria for what constitutes reliable evidence in chronic pain (Moore 2010a; Moore 2012; Appendix 1).
Description of the condition
The 2011 International Association for the Study of Pain definition of neuropathic pain is "pain caused by a lesion or disease of the somatosensory system" (Jensen 2011), based on a definition agreed at an earlier consensus meeting (Treede 2008). Neuropathic pain is a consequence of a pathological maladaptive response of the nervous system to 'damage' from a wide variety of potential causes. It is characterised by pain in the absence of a noxious stimulus and may be spontaneous (continuous or paroxysmal) in its temporal characteristics or be evoked by sensory stimuli (dynamic mechanical allodynia where pain is evoked by light touch of the skin). Neuropathic pain is associated with a variety of sensory loss (numbness) and sensory gain (allodynia) clinical phenomena, the exact pattern of which vary between people and disease, perhaps reflecting different pain mechanisms operating in an individual person and, therefore, potentially predictive of response to treatment (Demant 2014; Helfert 2015; von Hehn 2012). Pre‐clinical research hypothesises a bewildering array of possible pain mechanisms that may operate in people with neuropathic pain, which largely reflect pathophysiological responses in both the central and peripheral nervous systems, including neuronal interactions with immune cells (Baron 2012; Calvo 2012; von Hehn 2012). Overall, the treatment gains in neuropathic pain, to even the most effective of available drugs, are modest (Finnerup 2015; Moore 2013a), and a robust classification of neuropathic pain is not yet available (Finnerup 2013).
Neuropathic pain is usually divided according to the cause of nerve injury. There may be many causes, but some common causes of neuropathic pain include diabetes (painful diabetic neuropathy (PDN)), shingles (postherpetic neuralgia (PHN)), amputation (stump and phantom limb pain), neuropathic pain after surgery or trauma, stroke or spinal cord injury, trigeminal neuralgia, and HIV infection. Sometimes the cause is unknown.
Many people with neuropathic pain conditions are significantly disabled with moderate or severe pain for many years. Chronic pain conditions comprised five of the 11 top‐ranking conditions for years lived with disability in 2010 (Vos 2012), and are responsible for considerable loss of quality of life and employment, and increased healthcare costs (Moore 2014a). A US study found the healthcare costs were three‐fold higher for people with neuropathic pain than matched control subjects (Berger 2004). A UK study and a German study showed a two‐ to three‐fold higher level of use of healthcare services in people with neuropathic pain than those without (Berger 2012; Berger 2009). For postherpetic neuralgia, for example, studies demonstrate large loss of quality of life and substantial costs (Scott 2006; Van Hoek 2009).
In systematic reviews, the overall prevalence of neuropathic pain in the general population was reported to be between 7% and 10% (Van Hecke 2014), and about 7% in a systematic review of studies published since 2000 (Moore 2014a). In individual countries, prevalence rates have been reported as 3.3% in Austria (Gustorff 2008), 6.9% in France (Bouhassira 2008), and up to 8% in the UK (Torrance 2006). Some forms of neuropathic pain, such as PDN and post‐surgical chronic pain (which is often neuropathic in origin), are increasing (Hall 2008). The prevalence of PHN is likely to fall if vaccination against the herpes virus becomes widespread.
Estimates of incidence vary between individual studies for particular origins of neuropathic pain, often because of small numbers of cases. In primary care in the UK, between 2002 and 2005, the incidences (per 100,000 person‐years' observation) were 28 (95% confidence interval (CI) 27 to 30) for PHN, 27 (95% CI 26 to 29) for trigeminal neuralgia, 0.8 (95% CI 0.6 to 1.1) for phantom limb pain, and 21 (95% CI 20 to 22) for PDN (Hall 2008). Other studies have estimated an incidence of 4 in 100,000 per year for trigeminal neuralgia (Katusic 1991; Rappaport 1994), and 12.6 per 100,000 person‐years for trigeminal neuralgia and 3.9 per 100,000 person‐years for PHN in a study of facial pain in the Netherlands (Koopman 2009). One systematic review of chronic pain demonstrated that some neuropathic pain conditions, such as PDN, can be more common than other neuropathic pain conditions, with prevalence rates up to 400 per 100,000 person‐years (McQuay 2007).
Neuropathic pain is difficult to treat effectively, with only a minority of people experiencing a clinically‐relevant benefit from any one intervention (Kalso 2013; Moore 2013b). A multidisciplinary approach is now advocated, combining pharmacological interventions with physical or cognitive (or both) interventions. The evidence for interventional management is very weak, or non‐existent (Dworkin 2013). Conventional analgesics such as paracetamol and nonsteroidal anti‐inflammatory drugs (NSAIDs) are not thought to be effective, but without evidence to support or refute that view (Moore 2015a). Some people may derive some benefit from a topical lidocaine patch or low‐concentration topical capsaicin, although evidence about benefits is uncertain (Derry 2012; Derry 2014). High‐concentration topical capsaicin may benefit some people with PHN (Derry 2013). Treatment is often by so‐called 'unconventional analgesics' (pain modulators) such as antidepressants (duloxetine and amitriptyline; Lunn 2014; Moore 2014b; Moore 2015b; Sultan 2008), or antiepileptics (gabapentin or pregabalin; Moore 2009; Moore 2014c; Wiffen 2013). Evidence for efficacy of opioids is unconvincing (Gaskell 2016; Stannard 2016).
The proportion of people who achieve worthwhile pain relief (typically at least 50% pain intensity reduction; Moore 2013a) is small, generally only 10% to 25% more than with placebo, with numbers needed to treat for an additional beneficial outcome (NNT) usually between 4 and 10 (Kalso 2013; Moore 2013b). Neuropathic pain is not particularly different from other chronic pain conditions in that only a small proportion of trial participants have a good response to treatment (Moore 2013b).
The current National Institute for Health and Care Excellence (NICE) guidance for the pharmacological management of neuropathic pain suggests offering a choice of amitriptyline, duloxetine, gabapentin, or pregabalin as initial treatment for neuropathic pain (with the exception of trigeminal neuralgia), with switching if the first, second, or third drugs tried are not effective or not tolerated (NICE 2013). This concurs with other recent guidance (Finnerup 2015).
Description of the intervention
Tramadol hydrochloride is an opioid analgesic originally marketed in West Germany in 1977, and now widely available. In 2016, tramadol ‐ alone or in combination with paracetamol (acetaminophen) ‐ was available in products for oral use and by injection from almost 90 companies. Oral formulations include those designed for immediate release, and for modified release over a longer time period. Preparations for rectal administration are also available. The total oral daily dosage is usually up to 400 mg, although some licences state that 400 mg is the maximum dose (Martindale 2016).
Tramadol is used to treat a range of different pain conditions. It acts as a µ‐opioid agonist, but also has a range of other properties that may contribute to its analgesic effect, including serotonin reuptake inhibition and norepinephrine reuptake inhibition. It is licensed for use in moderate to severe pain and is less potent than morphine or similar drugs. It is considered to fit into Step 2 of the World Health Organization (WHO) analgesic ladder (WHO 2016). In some parts of the world tramadol is classified as a controlled substance (similar to codeine in this respect), but the exact classification and controls on prescribing vary markedly.
Tramadol has reasonable efficacy in acute postoperative pain as a single agent, and in combination with paracetamol (Edwards 2002; Moore 1997), but has small benefits in osteoarthritis (Cepeda 2006), and the evidence base was inadequate to recommend it as an alternative to paracetamol plus codeine for routine use in people with cancer with mild to moderate cancer pain (Tassinari 2011). The earlier version of this review found that it probably has efficacy in neuropathic pain conditions (Hollingshead 2006).
Tramadol is associated with typical opioid adverse events of nausea, dizziness, and dry mouth, although vomiting and constipation are considered to be less of a problem than with traditional opioids. Use of tramadol with concurrent serotonergic therapy poses a risk of serotonin syndrome (Beakley 2015).
Like other opioids, tramadol is potentially subject to abuse. A study in Germany, where tramadol is not scheduled in the German Narcotic Drugs Act, calculated the incidence of abuse as 0.21 cases per million defined daily dosages (DDDs) and dependency as 0.12 cases per million DDDs, with lower incidences in recent years (Radbruch 2013). The conclusion was that tramadol had a low potential for misuse, abuse, and dependency.
How the intervention might work
Tramadol acts centrally, and both tramadol and its O‐desmethyl metabolite are selective, weak OP3‐receptor (µ) agonists. The mode of action is poorly understood (Reeves 2008).
Tramadol is a synthetic 4‐phenyl‐piperidine analogue of codeine with a central analgesic effect. Tramadol is metabolised by N‐ and O‐demethylation via the cytochrome P450 isoenzymes CYP3A4 and CYP2D6 and glucuronidation or sulphation in the liver. Around 40% of the analgesic action is provided by O‐desmethyl tramadol (M1) created by rapid metabolism of tramadol in the liver via the cytochrome P450 enzyme CYP2D6 (Bozkurt 2005; Grond 2004; Lintz 1998). Tramadol is also metabolised by N‐demethylation via the cytochrome P450 isoenzyme CYP3A4, and glucuronidation or sulphation in the liver (Grond 2004).
Tramadol is available as a racemic mixture of (+) and (‐) enantiomers. The (+) enantiomer has only a weak affinity to µ‐opioid receptors and inhibits serotonin reuptake, while the (‐) enantiomer inhibits norepinephrine reuptake in the spinal cord (Bozkurt 2005; Scott 2000). These different modes action might explain the longer analgesic efficacy and the lower incidence of opioid adverse effects, but a range of other modes of action have been proposed (Bozkurt 2005; Grond 2004).
Tramadol is rapidly absorbed after oral administration and has an absolute bioavailability of 65% to 70% (Lintz 1998; Scott 2000). Generally, there are no significant differences in the pharmacokinetics (elimination half‐life, distribution, serum clearance and concentration of metabolites) of tramadol between adults and children after oral dosing or intravenous injection. Genetic variances probably influence analgesic efficacy (Gan 2007). About 8% of the white population has cytochrome P450 enzyme (CYP2D6) deficiency that reduces the analgesic effects of tramadol, and this may well be greater in some other populations. Other drugs metabolised by CYP2D6 enzymes (ondansetron, for example) can potentially interfere with tramadol metabolism, changing how well it works in individuals, and possible adverse events as well.
Why it is important to do this review
The earlier version of this review indicated a benefit of tramadol over placebo for relief of neuropathic pain. This was based on pooled evidence from five studies in various different types of neuropathic pain (Hollingshead 2006); since then our understanding of methods and biases relating to opioid use in chronic pain has improved, and more studies have become available. A more recent review by the Canadian Agency for Drugs and Technologies in Health was less positive about the efficacy of tramadol (CADTH 2015). In addition, data from the US 2005 to 2011 Drug Abuse Warning Network showed that visits made to emergency departments involving misuse or abuse of tramadol increased about 250% between 2005 and 2011 (Bush 2015).
The standards used to assess evidence in chronic pain trials have changed substantially in recent years, with particular attention being paid to trial duration, withdrawals, and statistical imputation following withdrawal, all of which can substantially alter estimates of efficacy. The most important change is the move from using mean pain scores, or mean change in pain scores, to the number of people who have a large decrease in pain (by at least 50%) and who continue in treatment, ideally in trials of 8 to 12 weeks' duration or longer. Pain intensity reduction of 50% or more correlates with improvements in co‐morbid symptoms, function, and quality of life generally (Moore 2013a), and in people with neuropathic pain (Hoffman 2010). These standards are set out in the PaPaS Author and Referee Guidance for pain studies of Cochrane Pain, Palliative and Supportive Care (PaPaS) (PaPaS 2012).
This Cochrane Review assesses evidence using improved methods that make both statistical and clinical sense, using developing criteria for what constitutes reliable evidence in chronic pain (Moore 2010a). Trials included and analysed had to meet a minimum of reporting quality (blinding, randomisation), validity (duration, dose and timing, diagnosis, outcomes, etc.), and size. Ideally at least 500 participants are needed in a comparison in which the NNT is 4 or above in order to measure the magnitude of a treatment effect adequately (Moore 1998). This approach sets high standards for the demonstration of efficacy and marks a departure from how reviews were conducted previously.
Objectives
To assess the analgesic efficacy of tramadol compared with placebo or other active interventions for chronic neuropathic pain in adults, and the adverse events associated with its use in clinical trials.
Methods
Criteria for considering studies for this review
Types of studies
We included randomised controlled trials (RCTs) with double‐blind assessment of participant outcomes following two weeks or more of treatment, although the emphasis of the review was on studies with a duration of eight weeks or longer. We required full journal publication, with the exception of online clinical trial results summaries of otherwise unpublished clinical trials and abstracts with sufficient data for analysis. We did not include short abstracts (usually meeting reports), and we excluded studies that were non‐randomised, studies of experimental pain, case reports, and clinical observations.
Types of participants
Studies included adults aged 18 years and above with one or more chronic neuropathic pain condition including (but not limited to):
-
cancer‐related neuropathy;
-
central neuropathic pain;
-
complex regional pain syndrome (CRPS) Type II;
-
HIV neuropathy;
-
painful diabetic neuropathy;
-
phantom limb pain;
-
postherpetic neuralgia;
-
postoperative or traumatic neuropathic pain;
-
spinal cord injury;
-
trigeminal neuralgia.
Types of interventions
Tramadol at any dose, by any route, administered for the relief of neuropathic pain and compared with placebo or any active comparator.
Types of outcome measures
We anticipated that studies would use a variety of outcome measures, with most studies using standard subjective scales (numerical rating scale (NRS) or visual analogue scale (VAS)) for pain intensity or pain relief, or both. We were particularly interested in Initiative on Methods, Measurement, and Pain Assessment in Clinical Trials (IMMPACT) definitions for moderate and substantial benefit in chronic pain studies (Dworkin 2008). These are defined as:
-
at least 30% pain relief over baseline (moderate);
-
at least 50% pain relief over baseline (substantial);
-
much or very much improved on Patient Global Impression of Change scale (PGIC; moderate);
-
very much improved on PGIC (substantial).
These outcomes are different from those used in most earlier reviews, concentrating as they do on dichotomous outcomes where pain responses do not follow a normal (Gaussian) distribution. People with chronic pain desire high levels of pain relief, ideally more than 50% pain intensity reduction, and ideally having no worse than mild pain (Moore 2013a; O'Brien 2010).
Primary outcomes
-
Participant‐reported pain relief of 30% or greater
-
Participant‐reported pain relief of 50% or greater
-
PGIC much or very much improved
-
PGIC very much improved
Secondary outcomes
-
Any pain‐related outcome indicating some improvement
-
Withdrawals due to lack of efficacy, adverse events, and for any cause
-
Participants experiencing any adverse event
-
Participants experiencing any serious adverse event. Serious adverse events typically include any untoward medical occurrence or effect that at any dose results in death, is life‐threatening, requires hospitalisation or prolongation of existing hospitalisation, results in persistent or significant disability or incapacity, is a congenital anomaly or birth defect, is an 'important medical event' that may jeopardise the patient, or may require an intervention to prevent one of the above characteristics or consequences.
-
Specific adverse events, particularly somnolence and dizziness
Search methods for identification of studies
Electronic searches
For this update, we searched the following databases, without language restrictions:
-
Cochrane Central Register of Controlled Trials (CENTRAL; 2017) via Cochrane Register of Studies Online) on 9 January 2017;
-
MEDLINE (via Ovid from 1946 to 9 January 2017);
-
Embase (via Ovid from 1974 to 9 January 2017).
The search strategies for CENTRAL, MEDLINE, and Embase are in Appendix 2, Appendix 3, and Appendix 4, respectively.
For the earlier review, we searched LILACS (Appendix 5).
Searching other resources
We reviewed the bibliographies of any RCTs and review articles identified by the new searches, and searched clinical trial databases (ClinicalTrials.gov and WHO International Clinical Trials Registry Platform (ICTTRP) (apps.who.int/trialsearch/)) to identify additional published or unpublished data. We did not contact investigators or study sponsors.
Data collection and analysis
We planned to perform separate analyses according to particular neuropathic pain conditions. We have combined different neuropathic pain conditions in analyses for exploratory purposes only.
Selection of studies
We reassessed studies included in the earlier review to determine whether they satisfied our new, stricter inclusion criteria. For studies identified by the new searches, we determined eligibility by reading the abstract of each study identified by the search. We eliminated studies that clearly did not satisfy the inclusion criteria, and we obtained full copies of the remaining studies. Three review authors (SD, RAM, PW) made the decisions. These authors then read these studies independently and reached agreement by discussion. We did not anonymise the studies in any way before assessment. We have provided a PRISMA flow chart (Moher 2009).
Data extraction and management
Two review authors (SD, RAM) extracted data independently using a standard form and checked for agreement before entry into Review Manager 5 (RevMan 5) (RevMan 2014), or any other analysis tool. We included information about the pain condition and number of participants treated, drug and dosing regimen, study design (placebo or active control), study duration and follow‐up, analgesic outcome measures and results, withdrawals, and adverse events (participants experiencing any adverse event, or serious adverse event).
We reviewed studies included in the earlier review to determine whether there was additional information relating to the updated outcomes.
Assessment of risk of bias in included studies
We used the Oxford Quality Score as the basis for inclusion (Jadad 1996), limiting inclusion to studies that were randomised and double‐blind as a minimum.
Two review authors (SD, PW) independently assessed risk of bias for each study, using some of the criteria outlined in the Cochrane Handbook for Systematic Reviews of Interventions (Chapter 8, Higgins 2011), and adapted by Cochrane PaPaS from those used by Cochrane Pregnancy and Childbirth, with any disagreements resolved by discussion. We assessed the following for each study.
-
Random sequence generation (checking for possible selection bias). We assessed the method used to generate the allocation sequence as: low risk of bias (any truly random process: random number table or computer random‐number generator); unclear risk of bias (when the method used to generate the sequence was not clearly stated). We excluded studies at a high risk of bias that used a non‐random process (odd or even date of birth; hospital or clinic record number).
-
Allocation concealment (checking for possible selection bias). The method used to conceal allocation to interventions prior to assignment determines whether intervention allocation could have been foreseen in advance of, or during, recruitment, or changed after assignment. We assessed the methods as: low risk of bias (telephone or central randomisation; consecutively‐numbered, sealed, opaque envelopes); unclear risk of bias (when the method was not clearly stated). We excluded studies that did not conceal allocation and were therefore at a high risk of bias (open list).
-
Blinding of participants and personnel (checking for possible performance bias), and blinding of outcome assessment (checking for possible detection bias). We assessed the methods used to blind study personnel and participants (all outcomes were self‐assessed) from knowledge of which intervention a participant received. We assessed the methods as: low risk of bias (study stated that it was blinded and described the method used to achieve blinding, for example, identical tablets, matched in appearance and smell); unclear risk of bias (study stated that it was blinded but did not provide an adequate description of how it was achieved). We excluded studies at a high risk of bias that were not double‐blind.
-
Incomplete outcome data (checking for possible attrition bias due to the amount, nature, and handling of incomplete outcome data). We assessed the methods used to deal with incomplete data as: low risk of bias (fewer than 10% of participants did not complete the study or used 'baseline observation carried forward' (BOCF) analysis, or both); unclear risk of bias (used 'last observation carried forward' (LOCF) analysis); or high risk of bias (used 'completer' analysis).
-
Size of study (checking for possible biases confounded by small size). Small studies have been shown to overestimate treatment effects, probably because the conduct of small studies is more likely to be less rigorous, allowing critical criteria to be compromised (Dechartres 2013; Nüesch 2010). We assessed studies as being at low risk of bias (200 participants or more per treatment arm); unclear risk of bias (50 to 199 participants per treatment arm); or high risk of bias (fewer than 50 participants per treatment arm).
Measures of treatment effect
We calculated the number needed to treat for an additional beneficial outcome (NNT) as the reciprocal of the absolute risk reduction (ARR) (McQuay 1998). For unwanted effects, the NNT becomes the number needed to treat for an additional harmful outcome (NNH) and was calculated in the same manner. We used dichotomous data to calculate a risk ratio (RR) with 95% confidence intervals (CIs) using a fixed‐effect model unless significant statistical heterogeneity was found (see below). We did not use continuous data in analyses.
Unit of analysis issues
The unit of analysis was the individual participant.
Dealing with missing data
We used intention‐to‐treat (ITT) analysis where the ITT population consisted of participants who were randomised, took at least one dose of the assigned study medication, and provided at least one post‐baseline assessment. Missing participants were assigned zero improvement wherever possible.
We paid particular attention to methods used for imputation of missing data due to withdrawals for adverse events and lack of efficacy.
Assessment of heterogeneity
We dealt with clinical heterogeneity by combining studies that examined similar conditions. We assessed statistical heterogeneity visually (L'Abbé 1987), and with the use of the I² statistic (Higgins 2003). When the I² value was greater than 50%, we considered possible reasons for this.
Assessment of reporting biases
The aim of this review was to use dichotomous outcomes of known utility and of value to patients (Hoffman 2010; Moore 2010b; Moore 2010c; Moore 2010d; Moore 2013a). The review did not depend on what the authors of the original studies chose to report or not, and studies that did not report dichotomous results for an outcome did not contribute to pooled analyses for that outcome. We extracted and used continuous data, which probably reflect efficacy and utility poorly (McQuay 1996), for illustrative purposes only.
We assessed publication bias using a method designed to detect the amount of unpublished data with a null effect required to make any result clinically irrelevant (usually taken to mean a NNT of 10 or higher in this condition; Moore 2008).
Data synthesis
We used a fixed‐effect model for meta‐analysis. We used a random‐effects model for meta‐analysis where there was significant clinical heterogeneity and it was considered appropriate to combine studies.
Quality of evidence
We used the GRADE approach to assess the quality of evidence related to each of the key outcomes, and report our judgement on the quality of the evidence in the 'Summary of findings' table (Chapter 12, Schünemann 2011a; Appendix 6).
In addition, there may be circumstances where the overall rating for a particular outcome needs to be adjusted as recommended by GRADE guidelines (Guyatt 2013a). For example, if there were so few data that the results were highly susceptible to the random play of chance, or if a studies used LOCF imputation in circumstances where there were substantial differences in adverse event withdrawals, one would have no confidence in the result, and would need to grade the quality of the evidence as very low quality.
In addition, we are aware that many Cochrane Reviews are based largely or wholly on small underpowered studies, and the danger of making conclusive assessments of evidence based on inadequate information (AlBalawi 2013; Brok 2009; Roberts 2015; Turner 2013).
'Summary of findings' table
We have included a 'Summary of findings' table as set out in the PaPaS author guide (PaPaS 2012), and recommended in the Cochrane Handbook for Systematic Reviews of Interventions (Chapter 11, Schünemann 2011b; Guyatt 2013b). The table includes, where possible, outcomes equivalent to moderate or substantial benefit of at least 30% and at least 50% pain intensity reduction, PGIC (possibly at least substantial improvement and at least moderate improvement) (Dworkin 2008), withdrawals due to adverse events, participants experiencing any adverse event, serious adverse events, and death (a particular serious adverse event).
For the 'Summary of findings' table we used the following descriptors for levels of evidence (EPOC 2015).
High: this research provides a very good indication of the likely effect. The likelihood that the effect will be substantially different† from the estimate is low.
Moderate: this research provides a good indication of the likely effect. The likelihood that the effect will be substantially different† from the estimate is moderate.
Low: this research provides some indication of the likely effect. However, the likelihood that it will be substantially different† from the estimate is high.
Very low: this research does not provide a reliable indication of any effect. The likelihood that the effect will be substantially different† from the estimate is very high.
† Substantially different: a large enough difference that it might affect a decision.
Subgroup analysis and investigation of heterogeneity
We planned all analyses to be according to individual painful conditions, because placebo response rates for the same outcome can vary between conditions, as can the drug‐specific effects (Moore 2009).
Sensitivity analysis
We did not plan any sensitivity analysis because the evidence base is known to be too small to allow reliable analysis.
Results
Description of studies
The original review included five studies that compared tramadol with placebo (Arbaiza 2007; Boureau 2003; Harati 1998; Erdine 1997; Sindrup 1999), one comparing tramadol with clomipramine (Gobel 1995), and one comparing tramadol with morphine (Leppert 2001).
For this update we included only double‐blind studies, which led to the exclusion of the two active‐controlled studies, which were open label (Gobel 1995; Leppert 2001). We also excluded the short conference abstract, which did not provide any usable data or methodological details (Erdine 1997).
Results of the search
We carried out full, rather than updated, searches because the study inclusion criteria for this update had changed as above. The searches identified 152 records in CENTRAL, 388 in MEDLINE, 737 in Embase, and one additional record in clinical trials registries. They identified all the studies that had been included in the earlier review and six new reports (probably of five studies) that were potentially eligible. After reading the full texts we included four of the original included studies (Arbaiza 2007; Boureau 2003; Harati 1998; Sindrup 1999) and two new studies (Norrbrink 2009; Sindrup 2012). We excluded three of the original studies (Gobel 1995; Leppert 2001; Erdine 1997) as above, and three of the new reports (probably two studies) (NCT00610155; Saxena 2013).
We placed the remaining new study in 'Studies awaiting classification' (Ho 2009). The reason for this was the highly contrived design, with pre‐testing selection of participants with two run‐in periods, the very large doses of additional drug therapy that could have been taken, the very small numbers of participants, and the short one‐week maintenance phase. We are unable at this time to properly classify this study. Moreover, participants had to have painful small fibre sensory neuropathy of two months' or greater duration. This disease duration is below our threshold for inclusion, and there was no indication of what the average or typical duration of the condition actually was.
See Figure 1.

Study flow diagram for the updated search
Included studies
We included six studies, with 438 participants randomised to treatment with tramadol, placebo, or both (109 participants in cross‐over studies) in approximately equal numbers, although efficacy data were not available for all of the randomised participants (Arbaiza 2007; Boureau 2003; Harati 1998; Norrbrink 2009; Sindrup 1999; Sindrup 2012). One cross‐over study, enrolling 64 participants, included an active treatment arm using a novel analgesic (GRT9906) (Sindrup 2012). Tramadol was started at a dose of about 100 mg daily and increased over one to two weeks to a maximum of 400 mg daily (300 mg daily in people aged 75 years or more in Boureau 2003) or the maximum tolerated dose, and then maintained for the remainder of the study.
Treatment periods were from four to six weeks (45 days), with washout periods of at least one week between treatments in cross‐over studies. Most studies specified paracetamol (acetaminophen) as rescue medication. Arbaiza 2007 allowed continuation of antiepileptic analgesic therapy with dose reduction if required, and Norrbrink 2009 allowed unchanged stable pain medication. The other studies required that all previous pain medication was stopped and washed out before the start of the study (Boureau 2003; Harati 1998; Sindrup 2012), or did not report on this aspect (Sindrup 1999).
Studies enrolled participants who had experienced moderate or severe neuropathic pain for at least three months due to cancer or cancer‐treatment (Arbaiza 2007), postherpetic neuralgia (Boureau 2003), or peripheral diabetic neuropathy (Harati 1998); at least 12 months due to spinal cord injury (Norrbrink 2009); or at least six months due to polyneuropathy (Sindrup 1999; Sindrup 2012). The mean age ranged from 50 to 67 years (overall range 26 to 85 years), and there were approximately equal numbers of men and women overall, although the ratio varied between studies from 4:1 to 1:2.6. Three studies were multicentre (Boureau 2003; Harati 1998; Sindrup 2012). Exclusion criteria varied between studies, but generally they excluded people with other significant comorbidities or pain from other causes; contraindications to tramadol or other opioids; and a history of addiction or drug or alcohol abuse.
Further details are reported in the Characteristics of included studies table.
Excluded studies
We excluded three studies that were included in the original review because they did not satisfy the updated inclusion criteria (Erdine 1997; Gobel 1995; Leppert 2001), and two additional studies (three reports) because one was not a controlled trial (Saxena 2013), and the other used treatment periods of only seven days and treatment groups of fewer than 10 participants (NCT00610155). Details are reported in the Characteristics of excluded studies table.
Risk of bias in included studies
A summary of the risk of bias assessment is shown in Figure 2.
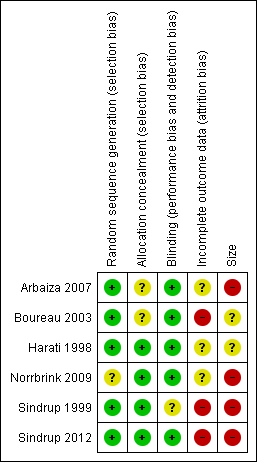
Risk of bias summary: review authors' judgements about each risk of bias item for each included study.
Allocation
All the studies were described as randomised, and all except Norrbrink 2009 adequately described the method used to generate the random sequence. Two studies (Arbaiza 2007; Boureau 2003) did not adequately describe the method used to conceal the allocation. One trial had some initial differences in participant characteristics at baseline (Norrbrink 2009).
Blinding
All the studies were described as double‐blind, and all except Sindrup 1999 adequately described the method used to maintain blinding.
Incomplete outcome data
All the included studies were at unknown or high risk of attrition bias. This was because they did not report an ITT analysis using BOCF for withdrawals (or other conservative imputation method for efficacy) in a situation where there was considerable imbalance between withdrawals due to adverse events and lack of efficacy. We judged Sindrup 2012 at high risk of bias because efficacy results were based on participants who completed all three treatment periods. Both Boureau 2003 and Sindrup 1999 handled data in a way that we considered equivalent to LOCF imputation, and we considered them to be at high risk of bias. We judged the remaining studies at unclear risk of bias.
Other potential sources of bias
We judged four studies at high risk of bias due to small size (< 50 participants per treatment arm; Arbaiza 2007; Norrbrink 2009; Sindrup 1999; Sindrup 2012), and two at unknown risk of bias (63 to 66 participants per treatment arm; Boureau 2003; Harati 1998).
Effects of interventions
See: Summary of findings for the main comparison Tramadol compared with placebo for neuropathic pain
Results for individual studies are presented in Appendix 7 (efficacy) and Appendix 8 (adverse events and withdrawals).
Tramadol versus placebo
Participants with at least 30% pain relief
Two studies, both in polyneuropathy, provided information on this outcome. There were insufficient data for reliable analysis (157 participants).
In Sindrup 1999, 13/34 participants achieved at least 30% pain intensity reduction with tramadol, and 4/33 with placebo, using LOCF for withdrawals. In Sindrup 2012, of those participants who completed all three phases of treatment (per protocol analysis), 32/45 achieved at least 30% pain intensity reduction with tramadol, and 11/45 with placebo.
We downgraded the evidence for this outcome by two levels to low quality because of the small size of studies and pooled data set, with only 60 actual events.
Participants with at least 50% pain relief
Three studies, one in cancer‐related pain and two in polyneuropathy, provided information on this outcome. It was our intention to analyse different pain conditions separately, but there were insufficient data for sensible analysis (108 participants with cancer‐related pain and 157 with polyneuropathy).
In Boureau 2003, 41/53 participants with postherpetic neuralgia achieved at least 50% pain intensity reduction with tramadol, and 31/55 with placebo, using a per protocol analysis and LOCF for withdrawals.
In Sindrup 1999, 11/34 participants achieved at least 50% pain intensity reduction with tramadol, and 3/33 with placebo, using LOCF for withdrawals. In Sindrup 2012, of those participants who completed all three phases of treatment (per protocol analysis, and probably LOCF imputation), 18/45 achieved at least 50% pain intensity reduction with tramadol, and 6/45 with placebo.
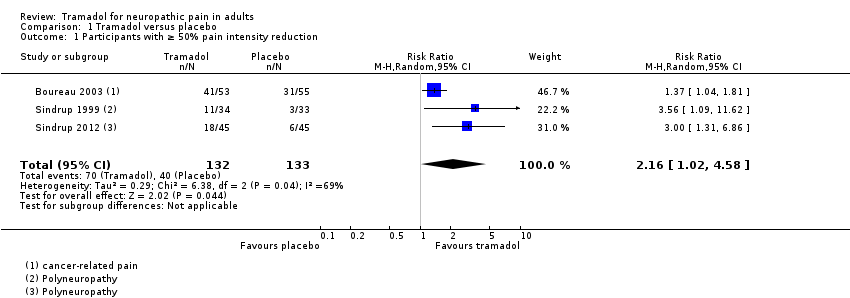
Pooling all three studies, and using a random‐effects analysis, 70/132 (53%) had at least 50% pain relief with tramadol, and 40/133 (30%) with placebo. The RR was 2.2 (95% CI 1.02 to 4.6; Analysis 1.1; Figure 3). The NNT calculated from these data was 4.4 (95% CI 2.9 to 8.9).

Forest plot of comparison: 1 Tramadol versus placebo, outcome: 1.1 Participants with ≥ 50% pain intensity reduction.
We downgraded the evidence for this outcome by two levels to low quality because of the small size of studies and pooled and heterogeneous data set, which included different types of neuropathic pain with at least one high risk of potential bias, and because of the limited duration of treatment.
PGIC much or very much improved
One study reported the number of participants who considered themselves 'much or very much improved' at the end of treatment (Norrbrink 2009). The outcome was reported by 4/23 participants with tramadol and 0/12 with placebo.
None of the participants reported being 'very much improved'.
We downgraded the evidence for this outcome by three levels to very low quality because of the small size of studies and pooled data set, and because there were only five actual events.
Other pain‐related measures of 'improvement'
Two studies did not report any of our primary efficacy outcomes, but did report group mean data indicating 'improvement'.
Arbaiza 2007 reported a mean pain intensity of 2.9/10 with tramadol and 4.3/10 with placebo at the end of treatment (baseline 7/10), and the use of antiepileptic drugs was reduced in the tramadol group, but not in the placebo group.
Harati 1998 reported a mean pain intensity of 1.4 with tramadol and 2.2 with placebo (scale 0 to 4) at the end of treatment (baseline 2.5).
Withdrawals
Lack of efficacy
Withdrawals due to lack of efficacy were reported in five studies, but Sindrup 1999 did not specify in which treatment arm they occurred (two withdrawals in second treatment phase). In two studies there were no lack of efficacy withdrawals (Norrbrink 2009; Sindrup 2012). In the remaining two studies there were 11 withdrawals in 79 participants with tramadol and 28 withdrawals in 84 participants with placebo (Arbaiza 2007; Harati 1998).
We downgraded the evidence for this outcome by two levels to low quality because of the small size of studies and pooled data set, with only 39 actual events.
Adverse events
All six studies reported on withdrawals due to adverse events (485 participants).
-
The proportion of participants who withdrew due to adverse events with tramadol was 16% (38/249, range 7.1% to 48%).
-
The proportion of participants who withdrew due to adverse events with placebo was 3% (7/236, range 0% to 17%).
-
The RR for tramadol compared with placebo was 4.1 (95% CI 2.0 to 8.4); the NNH was 8.2 (95% CI 5.8 to 14) (Analysis 1.2).
We downgraded the evidence for this outcome by two levels to low quality because of the small size of studies with only 45 actual events.
All cause
Three studies clearly reported on all withdrawals by treatment group (Arbaiza 2007;Harati 1998; Norrbrink 2009) (202 participants); in Norrbrink 2009 all the withdrawals were due to adverse events. In the other three studies there was insufficient information about either the number of participants or the treatment group.
-
The proportion of participants who withdrew due for any reason with tramadol was 34% (36/106, range 28% to 48%).
-
The proportion of participants who withdrew due for any reason with placebo was 29% (28/96, range 17% to 33%).
-
The RR for tramadol compared with placebo was 1.2 (95% CI 0.75 to 1.8); the NNH was not calculated (Analysis 1.3).
We downgraded the evidence for this outcome by three levels to very low quality because of the small size of studies and pooled data set, and with only 64 actual events.
Adverse events
Any adverse event
Four studies reported the number of participants who experienced one or more adverse events (Arbaiza 2007; Boureau 2003; Norrbrink 2009; Sindrup 1999) (266 participants).
-
The proportion of participants who experienced one or more adverse events with tramadol was 58% (80/139, range 30% to 91%).
-
The proportion of participants who experienced one or more adverse events with placebo was 34% (43/127, range 22% to 58%).
-
The RR for tramadol compared with placebo was 1.6 (95% CI 1.2 to 2.1); the NNH was 4.2 (95% CI 2.8 to 8.3) (Analysis 1.4).
We downgraded the evidence for this outcome by two levels to low quality because of the small size of studies and with only 123 actual events.
Serious adverse events
Four studies did not report any serious adverse events (Arbaiza 2007; Harati 1998; Norrbrink 2009; Sindrup 1999). Boureau 2003 reported that three participants experienced serious adverse events; it is not clear which treatment these participants were receiving, but it is likely that they were in the tramadol group, since there were no withdrawals due to adverse events in the placebo group. The nature of the events was not reported. In Sindrup 2012, one participant each in the tramadol and active comparator (GRT9906) groups, and none in the placebo group experienced serious adverse events. The event with tramadol was vertigo. No deaths were reported.
We downgraded the evidence for this outcome by three levels to very low quality because of the small size of studies and pooled data set, and because there were only four actual events.
Specific adverse events
Specific adverse events were not consistently reported, with studies reporting events without frequencies, only the most common events, or by body system. They included nausea, somnolence, constipation, dry mouth, general malaise, dizziness, tiredness, headache, dyspepsia, diarrhoea, sweating, sleep disorders, and micturition problems. Most events were more common with tramadol than placebo; intensity was generally reported as mild to moderate with tramadol and mild with placebo.
We were able to assess the frequency of some specific adverse events (Analysis 1.5).
| Event | Studies | Participants | % with tramadol | % with placebo | RR (95% CI) | NNH (95% CI) |
| Nausea | 6 | 508 | 26 | 6.9 | 3.6 (2.2 to 5.9) | 5.2 (3.9 to 7.6) |
| Constipation | 5 | 381 | 29 | 6.5 | 4.1 (2.4 to 7.2) | 4.4 (3.4 to 6.5) |
| Tiredness/fatigue | 4 | 345 | 33 | 10 | 3.2 (1.9 to 5.4) | 4.2 (3.2 to 6.5) |
| Dizziness | 3 | 214 | 36 | 8.9 | 3.7 (1.9 to 7.1) | 3.7 (2.6 to 5.9) |
| Dry mouth | 3 | 214 | 29 | 11 | 2.4 (1.4 to 4.4) | 5.5 (3.5 to 13) |
| CI: confidence interval; NNH: number needed to treat for one additional harmful outcome; RR: risk ratio | ||||||
We graded the evidence for specific adverse events as low quality. While there was a limited number of events, there was consistency between studies.
Discussion
Summary of main results
Participants in these studies typically had moderate or severe neuropathic pain, often long‐lasting, and with an initial average pain score of around 6/10 at the start of the studies. The primary pain outcomes of this review were 'substantial' pain relief, ideally the reduction in pain intensity by 50% or more, and 'moderate' pain relief, a reduction by 30% or more, both sustained over the duration of the trial, which was typically three months. These outcomes are judged as desirable by people with pain (Moore 2013a).
Only some of the studies reported pain outcomes of interest to people with neuropathic pain, and we could not perform analyses according to different types of neuropathic pain. This is important because different types of neuropathic pain can respond differently to the same treatment when studies are otherwise identical (Moore 2009).
The evidence that tramadol is beneficial for neuropathic pain is very limited, despite it being commonly used and recommended for the condition (NICE 2013). The conclusion of this updated review is therefore different from that of the original (Hollingshead 2006). The evidence of any benefit from tramadol was of low or very low quality, meaning that the likelihood is very high that the effect will be substantially different from the estimate in this systematic review. This quality assessment is due predominantly to higher standards of evidence now being applied, including a growing concern about possible overestimation of treatment effect in small studies.
An important issue is that of study size and the overall amount of information available for analysis. There are issues over both random chance effects with small amounts of data, and potential bias in small studies, especially in pain (Dechartres 2013; Dechartres 2014; Moore 1998; Nüesch 2010; Thorlund 2011). Another potentially major positive bias towards experimental intervention is the use of LOCF imputation (Moore 2012). Cochrane Reviews have been criticised for perhaps over‐emphasising results of underpowered studies or analyses (AlBalawi 2013; Turner 2013). On the other hand, it may be unethical to ignore potentially important information from small studies or to randomise more patients if a meta‐analysis including small studies has provided conclusive evidence.
Overall completeness and applicability of evidence
Study participants were typical of people with neuropathic pain who are eligible to take part in clinical trials. As is usual, exclusion criteria included other significant comorbidities or pain from other causes, contraindications to tramadol or other opioids, and a history of addiction or drug or alcohol abuse. The problems that attend small studies, and other methodological considerations make the evidence less than complete and not easily applicable to many people with neuropathic pain. While problems of bias surrounding the studies might be expected to produce a large treatment effect, no such large treatment effect was seen.
Doses of oral tramadol in the range of 200 mg to 400 mg daily were those typically used to treat chronic pain.
One other issue of importance is that study duration was generally four to six weeks, arguably inadequate for a long‐term pain condition.
Quality of the evidence
Five of the six included studies had at least one major risk of bias. Poor reporting of useful pain outcomes rendered the evidence quality low to very low. Pooled analyses were mostly on only about 200 participants, where chance effects are possible (Moore 1998). In view of the small sample sizes, as well as uncertainties for other possible risks of bias, we chose to downgrade the quality of most of the evidence by three levels to very low quality. Very low quality means that this research does not provide a reliable indication of the likely effect. The likelihood that the effect will be substantially different from the estimate produced here is very high.
Potential biases in the review process
We know of no potential biases in the review process. We had planned to calculate the number of participants who would need to be in trials with zero effect (risk ratio of 1.0) needed for the point estimate of the NNT to increase beyond a clinically useful level (Moore 2008), but this method is not applicable with low effect sizes and uncertain results.
Agreements and disagreements with other studies or reviews
This updated review comes to a different conclusion to the previous version of the review (Hollingshead 2006). That version concluded that tramadol is an effective treatment for neuropathic pain, but did not apply such stringent conditions to quality or bias, or benefit from recent work understanding the overestimation of effect in small studies. Another Cochrane Review examined tramadol for treating osteoarthritis (Cepeda 2006). That review concluded that tramadol or tramadol/paracetamol decreased pain intensity, but the benefits were small (a decrease of about 12% in average pain intensity). Finnerup and colleagues calculated an NNT of 4.7 (3.6 to 6.7) based on six studies with over 700 participants (Finnerup 2015), but used different quality criteria and included one study with a tramadol/paracetamol combination.

Study flow diagram for the updated search

Risk of bias summary: review authors' judgements about each risk of bias item for each included study.

Forest plot of comparison: 1 Tramadol versus placebo, outcome: 1.1 Participants with ≥ 50% pain intensity reduction.
Comparison 1 Tramadol versus placebo, Outcome 1 Participants with ≥ 50% pain intensity reduction.
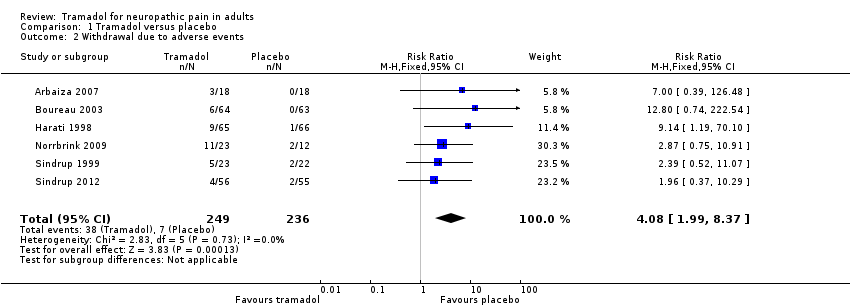
Comparison 1 Tramadol versus placebo, Outcome 2 Withdrawal due to adverse events.
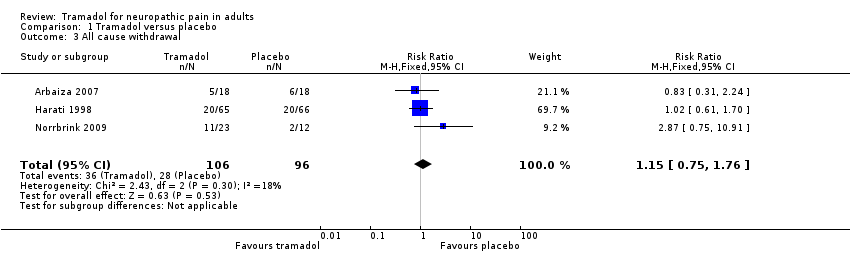
Comparison 1 Tramadol versus placebo, Outcome 3 All cause withdrawal.

Comparison 1 Tramadol versus placebo, Outcome 4 Participants with any adverse event.

Comparison 1 Tramadol versus placebo, Outcome 5 Participants with specific adverse events.
| Tramadol compared with placebo for neuropathic pain | ||||||
| Patient or population: adults with neuropathic pain (any origin) Settings: community Intervention: oral tramadol (typically started at a dose of about 100 mg daily and increased over 1 to 2 weeks to a maximum of 400 mg daily) Comparison: placebo | ||||||
| Outcomes (at trial end) | Probable outcome with | Probable outcome with | Relative effect | No of participants | Quality of the evidence | Comments |
| At least 30% reduction in pain | Not analysed | Not analysed | Not analysed | 157 participants (2 studies) 60 events | Low quality1 | ‐ |
| At least 50% reduction in pain | 530 per 1000 | 300 per 1000 | RR 2.2 (1.02, 4.6) NNT 4.4 (2.9 to 8.8) | 265 participants (3 studies) 110 events | Low quality1 | ‐ |
| PGIC much or very much improved | Not analysed | Not analysed | Not analysed | 35 participants (1 study) 4 events | Very low quality2 | ‐ |
| Withdrawal due to adverse event | 160 per 100 | 30 per 1000 | RR 4.1 (2.0 to 8.4) NNH 8.2 (5.8 to 14) | 485 participants (6 studies) 45 events | Low quality1 | ‐ |
| Participants experiencing any adverse event | 580 per 1000 | 340 per 1000 | RR 1.6 (1.2 to 2.1) NNH 4.2 (2.8 to 8.3) | 266 participants (4 studies) 123 events | Low quality1 | ‐ |
| Serious adverse events | 4 serious adverse events reported in total | Not all studies reported specifically on serious adverse events | Very low quality2 | ‐ | ||
| Death | No data | No data | Not calculated | No data | Very low quality3 | ‐ |
| CI: confidence interval; NNH: number needed to treat for one additional harmful outcome; PGIC: Patient Global Impression of Change; RR: risk ratio | ||||||
| Descriptors for levels of evidence (EPOC 2015): † Substantially different: a large enough difference that it might affect a decision. | ||||||
| 1Downgraded 2 levels due to small number of studies and participants and relatively few events, and several sources of potential bias. | ||||||
| Outcome or subgroup title | No. of studies | No. of participants | Statistical method | Effect size |
| 1 Participants with ≥ 50% pain intensity reduction Show forest plot | 3 | 265 | Risk Ratio (M‐H, Random, 95% CI) | 2.16 [1.02, 4.58] |
| 2 Withdrawal due to adverse events Show forest plot | 6 | 485 | Risk Ratio (M‐H, Fixed, 95% CI) | 4.08 [1.99, 8.37] |
| 3 All cause withdrawal Show forest plot | 3 | 202 | Risk Ratio (M‐H, Fixed, 95% CI) | 1.15 [0.75, 1.76] |
| 4 Participants with any adverse event Show forest plot | 4 | 266 | Risk Ratio (M‐H, Fixed, 95% CI) | 1.61 [1.22, 2.13] |
| 5 Participants with specific adverse events Show forest plot | 6 | Risk Ratio (M‐H, Fixed, 95% CI) | Subtotals only | |
| 5.1 Nausea | 6 | 508 | Risk Ratio (M‐H, Fixed, 95% CI) | 3.62 [2.23, 5.88] |
| 5.2 Constipation | 5 | 381 | Risk Ratio (M‐H, Fixed, 95% CI) | 4.11 [2.36, 7.16] |
| 5.3 Tiredness/fatigue/somnolence | 4 | 345 | Risk Ratio (M‐H, Fixed, 95% CI) | 3.22 [1.93, 5.36] |
| 5.4 Dizziness | 3 | 214 | Risk Ratio (M‐H, Fixed, 95% CI) | 3.72 [1.94, 7.12] |
| 5.5 Dry mouth | 3 | 214 | Risk Ratio (M‐H, Fixed, 95% CI) | 2.44 [1.35, 4.42] |