Selen‐Supplementierung bei lebensbedrohlich erkrankten Erwachsenen
Información
- DOI:
- https://doi.org/10.1002/14651858.CD003703.pub3Copiar DOI

- Base de datos:
-
- Cochrane Database of Systematic Reviews
- Versión publicada:
-
- 27 julio 2015see what's new
- Tipo:
-
- Intervention
- Etapa:
-
- Review
- Grupo Editorial Cochrane:
-
Grupo Cochrane de Atención crítica y de emergencia
- Copyright:
-
- Copyright © 2018 The Cochrane Collaboration. Published by John Wiley & Sons, Ltd.
Cifras del artículo
Altmetric:
Citado por:
Autores
Contributions of authors
Updated review
Mikkel Allingstrup (MA), Arash Afshari (AA).
MA and AA searched the literature, performed quality assessment and extraction of data from trials, and wrote the review update.
Original published review and first update
All four authors (Alison Avenell, David W Noble, John Barr, Thomas Engelhardt) were involved in protocol development, searched the literature, performed quality assessment and data abstraction of trials, and wrote the review (Avenell 2004).
Sources of support
Internal sources
-
Herlev Hospital, University of Copenhagen, Denmark.
Department of Anaesthesia and Intensive Care
-
Rigshospitalet, University of Copenhagen, Denmark.
Anaesthesia and Surgical Clinic Department 4013
External sources
-
No sources of support supplied
Declarations of interest
Mikkel Allingstrup declares no conflicts of interest.
Arash Afshari declares no conflicts of interest.
Acknowledgements
We thank the review authors of the first edition of this review, Alison Avenell, David Noble, John Barr and Tom Engelhardt, for their hard work (Avenell 2004).
Furthermore we thank Mette Berger, Helena Brodska, Xavier Forceville, Roland Gärtner, Frank Bloos, Arndt Kiessling, William Manzanares and Tomoko Motohashifor for providing further information about their trials. We are grateful to Matilde Jo Allingstrup, Tim Søvæld Nielsen, Jesper Røjskjær and Anders Perner for their help and editorial advice during this review update. We acknowledge Dr Karen Hovhannisyan (Trials Search Co‐ordinator, Cochrane Anaesthesia, Critical and Emergency Care Group (ACE) ) for his assistance in providing our different search strategies. We thank Jane Cracknell (Managing Editor, ACE) for her valuable assistance during the entire process.
Version history
| Published | Title | Stage | Authors | Version |
| 2015 Jul 27 | Selenium supplementation for critically ill adults | Review | Mikkel Allingstrup, Arash Afshari | |
| 2004 Oct 18 | Selenium supplementation for critically ill adults | Review | Alison Avenell, David W Noble, John Barr, Thomas Engelhardt | |
| 2002 Jul 22 | Selenium supplementation for critically ill adults | Protocol | Alison Avenell, David D Noble, John Barr, Thomas Engelhardt | |
Differences between protocol and review
In this review update we have revised the first primary endpoint to overall mortality, which is the longest time of follow‐up. Mortality by duration (28 and 90 days) is preserved as our second primary endpoint. We performed a TSA and included it in this review update.
Notes
2015 update: we updated the methods, included full 'Risk of bias' tables and 'Summary of findings' tables. We used TSA.
This review was also updated in 2007 (Avenell 2004). At that time Cochrane updates did not earn a new citation unless they had new authors or a change to conclusions. The 2007 version of this review included three new trials; two of these were previously classified as ongoing trials (Angstwurm 2006; Lindner 2004; Mishra 2007). The conclusions of the 2007 review were unchanged. Therefore the 2007 update did not earn a new citation
We thank Mathew Zacharias, Nathan Pace, Naji Abumrad, Daren Heyland, Saúl Rugeles, Ann Moller, Iveta Simera, Kathie Godfrey and Amy Godfrey Arkle for their help and editorial advice during the preparation of the original review (Avenell 2004).
Keywords
MeSH
Medical Subject Headings (MeSH) Keywords
- *Dietary Supplements;
- Antioxidants [adverse effects, *therapeutic use];
- Azoles [adverse effects, *therapeutic use];
- Critical Illness [mortality, *therapy];
- Isoindoles;
- Organoselenium Compounds [adverse effects, *therapeutic use];
- Randomized Controlled Trials as Topic;
- Sodium Selenite [*therapeutic use];
Medical Subject Headings Check Words
Adult; Humans;
PICO
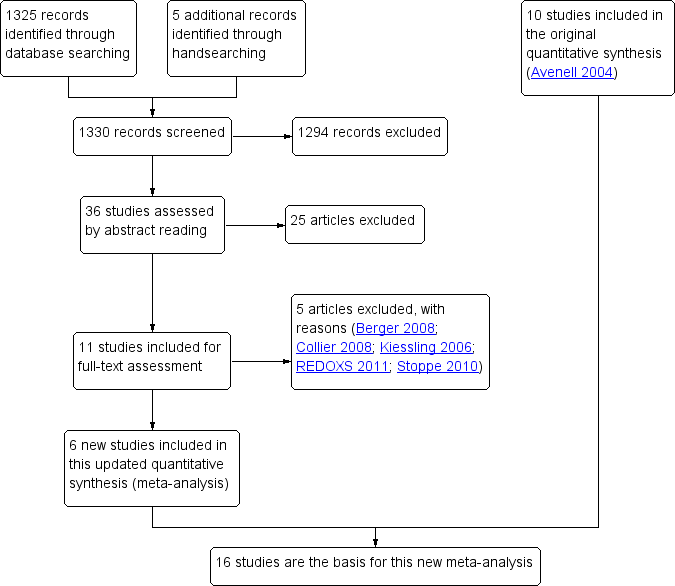
Study flow diagram for the updated review. (In the original article, Avenell 2004, 10 studies were included and 11 studies were excluded with reasons. Three were awaiting classification, of which one has now been excluded (Kiessling 2006). Two studies are still ongoing).
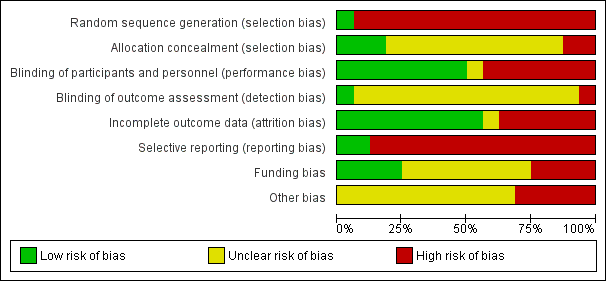
'Risk of bias' graph: review authors' judgements about each 'Risk of bias' item presented as percentages across all included studies.
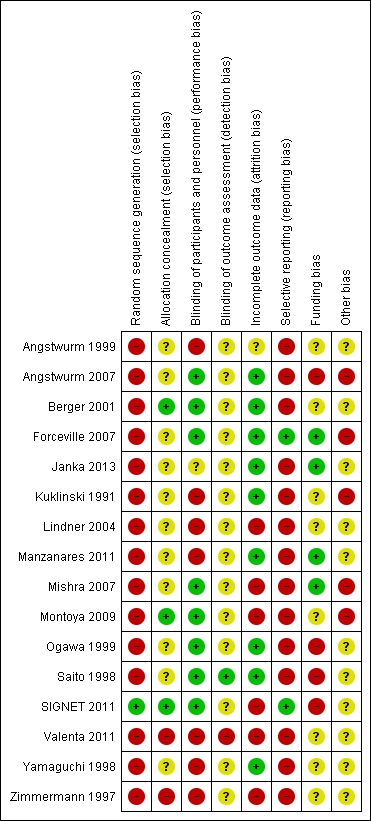
'Risk of bias' summary: review authors' judgements about each 'Risk of bias' item for each included study.
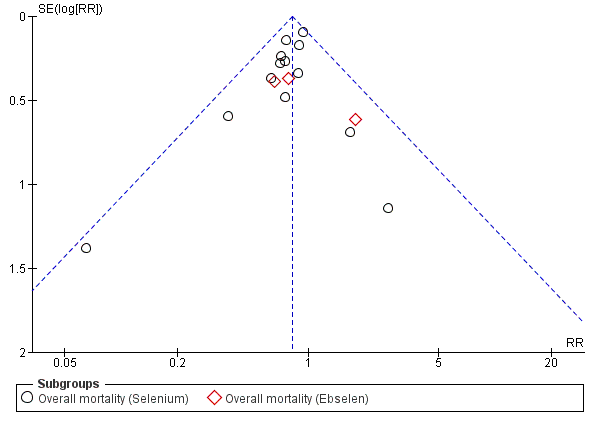
Funnel plot of comparison: 1.2 Overall mortality (regardless of the follow‐up period).

Trial sequential analysis (TSA) of all trials examining the effect of Selenium supplementation on mortality among critically ill. Using a control event proportion of 32% found in the included trials, with a type 1 error of 5% and a 18% relative risk reduction (80% power), the trial sequential monitoring boundary for benefit is not crossed by the z‐curve. However, these lines are very close to crossing each other which may indicate a probability of lack of random error for the conclusion of an effect of 18% relative risk reduction even though the required information size (N = 2605) has not yet been reached. However, caution must be exerted when interpreting the results of this TSA since all included studies are at high risk of bias and the intervention effect is likely to have been overestimated in the traditional meta‐analysis.
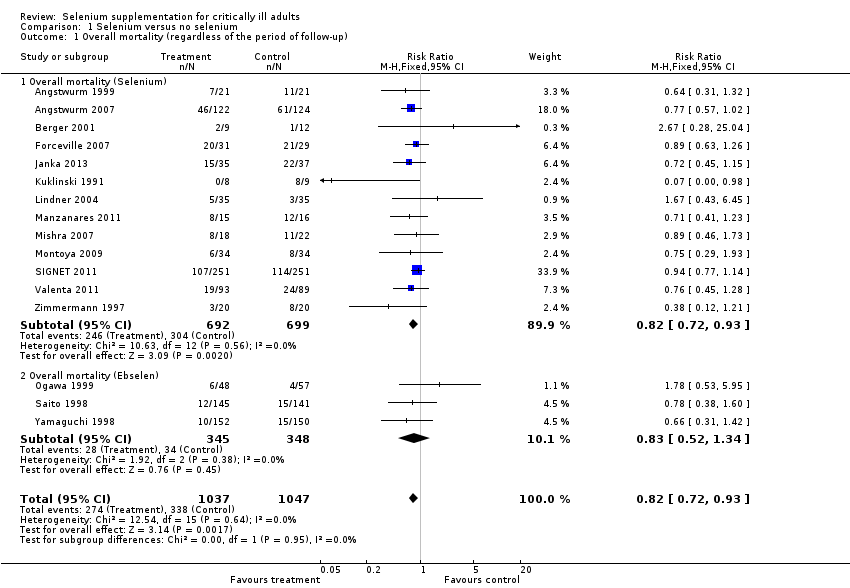
Comparison 1 Selenium versus no selenium, Outcome 1 Overall mortality (regardless of the period of follow‐up).
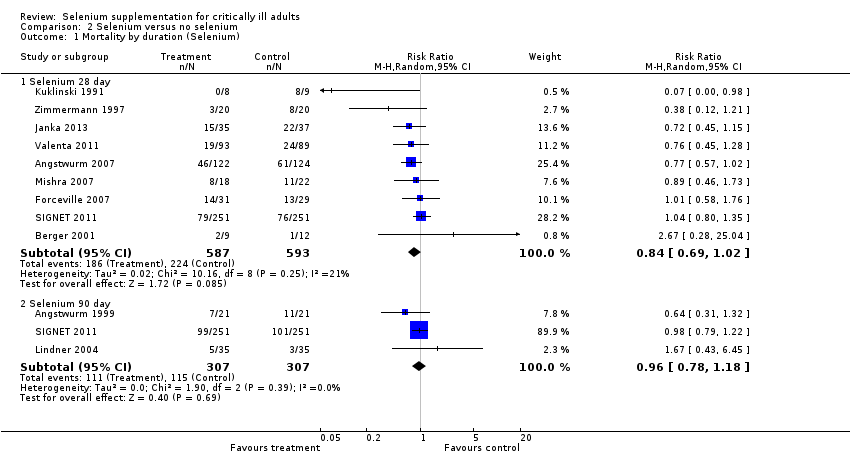
Comparison 2 Selenium versus no selenium, Outcome 1 Mortality by duration (Selenium).
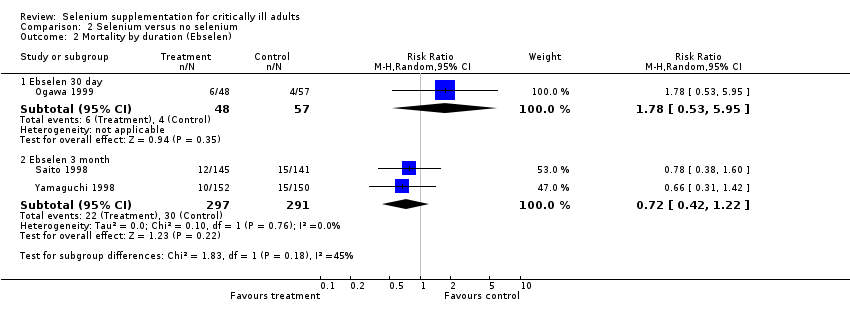
Comparison 2 Selenium versus no selenium, Outcome 2 Mortality by duration (Ebselen).
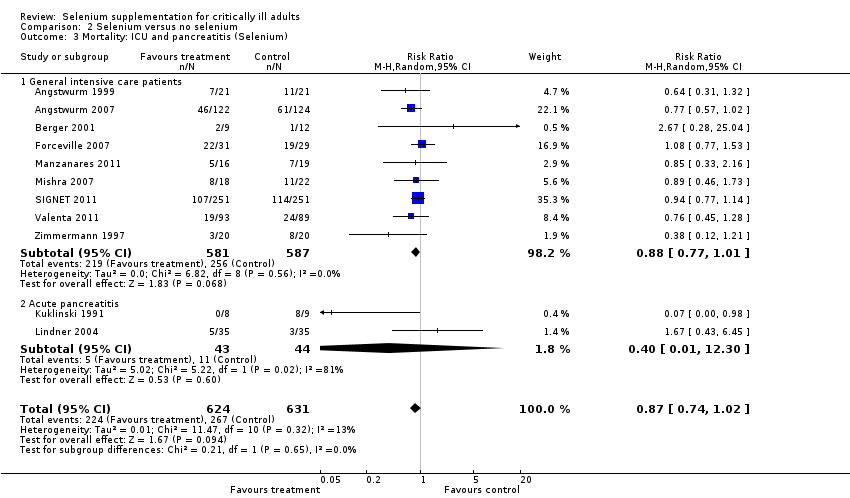
Comparison 2 Selenium versus no selenium, Outcome 3 Mortality: ICU and pancreatitis (Selenium).

Comparison 3 Selenium versus no selenium, Outcome 1 Number of infected participants.

Comparison 4 Selenium versus no selenium, Outcome 1 Number of participants with adverse event.

Comparison 4 Selenium versus no selenium, Outcome 2 Length of stay in ICU (Selenium).
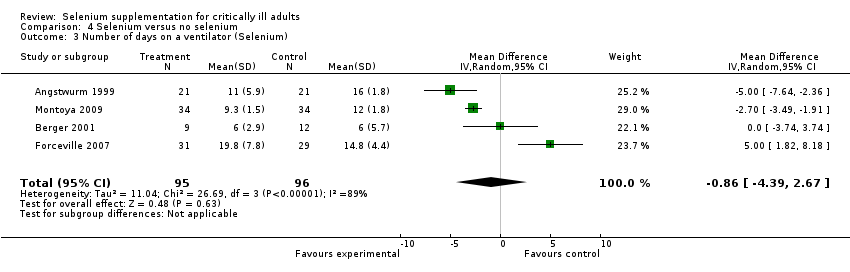
Comparison 4 Selenium versus no selenium, Outcome 3 Number of days on a ventilator (Selenium).

Comparison 4 Selenium versus no selenium, Outcome 4 Length of hospital stay (Selenium).
| Selenium supplementation compared with control for critically ill adults | |||||
| Patient or population: Patients with critical illnesses Settings: ICU setting Intervention: Selenium or ebselen | |||||
| Outcomes | Illustrative comparative risks* (95% CI) | Relative effect | No. of participants | Quality of the evidence | |
| Assumed risk | Corresponding risk | ||||
| Control | Selenium | ||||
| Overall mortality (regardless of the follow‐up period) | All patients are high risk population | RR 0.82, 95% CI 0.72 to 0.93) | 1391 | ⊕⊝⊝⊝ | |
| ICU length of stay (selenium) | The mean length of stay in an ICU ranged across control groups from | The mean length of stay in an ICU ranged across intervention groups from | MD 0.54, 95% CI ‐2.27 to 3.34 | 934 | ⊕⊝⊝⊝ |
| Days on ventilator (selenium) | The mean days on ventilator ranged across control groups from 6 days to 16 days | The mean days on ventilator ranged across intervention groups from | MD ‐0.86, 95% CI ‐4.39 to 2.67 | 191 | ⊕⊝⊝⊝ |
| Length of hospital stay (selenium) | The mean length of hospital stay ranged across control groups from | The mean length of hospital stay ranged across intervention groups from | MD ‐3.33. 95% CI ‐5.22 to ‐1.44 | 693 | ⊕⊝⊝⊝ |
| GRADE Working Group grades of evidence | |||||
| Abbreviations: CI: confidence interval; RR: risk ratio; MD: mean difference; ICU: intensive care unit. | |||||
| Trial | Selenium | Control |
| 22.8 days (20.8) | 26.5 days (22) | |
| 15.1 days (10) | 12.7 days (9) | |
| 7,5 days (3.5) | 9 days (7.1) | |
| 22.3 days (9.6) | 17 days (8.7) | |
| 14 days (11) | 13days (6) | |
| 21.3 days (16.2) | 20.8 days (21.8) | |
| 14.5 days (4.6) | 16.7 days (5.9) | |
| MD 0.54 (95% CI ‐2.27 to 3.34, I² statistic = 72%, random‐effects model) | ||
| All findings given as mean (SD). If the original figures were provided in median (range) or interquartile range, we converted them to mean (SD) (Hozo 2005). | ||
| Trial | Selenium | Control |
| 11 days (5.9) | 16 (12.6) | |
| 6 days (2.9) | 6 days (5.7) | |
| 19.8 days (7.8) | 14.8 days (4.4) | |
| 9.3 days (1.5) | 12 days (1.8) | |
| MD ‐0.86 (95% CI ‐4.39 to 2.67, I² statistic = 89%, random‐effects model) | ||
| All findings given as mean (SD). If the original figures were provided in median (range), we converted them to mean (SD) (Hozo 2005). | ||
| Trial | Selenium | Control |
| 38.5 days (24.4) | 39.5 days (15.7) | |
| 83 days (73.5) | 62.8 days (30.2) | |
| 31.3 days (18) | 32 days (11.6) | |
| 12.5 days (0.6) | 17 days (1.7) | |
| 31.7 days (10.9) | 33.8 days (12.4) | |
| MD ‐3.33 (95% CI ‐5.22 to ‐1.44, I² statistic = 42%, random‐effects model) | ||
| All findings given as mean (SD). If the original figures were provided in median (range) or interquartile range, we converted them to mean (SD) (Hozo 2005). | ||
| Outcome or subgroup title | No. of studies | No. of participants | Statistical method | Effect size |
| 1 Overall mortality (regardless of the period of follow‐up) Show forest plot | 16 | 2084 | Risk Ratio (M‐H, Fixed, 95% CI) | 0.82 [0.72, 0.93] |
| 1.1 Overall mortality (Selenium) | 13 | 1391 | Risk Ratio (M‐H, Fixed, 95% CI) | 0.82 [0.72, 0.93] |
| 1.2 Overall mortality (Ebselen) | 3 | 693 | Risk Ratio (M‐H, Fixed, 95% CI) | 0.83 [0.52, 1.34] |
| Outcome or subgroup title | No. of studies | No. of participants | Statistical method | Effect size |
| 1 Mortality by duration (Selenium) Show forest plot | 11 | Risk Ratio (M‐H, Random, 95% CI) | Subtotals only | |
| 1.1 Selenium 28 day | 9 | 1180 | Risk Ratio (M‐H, Random, 95% CI) | 0.84 [0.69, 1.02] |
| 1.2 Selenium 90 day | 3 | 614 | Risk Ratio (M‐H, Random, 95% CI) | 0.96 [0.78, 1.18] |
| 2 Mortality by duration (Ebselen) Show forest plot | 3 | Risk Ratio (M‐H, Random, 95% CI) | Subtotals only | |
| 2.1 Ebselen 30 day | 1 | 105 | Risk Ratio (M‐H, Random, 95% CI) | 1.78 [0.53, 5.95] |
| 2.2 Ebselen 3 month | 2 | 588 | Risk Ratio (M‐H, Random, 95% CI) | 0.72 [0.42, 1.22] |
| 3 Mortality: ICU and pancreatitis (Selenium) Show forest plot | 11 | 1255 | Risk Ratio (M‐H, Random, 95% CI) | 0.87 [0.74, 1.02] |
| 3.1 General intensive care patients | 9 | 1168 | Risk Ratio (M‐H, Random, 95% CI) | 0.88 [0.77, 1.01] |
| 3.2 Acute pancreatitis | 2 | 87 | Risk Ratio (M‐H, Random, 95% CI) | 0.40 [0.01, 12.30] |
| Outcome or subgroup title | No. of studies | No. of participants | Statistical method | Effect size |
| 1 Number of infected participants Show forest plot | 9 | Risk Ratio (M‐H, Random, 95% CI) | Subtotals only | |
| 1.1 Selenium | 6 | 934 | Risk Ratio (M‐H, Random, 95% CI) | 0.96 [0.75, 1.23] |
| 1.2 Ebselen | 3 | 685 | Risk Ratio (M‐H, Random, 95% CI) | 0.60 [0.36, 1.02] |
| Outcome or subgroup title | No. of studies | No. of participants | Statistical method | Effect size |
| 1 Number of participants with adverse event Show forest plot | 8 | Risk Ratio (M‐H, Random, 95% CI) | Subtotals only | |
| 1.1 Selenium | 6 | 925 | Risk Ratio (M‐H, Random, 95% CI) | 1.03 [0.85, 1.24] |
| 1.2 Ebselen | 2 | 588 | Risk Ratio (M‐H, Random, 95% CI) | 1.16 [0.40, 3.36] |
| 2 Length of stay in ICU (Selenium) Show forest plot | 7 | 934 | Mean Difference (IV, Random, 95% CI) | 0.54 [‐2.27, 3.34] |
| 3 Number of days on a ventilator (Selenium) Show forest plot | 4 | 191 | Mean Difference (IV, Random, 95% CI) | ‐0.86 [‐4.39, 2.67] |
| 4 Length of hospital stay (Selenium) Show forest plot | 5 | 693 | Mean Difference (IV, Random, 95% CI) | ‐3.33 [‐5.22, ‐1.44] |