Selen‐Supplementierung bei lebensbedrohlich erkrankten Erwachsenen
Appendices
Appendix 1. Cochrane Central Register of Controlled Trials search strategy
#1 MeSH descriptor: [Selenium] explode all trees
#2 MeSH descriptor: [Selenium Compounds] explode all trees
#3 selen*
#4 ebselen
#5 #1 or #2 or #3 or #4
#6 #5
Appendix 2. MEDLINE (Ovid SP) and Healthstar search strategy
1. exp Selenium Compounds/ or exp Selenium/ or (selen* or ebselen*).mp.2. (randomized controlled trial.pt. or controlled clinical trial.pt.or randomized.ab. or placebo.ab. or clinical trials as topic.sh. or randomly.ab. or trial.ti.) not (animals.sh not (humans.sh and animals.sh))
3. 1 and 2
Appendix 3. EMBASE (Ovid SP) search strategy
1. exp selenium derivative/ or exp selenium/ or (selen* or ebselen*).ti,ab.
2. (placebo.sh. or controlled study.ab. or random*.ti,ab. or trial*.ti,ab. or ((singl* or doubl* or trebl* or tripl*) adj3 (blind* or mask*)).ti,ab.) not (animals not (humans and animals)).sh.
3. 1 and 2
Appendix 4. CAB abstracts search strategy
1. random$.tw
2. trials$.tw
3. placebo$.tw
4. 1 or 2 or 3
5. selen$.tw
6. ebselen.tw
7. 5 or 6
8. 4 and 7
Appendix 5. BIOSIS search strategy
#1 TI=selen* or TI=ebselen*
#2 TS=(random* or trial* or placebo*)
#3 #1 and #2
Appendix 6. CINAHL (EBSCOhost) search strategy
S1 ((MM "Selenium") OR (MM "Selenium Compounds")) or selen* or ebselen*
S2 random* or ((clinical or controlled) N3 trials) or placebo* or multicenter or prospective or ((blind* or mask*) N3 (single or double or triple or treble))
S3 S1 and S2
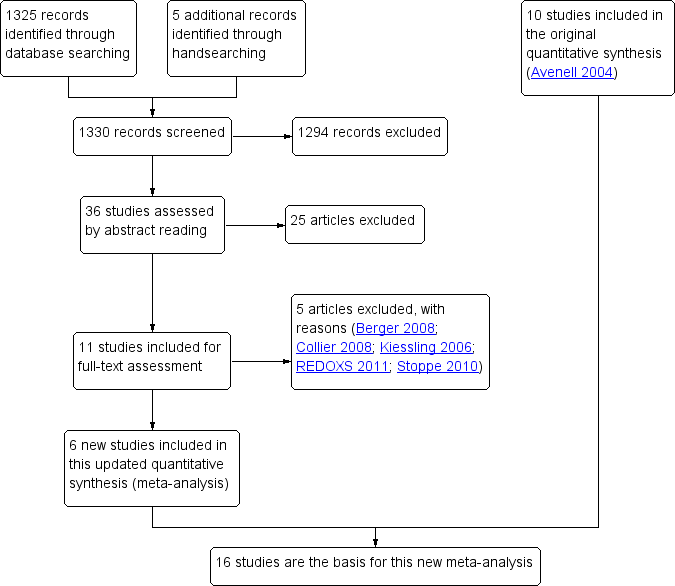
Study flow diagram for the updated review. (In the original article, Avenell 2004, 10 studies were included and 11 studies were excluded with reasons. Three were awaiting classification, of which one has now been excluded (Kiessling 2006). Two studies are still ongoing).
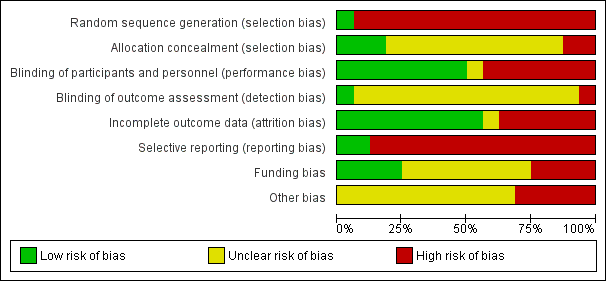
'Risk of bias' graph: review authors' judgements about each 'Risk of bias' item presented as percentages across all included studies.
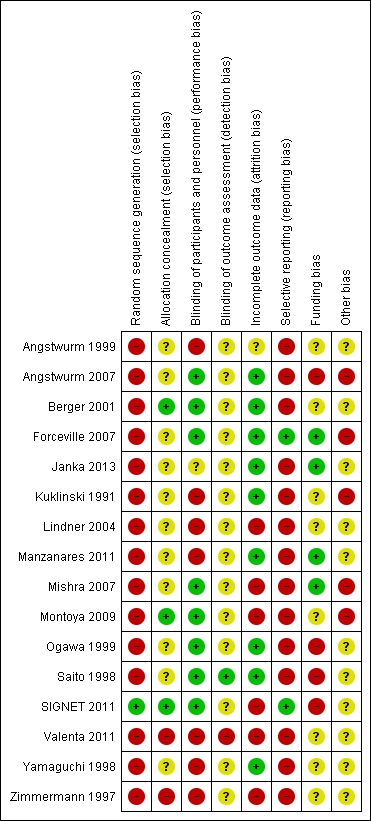
'Risk of bias' summary: review authors' judgements about each 'Risk of bias' item for each included study.
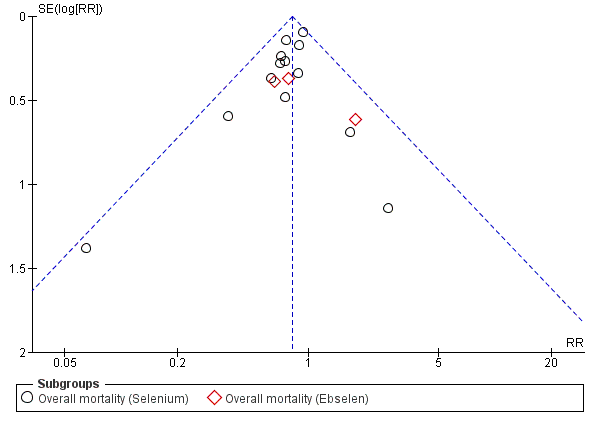
Funnel plot of comparison: 1.2 Overall mortality (regardless of the follow‐up period).

Trial sequential analysis (TSA) of all trials examining the effect of Selenium supplementation on mortality among critically ill. Using a control event proportion of 32% found in the included trials, with a type 1 error of 5% and a 18% relative risk reduction (80% power), the trial sequential monitoring boundary for benefit is not crossed by the z‐curve. However, these lines are very close to crossing each other which may indicate a probability of lack of random error for the conclusion of an effect of 18% relative risk reduction even though the required information size (N = 2605) has not yet been reached. However, caution must be exerted when interpreting the results of this TSA since all included studies are at high risk of bias and the intervention effect is likely to have been overestimated in the traditional meta‐analysis.
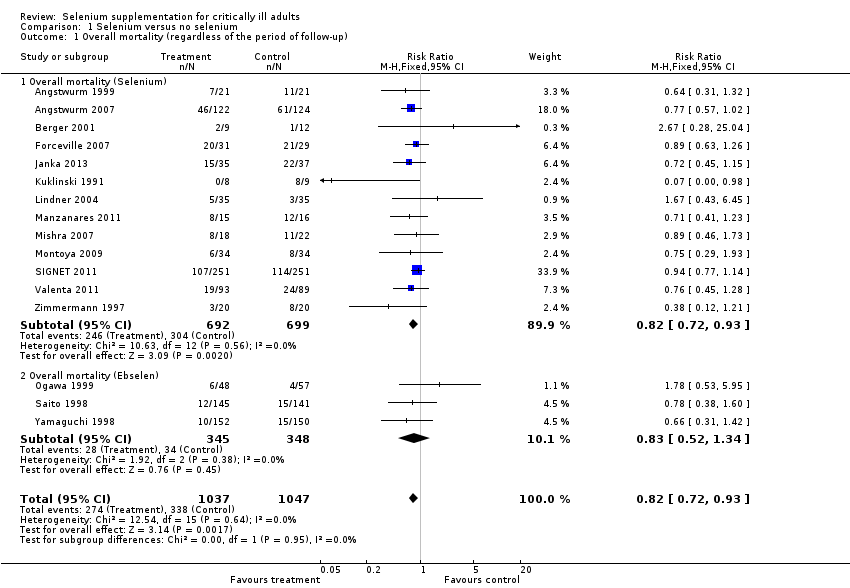
Comparison 1 Selenium versus no selenium, Outcome 1 Overall mortality (regardless of the period of follow‐up).
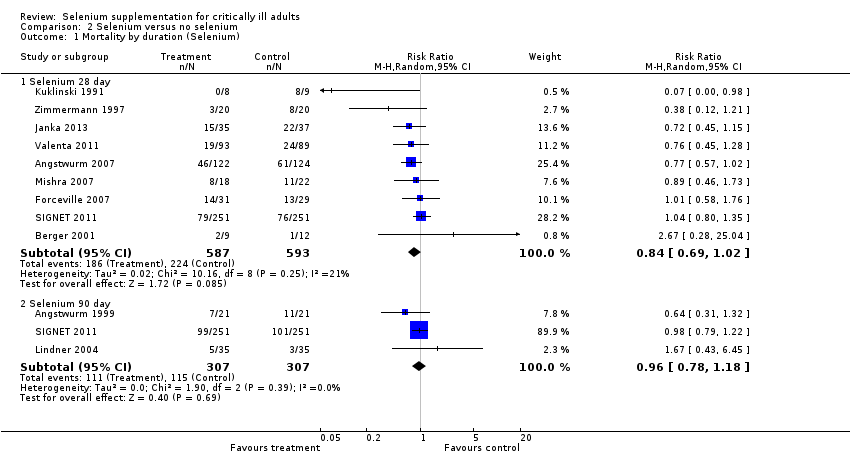
Comparison 2 Selenium versus no selenium, Outcome 1 Mortality by duration (Selenium).
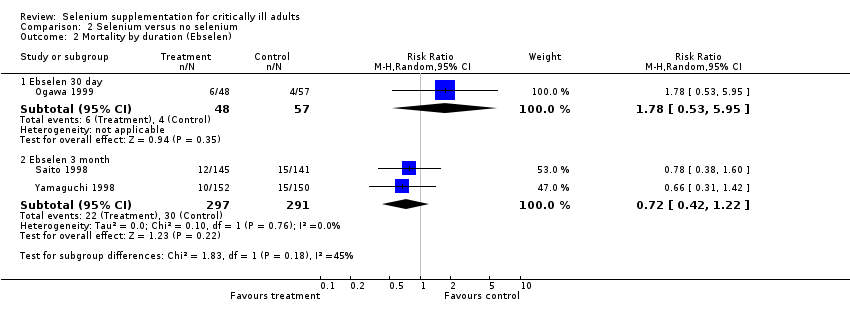
Comparison 2 Selenium versus no selenium, Outcome 2 Mortality by duration (Ebselen).
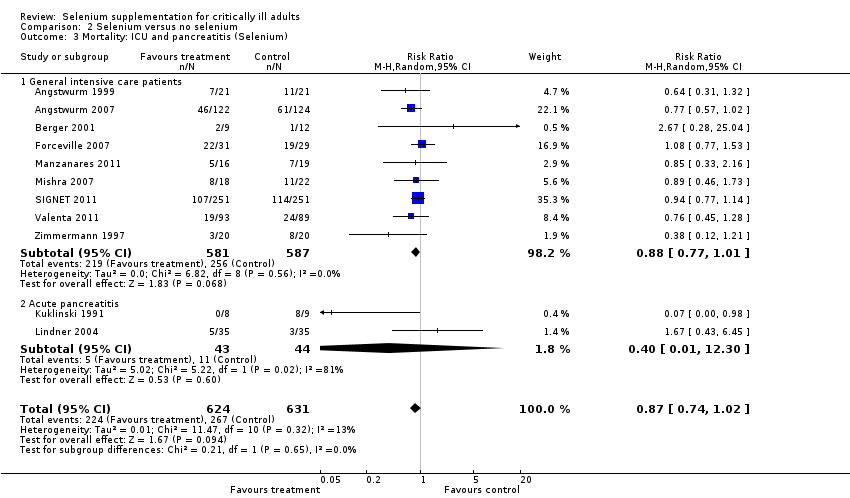
Comparison 2 Selenium versus no selenium, Outcome 3 Mortality: ICU and pancreatitis (Selenium).

Comparison 3 Selenium versus no selenium, Outcome 1 Number of infected participants.

Comparison 4 Selenium versus no selenium, Outcome 1 Number of participants with adverse event.

Comparison 4 Selenium versus no selenium, Outcome 2 Length of stay in ICU (Selenium).
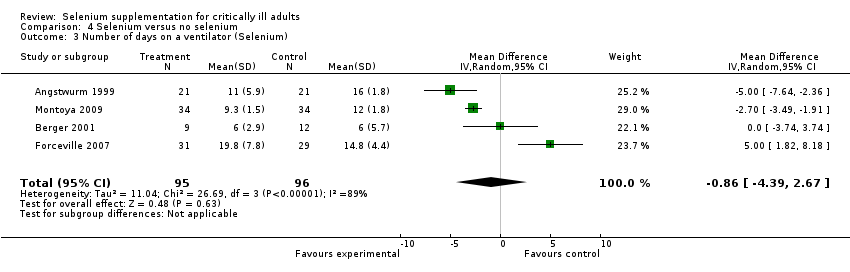
Comparison 4 Selenium versus no selenium, Outcome 3 Number of days on a ventilator (Selenium).

Comparison 4 Selenium versus no selenium, Outcome 4 Length of hospital stay (Selenium).
| Selenium supplementation compared with control for critically ill adults | |||||
| Patient or population: Patients with critical illnesses Settings: ICU setting Intervention: Selenium or ebselen | |||||
| Outcomes | Illustrative comparative risks* (95% CI) | Relative effect | No. of participants | Quality of the evidence | |
| Assumed risk | Corresponding risk | ||||
| Control | Selenium | ||||
| Overall mortality (regardless of the follow‐up period) | All patients are high risk population | RR 0.82, 95% CI 0.72 to 0.93) | 1391 | ⊕⊝⊝⊝ | |
| ICU length of stay (selenium) | The mean length of stay in an ICU ranged across control groups from | The mean length of stay in an ICU ranged across intervention groups from | MD 0.54, 95% CI ‐2.27 to 3.34 | 934 | ⊕⊝⊝⊝ |
| Days on ventilator (selenium) | The mean days on ventilator ranged across control groups from 6 days to 16 days | The mean days on ventilator ranged across intervention groups from | MD ‐0.86, 95% CI ‐4.39 to 2.67 | 191 | ⊕⊝⊝⊝ |
| Length of hospital stay (selenium) | The mean length of hospital stay ranged across control groups from | The mean length of hospital stay ranged across intervention groups from | MD ‐3.33. 95% CI ‐5.22 to ‐1.44 | 693 | ⊕⊝⊝⊝ |
| GRADE Working Group grades of evidence | |||||
| Abbreviations: CI: confidence interval; RR: risk ratio; MD: mean difference; ICU: intensive care unit. | |||||
| Trial | Selenium | Control |
| 22.8 days (20.8) | 26.5 days (22) | |
| 15.1 days (10) | 12.7 days (9) | |
| 7,5 days (3.5) | 9 days (7.1) | |
| 22.3 days (9.6) | 17 days (8.7) | |
| 14 days (11) | 13days (6) | |
| 21.3 days (16.2) | 20.8 days (21.8) | |
| 14.5 days (4.6) | 16.7 days (5.9) | |
| MD 0.54 (95% CI ‐2.27 to 3.34, I² statistic = 72%, random‐effects model) | ||
| All findings given as mean (SD). If the original figures were provided in median (range) or interquartile range, we converted them to mean (SD) (Hozo 2005). | ||
| Trial | Selenium | Control |
| 11 days (5.9) | 16 (12.6) | |
| 6 days (2.9) | 6 days (5.7) | |
| 19.8 days (7.8) | 14.8 days (4.4) | |
| 9.3 days (1.5) | 12 days (1.8) | |
| MD ‐0.86 (95% CI ‐4.39 to 2.67, I² statistic = 89%, random‐effects model) | ||
| All findings given as mean (SD). If the original figures were provided in median (range), we converted them to mean (SD) (Hozo 2005). | ||
| Trial | Selenium | Control |
| 38.5 days (24.4) | 39.5 days (15.7) | |
| 83 days (73.5) | 62.8 days (30.2) | |
| 31.3 days (18) | 32 days (11.6) | |
| 12.5 days (0.6) | 17 days (1.7) | |
| 31.7 days (10.9) | 33.8 days (12.4) | |
| MD ‐3.33 (95% CI ‐5.22 to ‐1.44, I² statistic = 42%, random‐effects model) | ||
| All findings given as mean (SD). If the original figures were provided in median (range) or interquartile range, we converted them to mean (SD) (Hozo 2005). | ||
| Outcome or subgroup title | No. of studies | No. of participants | Statistical method | Effect size |
| 1 Overall mortality (regardless of the period of follow‐up) Show forest plot | 16 | 2084 | Risk Ratio (M‐H, Fixed, 95% CI) | 0.82 [0.72, 0.93] |
| 1.1 Overall mortality (Selenium) | 13 | 1391 | Risk Ratio (M‐H, Fixed, 95% CI) | 0.82 [0.72, 0.93] |
| 1.2 Overall mortality (Ebselen) | 3 | 693 | Risk Ratio (M‐H, Fixed, 95% CI) | 0.83 [0.52, 1.34] |
| Outcome or subgroup title | No. of studies | No. of participants | Statistical method | Effect size |
| 1 Mortality by duration (Selenium) Show forest plot | 11 | Risk Ratio (M‐H, Random, 95% CI) | Subtotals only | |
| 1.1 Selenium 28 day | 9 | 1180 | Risk Ratio (M‐H, Random, 95% CI) | 0.84 [0.69, 1.02] |
| 1.2 Selenium 90 day | 3 | 614 | Risk Ratio (M‐H, Random, 95% CI) | 0.96 [0.78, 1.18] |
| 2 Mortality by duration (Ebselen) Show forest plot | 3 | Risk Ratio (M‐H, Random, 95% CI) | Subtotals only | |
| 2.1 Ebselen 30 day | 1 | 105 | Risk Ratio (M‐H, Random, 95% CI) | 1.78 [0.53, 5.95] |
| 2.2 Ebselen 3 month | 2 | 588 | Risk Ratio (M‐H, Random, 95% CI) | 0.72 [0.42, 1.22] |
| 3 Mortality: ICU and pancreatitis (Selenium) Show forest plot | 11 | 1255 | Risk Ratio (M‐H, Random, 95% CI) | 0.87 [0.74, 1.02] |
| 3.1 General intensive care patients | 9 | 1168 | Risk Ratio (M‐H, Random, 95% CI) | 0.88 [0.77, 1.01] |
| 3.2 Acute pancreatitis | 2 | 87 | Risk Ratio (M‐H, Random, 95% CI) | 0.40 [0.01, 12.30] |
| Outcome or subgroup title | No. of studies | No. of participants | Statistical method | Effect size |
| 1 Number of infected participants Show forest plot | 9 | Risk Ratio (M‐H, Random, 95% CI) | Subtotals only | |
| 1.1 Selenium | 6 | 934 | Risk Ratio (M‐H, Random, 95% CI) | 0.96 [0.75, 1.23] |
| 1.2 Ebselen | 3 | 685 | Risk Ratio (M‐H, Random, 95% CI) | 0.60 [0.36, 1.02] |
| Outcome or subgroup title | No. of studies | No. of participants | Statistical method | Effect size |
| 1 Number of participants with adverse event Show forest plot | 8 | Risk Ratio (M‐H, Random, 95% CI) | Subtotals only | |
| 1.1 Selenium | 6 | 925 | Risk Ratio (M‐H, Random, 95% CI) | 1.03 [0.85, 1.24] |
| 1.2 Ebselen | 2 | 588 | Risk Ratio (M‐H, Random, 95% CI) | 1.16 [0.40, 3.36] |
| 2 Length of stay in ICU (Selenium) Show forest plot | 7 | 934 | Mean Difference (IV, Random, 95% CI) | 0.54 [‐2.27, 3.34] |
| 3 Number of days on a ventilator (Selenium) Show forest plot | 4 | 191 | Mean Difference (IV, Random, 95% CI) | ‐0.86 [‐4.39, 2.67] |
| 4 Length of hospital stay (Selenium) Show forest plot | 5 | 693 | Mean Difference (IV, Random, 95% CI) | ‐3.33 [‐5.22, ‐1.44] |