Ventilación con volumen dirigido versus ventilación con presión limitada en los recién nacidos
Información
- DOI:
- https://doi.org/10.1002/14651858.CD003666.pub4Copiar DOI

- Base de datos:
-
- Cochrane Database of Systematic Reviews
- Versión publicada:
-
- 17 octubre 2017see what's new
- Tipo:
-
- Intervention
- Etapa:
-
- Review
- Grupo Editorial Cochrane:
-
Grupo Cochrane de Neonatología
- Copyright:
-
- Copyright © 2017 The Cochrane Collaboration. Published by John Wiley & Sons, Ltd.
Cifras del artículo
Altmetric:
Citado por:
Autores
Contributions of authors
NMC: wrote the protocol with assistance from CJM and PGD.
For the 2005 review, NMC wrote the review with assistance from PGD and CJM.
For the 2010 update, KIW and CK performed the search, assessed articles, liaised with study authors regarding supplemental information, extracted and analysed data. PGD supervised the research. CJM and NMC assisted with reviewing the manuscript.
For the 2017 update, KIW and CK performed the search, assessed articles, liaised with study authors regarding supplemental information, extracted and analysed data. CK and KIW wrote the review. PGD, CJM and NMC assisted with reviewing the manuscript.
Sources of support
Internal sources
-
Royal Women's Hospital Foundation, Melbourne, Australia.
-
Murdoch Children's Research Institute, Melbourne, Australia.
External sources
-
No sources of support supplied
Declarations of interest
CJM: has acted as a consultant to Drager Medical and Acutronic Medical Instruments, both manufacturers of neonatal ventilators. The companies had no involvement with the funding, design or conduct of this review.
CK: None
KIW: None
PGD: None
NMC: None
Acknowledgements
KI Wheeler was supported in part by a Monash International Postgraduate Research Scholarship. PG Davis was supported in part by an Australian National Health and Medical Research Council Practitioner Fellowship. The project was supported by Australian National Health and Medical Research Council Program Grant No. 384100.
We acknowledge the assistance of Roberto Chiletti and Hania Czerwinska who freely gave their time to assist with translating articles published in Italian and Polish.
The Cochrane Neonatal Review Group has been funded in part with Federal funds from the Eunice Kennedy Shriver National Institute of Child Health and Human Development National Institutes of Health, Department of Health and Human Services, USA, under Contract No. HHSN267200603418C.
Version history
| Published | Title | Stage | Authors | Version |
| 2017 Oct 17 | Volume‐targeted versus pressure‐limited ventilation in neonates | Review | Claus Klingenberg, Kevin I Wheeler, Naomi McCallion, Colin J Morley, Peter G Davis | |
| 2010 Nov 10 | Volume‐targeted versus pressure‐limited ventilation in the neonate | Review | Kevin Wheeler, Claus Klingenberg, Naomi McCallion, Colin J Morley, Peter G Davis | |
| 2005 Jul 20 | Volume‐targeted versus pressure‐limited ventilation in the neonate | Review | Naomi McCallion, Peter G Davis, Colin J Morley | |
| 2002 Apr 22 | Volume‐targeted versus pressure‐limited ventilation in the neonate | Protocol | Naomi McCallion, Peter G Davis, Colin J Morley | |
Differences between protocol and review
The original protocol limited PLV to time‐cycled modes. In view of development of modern PLV modes that may be flow cycled (e.g. PSV mode with the Draeger Babylog Plus ventilator), we have chosen to include all trials comparing VTV with PLV, independent of PLV being provided in a time‐cycled or flow‐cycled manner.
The following subgroup analysis was performed, which was not specified in the initial protocol.
-
Subgroup analysis for strict versus hybrid trial designs, within Analyses 1 and 2 where applicable.
The following outcomes included above were not included in the original protocol for this review.
-
Analysis 3.1 Severe disability (arbitrary).
-
Analysis 3.2 Severe disability (arbitrary definition) or death.
-
Analysis 3.3 Gross motor developmental issue (arbitrary definition).
-
Analysis 3.4 Steroids for BPD.
-
Analysis 3.5 Need for home oxygen (survivors).
-
Analysis 3.6 Need for home oxygen (survivors weighing less than 1000 g).
We also added the methodology and plan for 'Summary of findings' tables and GRADE recommendations, which were not included in the original protocol or previous versions of the review.
Keywords
MeSH
Medical Subject Headings (MeSH) Keywords
Medical Subject Headings Check Words
Humans; Infant, Newborn;
PICO

Study flow diagram: review update. PLV: pressure‐limited ventilation; VTV: volume‐targeted ventilation.

Risk of bias graph: review authors' judgements about each risk of bias item presented as percentages across all included studies.

Risk of bias summary: review authors' judgements about each risk of bias item for each included study.

Comparison 1 Volume‐targeted ventilation (VTV) versus pressure‐limited ventilation (PLV) ‐ subgroup by mode of ventilation, Outcome 1 Death before discharge from hospital.
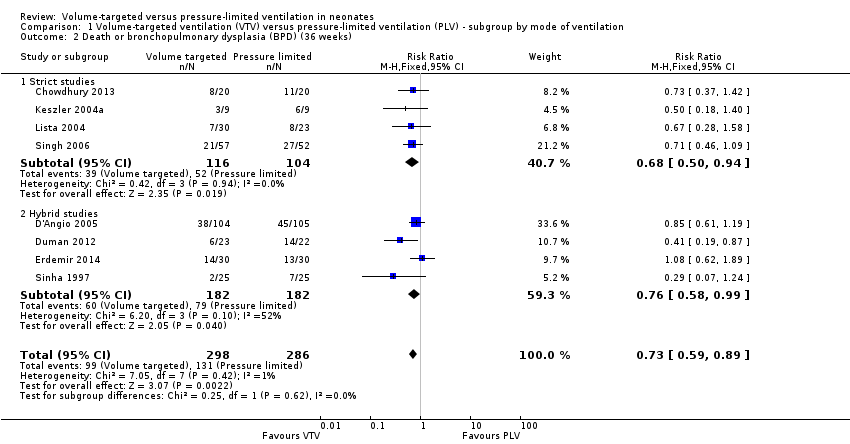
Comparison 1 Volume‐targeted ventilation (VTV) versus pressure‐limited ventilation (PLV) ‐ subgroup by mode of ventilation, Outcome 2 Death or bronchopulmonary dysplasia (BPD) (36 weeks).
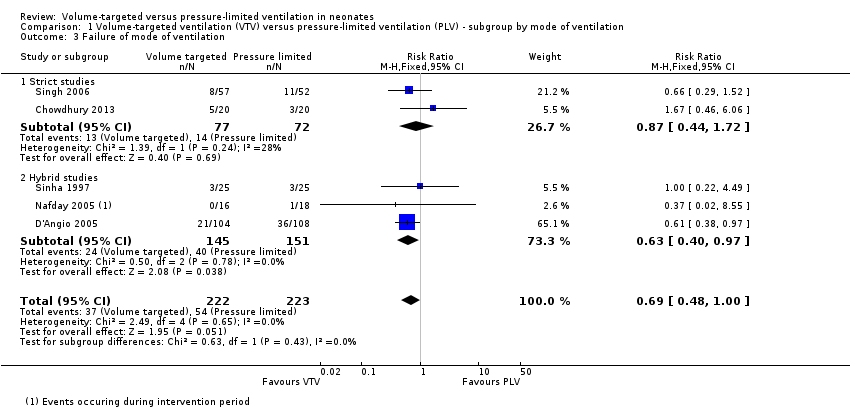
Comparison 1 Volume‐targeted ventilation (VTV) versus pressure‐limited ventilation (PLV) ‐ subgroup by mode of ventilation, Outcome 3 Failure of mode of ventilation.

Comparison 1 Volume‐targeted ventilation (VTV) versus pressure‐limited ventilation (PLV) ‐ subgroup by mode of ventilation, Outcome 4 Addition of neuromuscular paralysis where previously not paralysed.
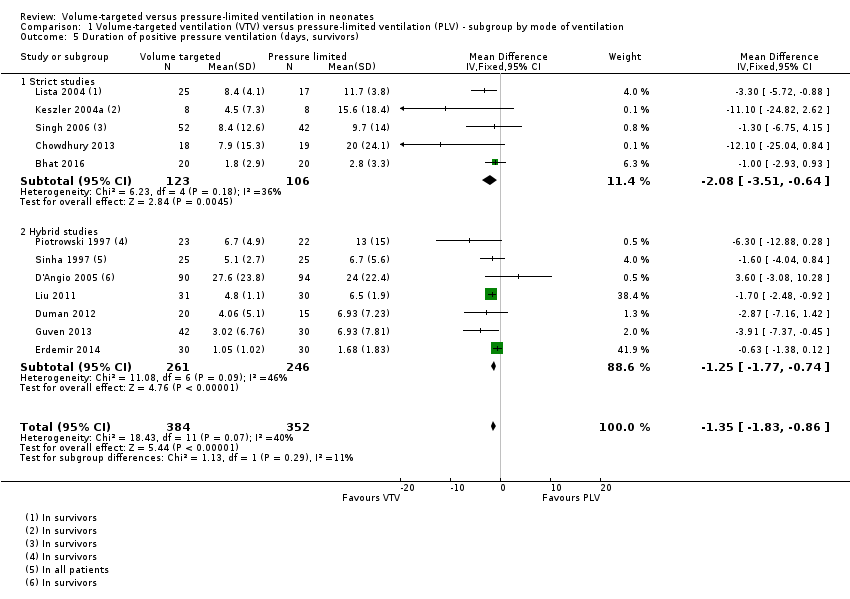
Comparison 1 Volume‐targeted ventilation (VTV) versus pressure‐limited ventilation (PLV) ‐ subgroup by mode of ventilation, Outcome 5 Duration of positive pressure ventilation (days, survivors).

Comparison 1 Volume‐targeted ventilation (VTV) versus pressure‐limited ventilation (PLV) ‐ subgroup by mode of ventilation, Outcome 6 Duration of positive pressure ventilation (log data, survivors).
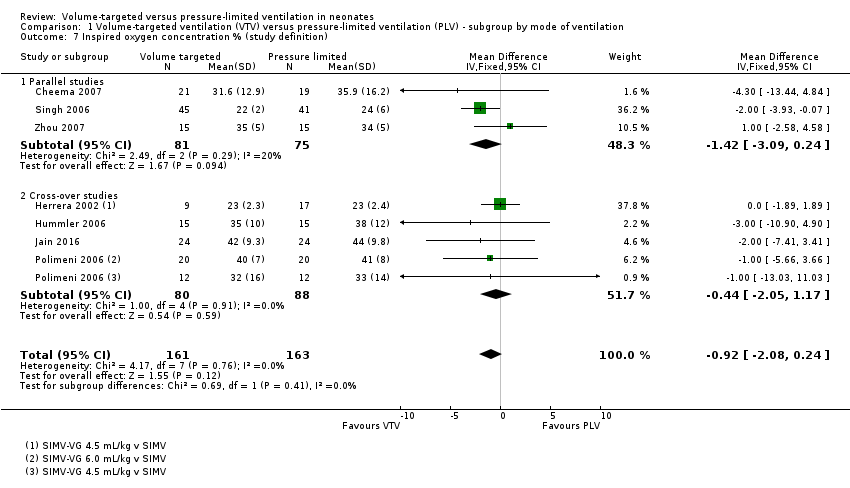
Comparison 1 Volume‐targeted ventilation (VTV) versus pressure‐limited ventilation (PLV) ‐ subgroup by mode of ventilation, Outcome 7 Inspired oxygen concentration % (study definition).
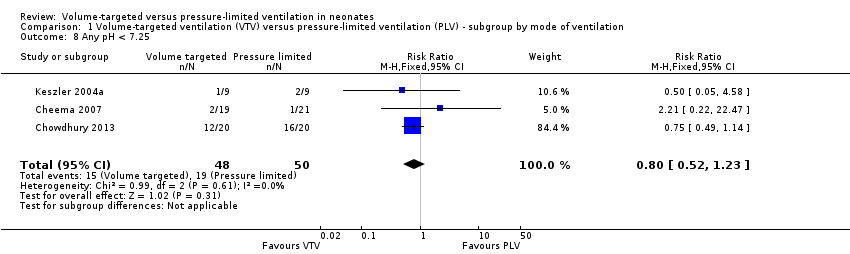
Comparison 1 Volume‐targeted ventilation (VTV) versus pressure‐limited ventilation (PLV) ‐ subgroup by mode of ventilation, Outcome 8 Any pH < 7.25.
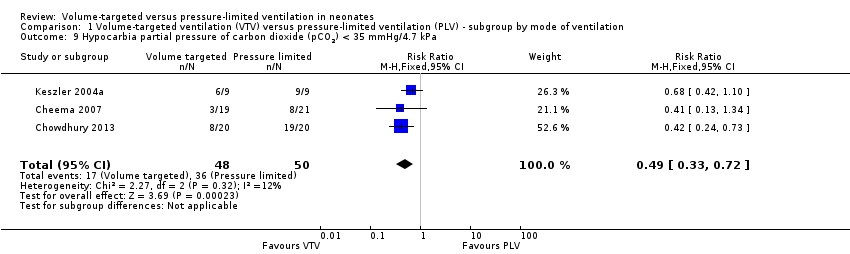
Comparison 1 Volume‐targeted ventilation (VTV) versus pressure‐limited ventilation (PLV) ‐ subgroup by mode of ventilation, Outcome 9 Hypocarbia partial pressure of carbon dioxide (pCO2) < 35 mmHg/4.7 kPa.

Comparison 1 Volume‐targeted ventilation (VTV) versus pressure‐limited ventilation (PLV) ‐ subgroup by mode of ventilation, Outcome 10 Respiratory acidosis; pH < 7.25 and pCO2 > 8 kPa.

Comparison 1 Volume‐targeted ventilation (VTV) versus pressure‐limited ventilation (PLV) ‐ subgroup by mode of ventilation, Outcome 11 Incidence of hypocarbia or respiratory acidosis.
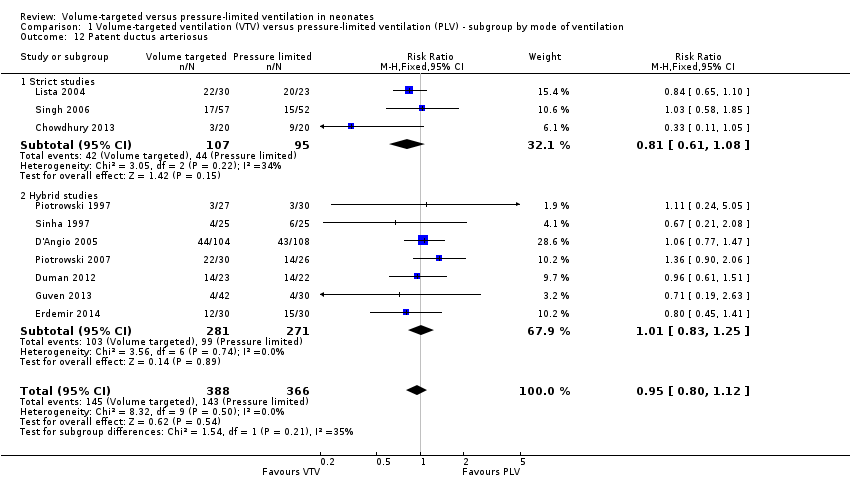
Comparison 1 Volume‐targeted ventilation (VTV) versus pressure‐limited ventilation (PLV) ‐ subgroup by mode of ventilation, Outcome 12 Patent ductus arteriosus.

Comparison 1 Volume‐targeted ventilation (VTV) versus pressure‐limited ventilation (PLV) ‐ subgroup by mode of ventilation, Outcome 13 Air leak (any).
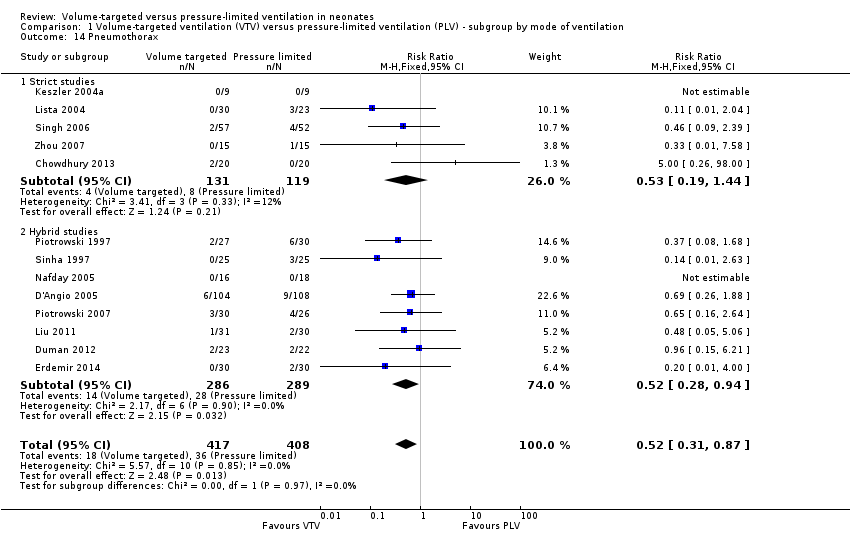
Comparison 1 Volume‐targeted ventilation (VTV) versus pressure‐limited ventilation (PLV) ‐ subgroup by mode of ventilation, Outcome 14 Pneumothorax.
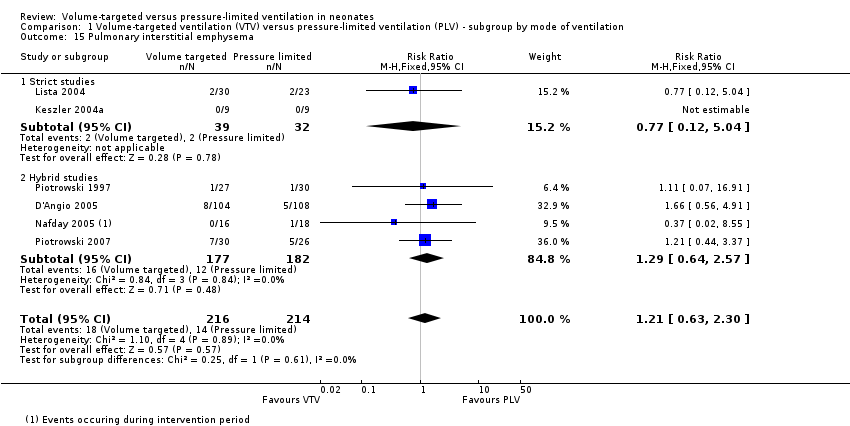
Comparison 1 Volume‐targeted ventilation (VTV) versus pressure‐limited ventilation (PLV) ‐ subgroup by mode of ventilation, Outcome 15 Pulmonary interstitial emphysema.

Comparison 1 Volume‐targeted ventilation (VTV) versus pressure‐limited ventilation (PLV) ‐ subgroup by mode of ventilation, Outcome 16 Any intraventricular haemorrhage (IVH).

Comparison 1 Volume‐targeted ventilation (VTV) versus pressure‐limited ventilation (PLV) ‐ subgroup by mode of ventilation, Outcome 17 Periventricular leukomalacia (PVL).

Comparison 1 Volume‐targeted ventilation (VTV) versus pressure‐limited ventilation (PLV) ‐ subgroup by mode of ventilation, Outcome 18 IVH grade 3‐4.

Comparison 1 Volume‐targeted ventilation (VTV) versus pressure‐limited ventilation (PLV) ‐ subgroup by mode of ventilation, Outcome 19 Any IVH or PVL.

Comparison 1 Volume‐targeted ventilation (VTV) versus pressure‐limited ventilation (PLV) ‐ subgroup by mode of ventilation, Outcome 20 IVH grade 3‐4 or PVL.

Comparison 1 Volume‐targeted ventilation (VTV) versus pressure‐limited ventilation (PLV) ‐ subgroup by mode of ventilation, Outcome 21 BPD (supplemental oxygen in survivors at 36 weeks only).

Comparison 2 Volume‐targeted ventilation (VTV) versus pressure‐limited ventilation (PLV) ‐ infants weighing less than 1000 g, Outcome 1 Death in hospital.

Comparison 2 Volume‐targeted ventilation (VTV) versus pressure‐limited ventilation (PLV) ‐ infants weighing less than 1000 g, Outcome 2 Death or bronchopulmonary dysplasia (BPD) (36 weeks).

Comparison 2 Volume‐targeted ventilation (VTV) versus pressure‐limited ventilation (PLV) ‐ infants weighing less than 1000 g, Outcome 3 Duration of positive pressure ventilation (days, survivors).

Comparison 2 Volume‐targeted ventilation (VTV) versus pressure‐limited ventilation (PLV) ‐ infants weighing less than 1000 g, Outcome 4 Duration of positive pressure ventilation (log data, survivors).

Comparison 2 Volume‐targeted ventilation (VTV) versus pressure‐limited ventilation (PLV) ‐ infants weighing less than 1000 g, Outcome 5 Any pH < 7.25.

Comparison 2 Volume‐targeted ventilation (VTV) versus pressure‐limited ventilation (PLV) ‐ infants weighing less than 1000 g, Outcome 6 Hypocarbia partial pressure of carbon dioxide (pCO2) < 35 mmHg/4.7 kPa.

Comparison 2 Volume‐targeted ventilation (VTV) versus pressure‐limited ventilation (PLV) ‐ infants weighing less than 1000 g, Outcome 7 Respiratory acidosis pH < 7.25 and pCO2 > 60 mmHg/8 kPa.

Comparison 2 Volume‐targeted ventilation (VTV) versus pressure‐limited ventilation (PLV) ‐ infants weighing less than 1000 g, Outcome 8 Hypocarbia or respiratory acidosis.

Comparison 2 Volume‐targeted ventilation (VTV) versus pressure‐limited ventilation (PLV) ‐ infants weighing less than 1000 g, Outcome 9 Patent ductus arteriosus.

Comparison 2 Volume‐targeted ventilation (VTV) versus pressure‐limited ventilation (PLV) ‐ infants weighing less than 1000 g, Outcome 10 Air leak (any).
Comparison 2 Volume‐targeted ventilation (VTV) versus pressure‐limited ventilation (PLV) ‐ infants weighing less than 1000 g, Outcome 11 Pneumothorax.

Comparison 2 Volume‐targeted ventilation (VTV) versus pressure‐limited ventilation (PLV) ‐ infants weighing less than 1000 g, Outcome 12 Pulmonary interstitial emphysema.

Comparison 2 Volume‐targeted ventilation (VTV) versus pressure‐limited ventilation (PLV) ‐ infants weighing less than 1000 g, Outcome 13 Any intraventricular haemorrhage (IVH).
Comparison 2 Volume‐targeted ventilation (VTV) versus pressure‐limited ventilation (PLV) ‐ infants weighing less than 1000 g, Outcome 14 IVH grade 3‐4.

Comparison 2 Volume‐targeted ventilation (VTV) versus pressure‐limited ventilation (PLV) ‐ infants weighing less than 1000 g, Outcome 15 Periventricular leukomalacia (PVL).

Comparison 2 Volume‐targeted ventilation (VTV) versus pressure‐limited ventilation (PLV) ‐ infants weighing less than 1000 g, Outcome 16 Any IVH or PVL.

Comparison 2 Volume‐targeted ventilation (VTV) versus pressure‐limited ventilation (PLV) ‐ infants weighing less than 1000 g, Outcome 17 IVH grade 3‐4 or PVL.
Comparison 2 Volume‐targeted ventilation (VTV) versus pressure‐limited ventilation (PLV) ‐ infants weighing less than 1000 g, Outcome 18 BPD (supplemental oxygen in survivors at 36 weeks).

Comparison 3 Miscellaneous post hoc analyses, Outcome 1 Severe disability (any definition).

Comparison 3 Miscellaneous post hoc analyses, Outcome 2 Severe disability (any definition) or death.
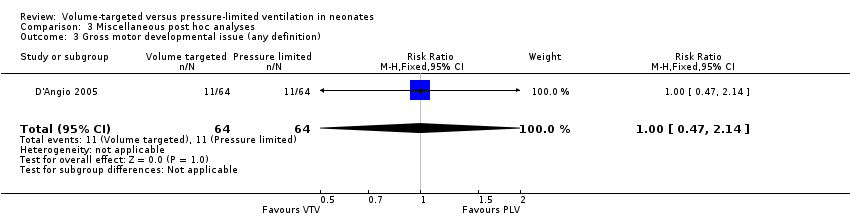
Comparison 3 Miscellaneous post hoc analyses, Outcome 3 Gross motor developmental issue (any definition).

Comparison 3 Miscellaneous post hoc analyses, Outcome 4 Steroids for bronchopulmonary dysplasia.

Comparison 3 Miscellaneous post hoc analyses, Outcome 5 Need for home oxygen (survivors).
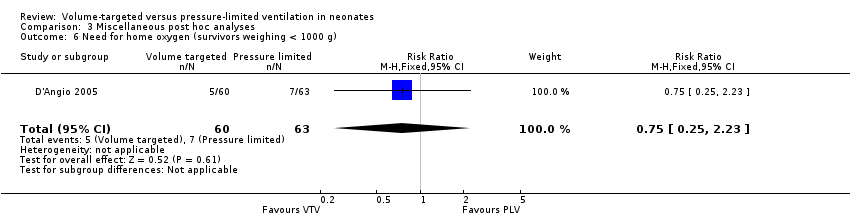
Comparison 3 Miscellaneous post hoc analyses, Outcome 6 Need for home oxygen (survivors weighing < 1000 g).
| Volume‐targeted ventilation compared to pressure‐limited ventilation | ||||||
| Patient or population: neonates up to 44 weeks' postmenstrual age | ||||||
| Outcomes | Anticipated absolute effects* (95% CI) | Relative effect | No of participants | Quality of the evidence | Comments | |
| Risk with PLV | Risk with VTV | |||||
| Death before discharge from hospital | Study population | RR 0.75 | 771 | ⊕⊕⊝⊝ | Unblinded studies. Imprecision of estimates. 95% CI < 0.75. | |
| 163 per 1000 | 122 per 1000 | |||||
| Death or BPD (36 weeks) | Study population | RR 0.73 | 584 | ⊕⊕⊕⊝ | Unblinded studies. | |
| 458 per 1000 | 334 per 1000 | |||||
| Duration of positive pressure ventilation (days) | MD of positive pressure ventilation (days); PLV group 0 | MD 1.35 lower | ‐ | 736 | ⊕⊕⊕⊝ | Unblinded studies. |
| Pneumothorax | Study population | RR 0.52 (0.31 to 0.87) | 825 | ⊕⊕⊕⊝ | Unblinded studies. | |
| 88 per 1000 | 46 per 1000 (27 to 77) | |||||
| IVH grade 3‐4 | Study population | RR 0.53 (0.37 to 0.77) | 712 (10 RCTs) | ⊕⊕⊕⊝ | Unblinded studies. | |
| 184 per 1000 | 97 per 1000 (68 to 141) | |||||
| IVH grade 3‐4 or PVL | Study population | RR 0.47 (0.27 to 0.80) | 441 | ⊕⊕⊕⊝ | Unblinded studies. | |
| 164 per 1000 | 77 per 1000 (44 to 131) | |||||
| BPD (supplemental oxygen at 36 weeks) | Study population | RR 0.68 (0.53 to 0.87) | 620 | ⊕⊕⊝⊝ | Unblinded studies. Possible publication bias based on funnel plot. | |
| 346 per 1000 | 235 per 1000 (183 to 301) | |||||
| *The risk in the intervention group (and its 95% confidence interval) is based on the assumed risk in the comparison group and the relative effect of the intervention (and its 95% CI). BPD: bronchopulmonary dysplasia; CI: confidence interval; IVH: intraventricular haemorrhage; MD: mean difference; PLV: pressure‐limited ventilation; PVL: periventricular leukomalacia; RCT: randomised controlled trial; RR: risk ratio; VTV: volume‐targeted ventilation. | ||||||
| GRADE Working Group grades of evidence | ||||||
| Volume‐targeted ventilation compared to pressure‐limited ventilation | ||||||
| Patient or population: neonates up to 44 weeks' postmenstrual age | ||||||
| Outcomes | Anticipated absolute effects* (95% CI) | Relative effect | No of participants | Quality of the evidence | Comments | |
| Risk with PLV | Risk with VTV | |||||
| Death or BPD (28 days) | Study population | RR 0.87 (0.64 to 1.18) | 149 | ⊕⊕⊝⊝ | Unblinded studies. Imprecision of estimates, 95% CI < 0.75. Few participants. | |
| 536 per 1000 | 467 per 1000 (343 to 633) | |||||
| Failure of mode of ventilation | Study population | RR 0.69 | 445 | ⊕⊕⊕⊝ | Unblinded studies. | |
| 242 per 1000 | 167 per 1000 | |||||
| Addition of neuromuscular paralysis where previously not paralysed | Study population | RR 0.32 | 75 | ⊕⊕⊝⊝ | Unblinded studies. Small numbers of participants. | |
| 179 per 1000 | 57 per 1000 | |||||
| Duration of positive pressure ventilation (log data) | The mean duration of IPPV (log data) was 0 | MD 0.08 lower | ‐ | 381 | ⊕⊕⊝⊝ | Unblinded studies. Heterogeneity of study results. |
| Inspired oxygen concentration % (study definition) | The mean difference in inspired oxygen concentration %; PLV group 0 | The mean inspired oxygen concentration % was 0.92 lower (2.08 lower to 0.24 higher) in VTV group | ‐ | 324 | ⊕⊕⊕⊝ | Unblinded studies. |
| Any pH < 7.25 | Study population | RR 0.80 | 98 | ⊕⊕⊝⊝ | Unblinded studies. Imprecision of estimates, 95% CI < 0.75. Few participants. | |
| 380 per 1000 | 304 per 1000 | |||||
| Hypocarbia pCO2 < 35 mmHg/4.7 kPa | Study population | RR 0.49 (0.33 to 0.72) | 98 | ⊕⊕⊕⊝ | Unblinded studies. Small trials, but large effect and biologically plausible. | |
| 720 per 1000 | 353 per 1000 (238 to 518) | |||||
| Respiratory acidosis pH < 7.25 and pCO2 > 60 mmHg/8 kPa | Study population | RR 0.93 | 98 | ⊕⊕⊝⊝ | Unblinded studies. Imprecision of estimates, 95% CI < 0.75. Few participants. | |
| 240 per 1000 | 223 per 1000 | |||||
| Either hypocarbia or respiratory acidosis | Study population | RR 0.68 | 37 | ‐ | No quality assessment possible. | |
| 1889 per 1000 | 1000 per 1000 | |||||
| Patent ductus arteriosus | Study population | RR 0.95 | 754 | ⊕⊕⊝⊝ | Unblinded studies. Variable diagnostic practices employed. | |
| 391 per 1000 | 371 per 1000 | |||||
| Air leak (any) | Study population | RR 0.79 | 374 | ⊕⊕⊝⊝ | Unblinded studies. Imprecision of estimates, 95% CI < 0.75. Few participants. | |
| 117 per 1000 | 92 per 1000 | |||||
| Pulmonary interstitial emphysema | Study population | RR 1.21 | 430 | ⊕⊕⊝⊝ | Unblinded studies. Imprecision of estimates, 95% CI < 0.75. | |
| 65 per 1000 | 79 per 1000 | |||||
| Any IVH | Study population | RR 0.82 | 445 | ⊕⊕⊝⊝ | Unblinded studies. Imprecision of estimates, 95% CI < 0.75. | |
| 342 per 1000 | 281 per 1000 | |||||
| PVL | Study population | OR 0.43 (0.19 to 0.98) | 508 | ⊕⊕⊕⊝ | Unblinded studies. | |
| 71 per 1000 | 32 per 1000 (14 to 69) | |||||
| Any IVH or PVL | Study population | RR 0.83 | 298 | ⊕⊕⊕⊝ | Unblinded studies. | |
| 308 per 1000 | 256 per 1000 | |||||
| BPD (supplemental oxygen at 28 days) | Study population | RR 0.91 | 206 | ⊕⊕⊝⊝ | Unblinded studies. Imprecision of estimates, 95% CI < 0.75. | |
| 354 per 1000 | 322 per 1000 | |||||
| *The risk in the intervention group (and its 95% confidence interval) is based on the assumed risk in the comparison group and the relative effect of the intervention (and its 95% CI). BPD: bronchopulmonary dysplasia; CI: confidence interval; IPPV: intermittent positive pressure ventilation; IVH: intraventricular haemorrhage; MD: mean difference; pCO2: partial pressure of carbon dioxide; PLV: pressure‐limited ventilation; PVL: periventricular leukomalacia; RCT: randomised controlled trial; RR: risk ratio; VTV: volume‐targeted ventilation. | ||||||
| GRADE Working Group grades of evidence | ||||||
| Outcome or subgroup title | No. of studies | No. of participants | Statistical method | Effect size |
| 1 Death before discharge from hospital Show forest plot | 11 | 771 | Risk Ratio (M‐H, Fixed, 95% CI) | 0.75 [0.53, 1.07] |
| 1.1 Strict studies | 4 | 220 | Risk Ratio (M‐H, Fixed, 95% CI) | 0.60 [0.31, 1.15] |
| 1.2 Hybrid studies | 7 | 551 | Risk Ratio (M‐H, Fixed, 95% CI) | 0.83 [0.55, 1.25] |
| 2 Death or bronchopulmonary dysplasia (BPD) (36 weeks) Show forest plot | 8 | 584 | Risk Ratio (M‐H, Fixed, 95% CI) | 0.73 [0.59, 0.89] |
| 2.1 Strict studies | 4 | 220 | Risk Ratio (M‐H, Fixed, 95% CI) | 0.68 [0.50, 0.94] |
| 2.2 Hybrid studies | 4 | 364 | Risk Ratio (M‐H, Fixed, 95% CI) | 0.76 [0.58, 0.99] |
| 3 Failure of mode of ventilation Show forest plot | 5 | 445 | Risk Ratio (M‐H, Fixed, 95% CI) | 0.69 [0.48, 1.00] |
| 3.1 Strict studies | 2 | 149 | Risk Ratio (M‐H, Fixed, 95% CI) | 0.87 [0.44, 1.72] |
| 3.2 Hybrid studies | 3 | 296 | Risk Ratio (M‐H, Fixed, 95% CI) | 0.63 [0.40, 0.97] |
| 4 Addition of neuromuscular paralysis where previously not paralysed Show forest plot | 2 | 75 | Risk Ratio (M‐H, Fixed, 95% CI) | 0.32 [0.07, 1.40] |
| 4.1 Strict studies | 1 | 18 | Risk Ratio (M‐H, Fixed, 95% CI) | 0.0 [0.0, 0.0] |
| 4.2 Hybrid studies | 1 | 57 | Risk Ratio (M‐H, Fixed, 95% CI) | 0.32 [0.07, 1.40] |
| 5 Duration of positive pressure ventilation (days, survivors) Show forest plot | 12 | 736 | Mean Difference (IV, Fixed, 95% CI) | ‐1.35 [‐1.83, ‐0.86] |
| 5.1 Strict studies | 5 | 229 | Mean Difference (IV, Fixed, 95% CI) | ‐2.08 [‐3.51, ‐0.64] |
| 5.2 Hybrid studies | 7 | 507 | Mean Difference (IV, Fixed, 95% CI) | ‐1.25 [‐1.77, ‐0.74] |
| 6 Duration of positive pressure ventilation (log data, survivors) Show forest plot | 5 | 381 | Mean Difference (IV, Fixed, 95% CI) | ‐0.08 [‐0.16, ‐0.00] |
| 6.1 Strict studies | 3 | 152 | Mean Difference (IV, Fixed, 95% CI) | ‐0.14 [‐0.24, ‐0.04] |
| 6.2 Hybrid studies | 2 | 229 | Mean Difference (IV, Fixed, 95% CI) | 0.02 [‐0.12, 0.15] |
| 7 Inspired oxygen concentration % (study definition) Show forest plot | 7 | 324 | Mean Difference (IV, Fixed, 95% CI) | ‐0.92 [‐2.08, 0.24] |
| 7.1 Parallel studies | 3 | 156 | Mean Difference (IV, Fixed, 95% CI) | ‐1.42 [‐3.09, 0.24] |
| 7.2 Cross‐over studies | 4 | 168 | Mean Difference (IV, Fixed, 95% CI) | ‐0.44 [‐2.05, 1.17] |
| 8 Any pH < 7.25 Show forest plot | 3 | 98 | Risk Ratio (M‐H, Fixed, 95% CI) | 0.80 [0.52, 1.23] |
| 9 Hypocarbia partial pressure of carbon dioxide (pCO2) < 35 mmHg/4.7 kPa Show forest plot | 3 | 98 | Risk Ratio (M‐H, Fixed, 95% CI) | 0.49 [0.33, 0.72] |
| 10 Respiratory acidosis; pH < 7.25 and pCO2 > 8 kPa Show forest plot | 3 | 98 | Risk Ratio (M‐H, Fixed, 95% CI) | 0.93 [0.51, 1.70] |
| 11 Incidence of hypocarbia or respiratory acidosis Show forest plot | 2 | 58 | Risk Ratio (M‐H, Fixed, 95% CI) | 0.69 [0.42, 1.12] |
| 12 Patent ductus arteriosus Show forest plot | 10 | 754 | Risk Ratio (M‐H, Fixed, 95% CI) | 0.95 [0.80, 1.12] |
| 12.1 Strict studies | 3 | 202 | Risk Ratio (M‐H, Fixed, 95% CI) | 0.81 [0.61, 1.08] |
| 12.2 Hybrid studies | 7 | 552 | Risk Ratio (M‐H, Fixed, 95% CI) | 1.01 [0.83, 1.25] |
| 13 Air leak (any) Show forest plot | 5 | 374 | Risk Ratio (M‐H, Fixed, 95% CI) | 0.79 [0.44, 1.43] |
| 13.1 Strict studies | 2 | 71 | Risk Ratio (M‐H, Fixed, 95% CI) | 0.51 [0.09, 2.81] |
| 13.2 Hybrid Studies | 3 | 303 | Risk Ratio (M‐H, Fixed, 95% CI) | 0.84 [0.45, 1.58] |
| 14 Pneumothorax Show forest plot | 13 | 825 | Risk Ratio (M‐H, Fixed, 95% CI) | 0.52 [0.31, 0.87] |
| 14.1 Strict studies | 5 | 250 | Risk Ratio (M‐H, Fixed, 95% CI) | 0.53 [0.19, 1.44] |
| 14.2 Hybrid studies | 8 | 575 | Risk Ratio (M‐H, Fixed, 95% CI) | 0.52 [0.28, 0.94] |
| 15 Pulmonary interstitial emphysema Show forest plot | 6 | 430 | Risk Ratio (M‐H, Fixed, 95% CI) | 1.21 [0.63, 2.30] |
| 15.1 Strict studies | 2 | 71 | Risk Ratio (M‐H, Fixed, 95% CI) | 0.77 [0.12, 5.04] |
| 15.2 Hybrid studies | 4 | 359 | Risk Ratio (M‐H, Fixed, 95% CI) | 1.29 [0.64, 2.57] |
| 16 Any intraventricular haemorrhage (IVH) Show forest plot | 6 | 501 | Risk Ratio (M‐H, Fixed, 95% CI) | 0.90 [0.70, 1.15] |
| 16.1 Strict studies | 2 | 125 | Risk Ratio (M‐H, Fixed, 95% CI) | 1.11 [0.74, 1.67] |
| 16.2 Hybrid studies | 4 | 376 | Risk Ratio (M‐H, Fixed, 95% CI) | 0.82 [0.60, 1.11] |
| 17 Periventricular leukomalacia (PVL) Show forest plot | 7 | 508 | Risk Ratio (M‐H, Fixed, 95% CI) | 0.45 [0.21, 0.98] |
| 17.1 Strict studies | 4 | 218 | Risk Ratio (M‐H, Fixed, 95% CI) | 0.53 [0.17, 1.65] |
| 17.2 Hybrid studies | 3 | 290 | Risk Ratio (M‐H, Fixed, 95% CI) | 0.40 [0.14, 1.14] |
| 18 IVH grade 3‐4 Show forest plot | 10 | 712 | Risk Difference (M‐H, Fixed, 95% CI) | ‐0.09 [‐0.14, ‐0.04] |
| 18.1 Strict studies | 4 | 218 | Risk Difference (M‐H, Fixed, 95% CI) | ‐0.05 [‐0.13, 0.02] |
| 18.2 Hybrid studies | 6 | 494 | Risk Difference (M‐H, Fixed, 95% CI) | ‐0.10 [‐0.17, ‐0.04] |
| 19 Any IVH or PVL Show forest plot | 3 | 298 | Risk Ratio (M‐H, Fixed, 95% CI) | 0.83 [0.58, 1.18] |
| 19.1 Strict studies | 2 | 125 | Risk Ratio (M‐H, Fixed, 95% CI) | 0.83 [0.52, 1.35] |
| 19.2 Hybrid studies | 1 | 173 | Risk Ratio (M‐H, Fixed, 95% CI) | 0.82 [0.48, 1.39] |
| 20 IVH grade 3‐4 or PVL Show forest plot | 6 | 441 | Risk Ratio (M‐H, Fixed, 95% CI) | 0.47 [0.27, 0.80] |
| 20.1 Strict studies | 4 | 218 | Risk Ratio (M‐H, Fixed, 95% CI) | 0.51 [0.25, 1.03] |
| 20.2 Hybrid studies | 2 | 223 | Risk Ratio (M‐H, Fixed, 95% CI) | 0.42 [0.19, 0.96] |
| 21 BPD (supplemental oxygen in survivors at 36 weeks only) Show forest plot | 9 | 620 | Risk Ratio (M‐H, Fixed, 95% CI) | 0.68 [0.53, 0.87] |
| 21.1 Strict studies | 4 | 218 | Risk Ratio (M‐H, Fixed, 95% CI) | 0.75 [0.52, 1.07] |
| 21.2 Hybrid studies | 5 | 402 | Risk Ratio (M‐H, Fixed, 95% CI) | 0.64 [0.46, 0.89] |
| Outcome or subgroup title | No. of studies | No. of participants | Statistical method | Effect size |
| 1 Death in hospital Show forest plot | 5 | 246 | Risk Ratio (M‐H, Fixed, 95% CI) | 0.71 [0.42, 1.21] |
| 1.1 Strict studies | 4 | 226 | Risk Ratio (M‐H, Fixed, 95% CI) | 0.80 [0.46, 1.39] |
| 1.2 Hybrid studies | 1 | 20 | Risk Ratio (M‐H, Fixed, 95% CI) | 0.25 [0.03, 1.86] |
| 2 Death or bronchopulmonary dysplasia (BPD) (36 weeks) Show forest plot | 4 | 224 | Risk Ratio (M‐H, Fixed, 95% CI) | 0.79 [0.62, 1.01] |
| 2.1 Strict studies | 3 | 81 | Risk Ratio (M‐H, Fixed, 95% CI) | 0.75 [0.52, 1.10] |
| 2.2 Hybrid studies | 1 | 143 | Risk Ratio (M‐H, Fixed, 95% CI) | 0.82 [0.59, 1.12] |
| 3 Duration of positive pressure ventilation (days, survivors) Show forest plot | 5 | 198 | Mean Difference (IV, Fixed, 95% CI) | ‐0.82 [‐4.43, 2.80] |
| 3.1 Strict studies | 3 | 63 | Mean Difference (IV, Fixed, 95% CI) | ‐0.32 [‐4.53, 3.89] |
| 3.2 Hybrid studies | 2 | 135 | Mean Difference (IV, Fixed, 95% CI) | ‐2.21 [‐9.29, 4.87] |
| 4 Duration of positive pressure ventilation (log data, survivors) Show forest plot | 5 | 198 | Mean Difference (IV, Fixed, 95% CI) | ‐0.01 [‐0.12, 0.10] |
| 4.1 Strict studies | 3 | 63 | Mean Difference (IV, Fixed, 95% CI) | ‐0.04 [‐0.23, 0.14] |
| 4.2 Hybrid studies | 2 | 135 | Mean Difference (IV, Fixed, 95% CI) | 0.01 [‐0.12, 0.14] |
| 5 Any pH < 7.25 Show forest plot | 2 | 46 | Risk Ratio (M‐H, Fixed, 95% CI) | 0.71 [0.46, 1.09] |
| 6 Hypocarbia partial pressure of carbon dioxide (pCO2) < 35 mmHg/4.7 kPa Show forest plot | 1 | 6 | Risk Ratio (M‐H, Fixed, 95% CI) | 0.19 [0.01, 2.36] |
| 7 Respiratory acidosis pH < 7.25 and pCO2 > 60 mmHg/8 kPa Show forest plot | 2 | 46 | Risk Ratio (M‐H, Fixed, 95% CI) | 0.79 [0.43, 1.47] |
| 8 Hypocarbia or respiratory acidosis Show forest plot | 1 | 6 | Risk Ratio (M‐H, Fixed, 95% CI) | 0.19 [0.01, 2.36] |
| 9 Patent ductus arteriosus Show forest plot | 4 | 241 | Risk Ratio (M‐H, Fixed, 95% CI) | 1.09 [0.85, 1.39] |
| 9.1 Strict studies | 2 | 75 | Risk Ratio (M‐H, Fixed, 95% CI) | 1.10 [0.77, 1.57] |
| 9.2 Hybrid studies | 2 | 166 | Risk Ratio (M‐H, Fixed, 95% CI) | 1.08 [0.78, 1.50] |
| 10 Air leak (any) Show forest plot | 4 | 189 | Risk Ratio (M‐H, Fixed, 95% CI) | 1.11 [0.55, 2.23] |
| 10.1 Strict studies | 2 | 23 | Risk Ratio (M‐H, Fixed, 95% CI) | 0.83 [0.10, 7.24] |
| 10.2 Hybrid studies | 2 | 166 | Risk Ratio (M‐H, Fixed, 95% CI) | 1.14 [0.54, 2.40] |
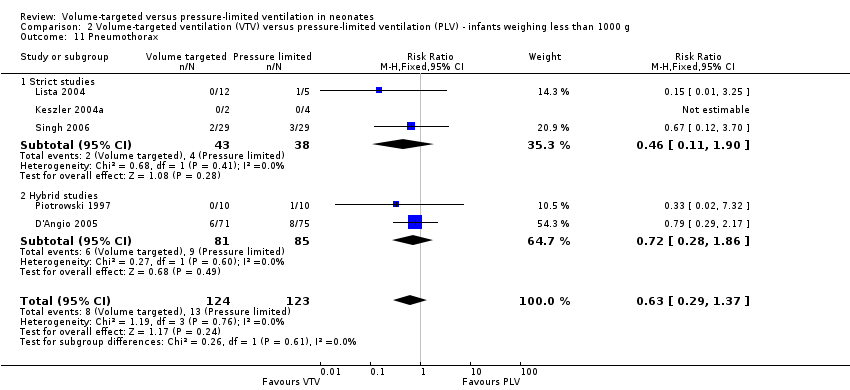
| 11 Pneumothorax Show forest plot | 5 | 247 | Risk Ratio (M‐H, Fixed, 95% CI) | 0.63 [0.29, 1.37] |
| 11.1 Strict studies | 3 | 81 | Risk Ratio (M‐H, Fixed, 95% CI) | 0.46 [0.11, 1.90] |
| 11.2 Hybrid studies | 2 | 166 | Risk Ratio (M‐H, Fixed, 95% CI) | 0.72 [0.28, 1.86] |
| 12 Pulmonary interstitial emphysema Show forest plot | 4 | 189 | Risk Ratio (M‐H, Fixed, 95% CI) | 1.45 [0.58, 3.67] |
| 12.1 Strict studies | 2 | 23 | Risk Ratio (M‐H, Fixed, 95% CI) | 0.83 [0.10, 7.24] |
| 12.2 Hybrid studies | 2 | 166 | Risk Ratio (M‐H, Fixed, 95% CI) | 1.62 [0.58, 4.53] |
| 13 Any intraventricular haemorrhage (IVH) Show forest plot | 4 | 225 | Risk Ratio (M‐H, Fixed, 95% CI) | 0.79 [0.55, 1.16] |
| 13.1 Strict studies | 2 | 62 | Risk Ratio (M‐H, Fixed, 95% CI) | 1.14 [0.62, 2.08] |
| 13.2 Hybrid studies | 2 | 163 | Risk Ratio (M‐H, Fixed, 95% CI) | 0.66 [0.40, 1.06] |
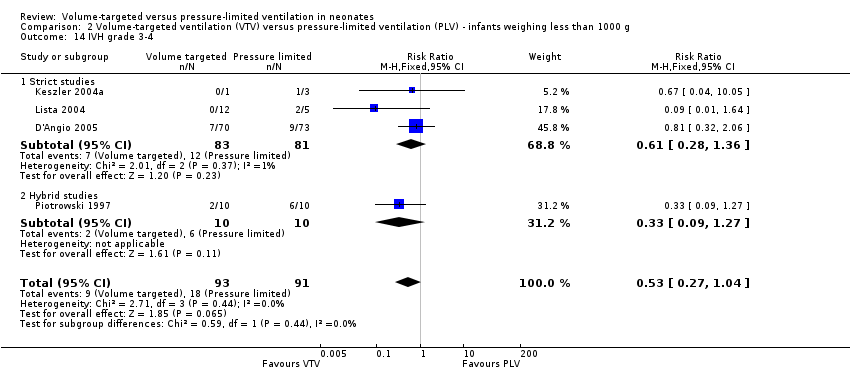
| 14 IVH grade 3‐4 Show forest plot | 4 | 184 | Risk Ratio (M‐H, Fixed, 95% CI) | 0.53 [0.27, 1.04] |
| 14.1 Strict studies | 3 | 164 | Risk Ratio (M‐H, Fixed, 95% CI) | 0.61 [0.28, 1.36] |
| 14.2 Hybrid studies | 1 | 20 | Risk Ratio (M‐H, Fixed, 95% CI) | 0.33 [0.09, 1.27] |
| 15 Periventricular leukomalacia (PVL) Show forest plot | 4 | 203 | Risk Ratio (M‐H, Fixed, 95% CI) | 0.43 [0.15, 1.24] |
| 15.1 Strict studies | 3 | 79 | Risk Ratio (M‐H, Fixed, 95% CI) | 0.38 [0.10, 1.53] |
| 15.2 Hybrid studies | 1 | 124 | Risk Ratio (M‐H, Fixed, 95% CI) | 0.5 [0.10, 2.63] |
| 16 Any IVH or PVL Show forest plot | 3 | 186 | Risk Ratio (M‐H, Fixed, 95% CI) | 0.90 [0.60, 1.35] |
| 16.1 Strict studies | 2 | 62 | Risk Ratio (M‐H, Fixed, 95% CI) | 1.05 [0.61, 1.80] |
| 16.2 Hybrid studies | 1 | 124 | Risk Ratio (M‐H, Fixed, 95% CI) | 0.78 [0.43, 1.42] |
| 17 IVH grade 3‐4 or PVL Show forest plot | 3 | 145 | Odds Ratio (M‐H, Fixed, 95% CI) | 0.39 [0.15, 0.99] |
| 17.1 Strict studies | 2 | 21 | Odds Ratio (M‐H, Fixed, 95% CI) | 0.10 [0.01, 1.04] |
| 17.2 Hybrid studies | 1 | 124 | Odds Ratio (M‐H, Fixed, 95% CI) | 0.56 [0.19, 1.64] |
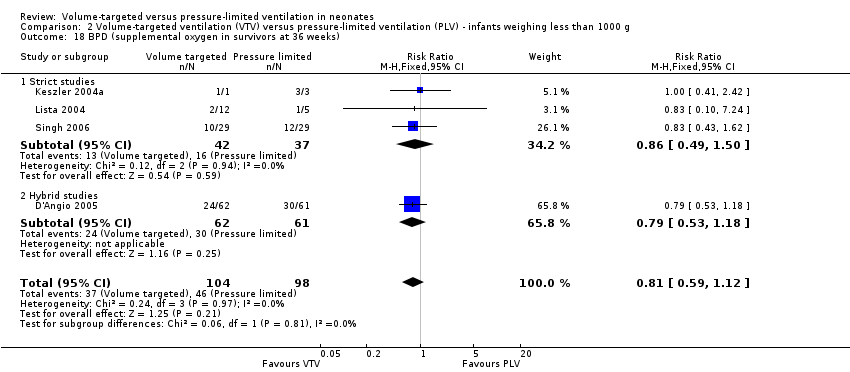
| 18 BPD (supplemental oxygen in survivors at 36 weeks) Show forest plot | 4 | 202 | Risk Ratio (M‐H, Fixed, 95% CI) | 0.81 [0.59, 1.12] |
| 18.1 Strict studies | 3 | 79 | Risk Ratio (M‐H, Fixed, 95% CI) | 0.86 [0.49, 1.50] |
| 18.2 Hybrid studies | 1 | 123 | Risk Ratio (M‐H, Fixed, 95% CI) | 0.79 [0.53, 1.18] |
| Outcome or subgroup title | No. of studies | No. of participants | Statistical method | Effect size |
| 1 Severe disability (any definition) Show forest plot | 2 | 209 | Risk Ratio (M‐H, Fixed, 95% CI) | 0.86 [0.47, 1.59] |
| 2 Severe disability (any definition) or death Show forest plot | 1 | 109 | Risk Ratio (M‐H, Fixed, 95% CI) | 0.54 [0.27, 1.06] |
| 3 Gross motor developmental issue (any definition) Show forest plot | 1 | 128 | Risk Ratio (M‐H, Fixed, 95% CI) | 1.0 [0.47, 2.14] |
| 4 Steroids for bronchopulmonary dysplasia Show forest plot | 1 | 203 | Risk Ratio (M‐H, Fixed, 95% CI) | 0.93 [0.65, 1.31] |
| 5 Need for home oxygen (survivors) Show forest plot | 2 | 270 | Risk Ratio (M‐H, Fixed, 95% CI) | 0.64 [0.30, 1.36] |
| 6 Need for home oxygen (survivors weighing < 1000 g) Show forest plot | 1 | 123 | Risk Ratio (M‐H, Fixed, 95% CI) | 0.75 [0.25, 2.23] |