| 1 Death before discharge from hospital Show forest plot | 11 | 771 | Risk Ratio (M‐H, Fixed, 95% CI) | 0.75 [0.53, 1.07] |
|
| 1.1 Strict studies | 4 | 220 | Risk Ratio (M‐H, Fixed, 95% CI) | 0.60 [0.31, 1.15] |
| 1.2 Hybrid studies | 7 | 551 | Risk Ratio (M‐H, Fixed, 95% CI) | 0.83 [0.55, 1.25] |
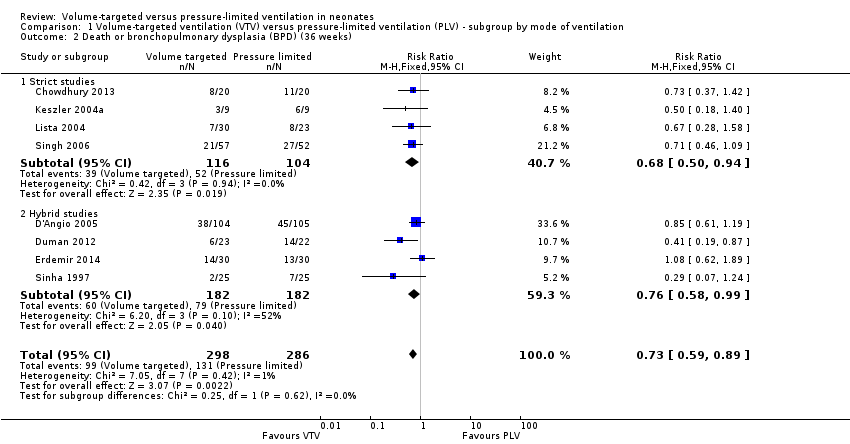
| 2 Death or bronchopulmonary dysplasia (BPD) (36 weeks) Show forest plot | 8 | 584 | Risk Ratio (M‐H, Fixed, 95% CI) | 0.73 [0.59, 0.89] |
|
| 2.1 Strict studies | 4 | 220 | Risk Ratio (M‐H, Fixed, 95% CI) | 0.68 [0.50, 0.94] |
| 2.2 Hybrid studies | 4 | 364 | Risk Ratio (M‐H, Fixed, 95% CI) | 0.76 [0.58, 0.99] |
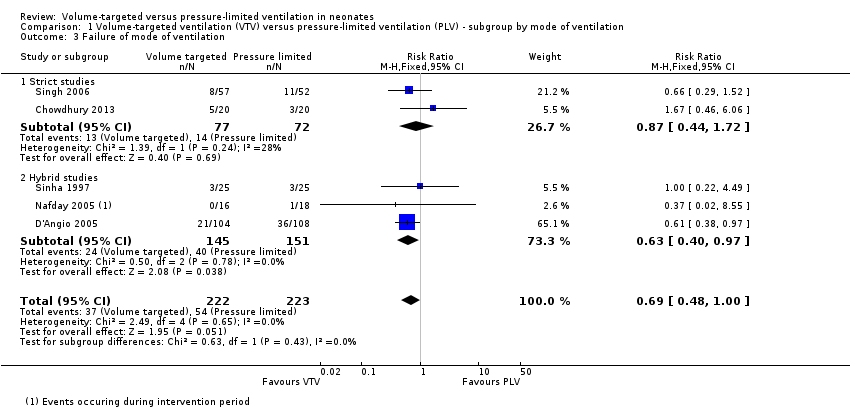
| 3 Failure of mode of ventilation Show forest plot | 5 | 445 | Risk Ratio (M‐H, Fixed, 95% CI) | 0.69 [0.48, 1.00] |
|
| 3.1 Strict studies | 2 | 149 | Risk Ratio (M‐H, Fixed, 95% CI) | 0.87 [0.44, 1.72] |
| 3.2 Hybrid studies | 3 | 296 | Risk Ratio (M‐H, Fixed, 95% CI) | 0.63 [0.40, 0.97] |
| 4 Addition of neuromuscular paralysis where previously not paralysed Show forest plot | 2 | 75 | Risk Ratio (M‐H, Fixed, 95% CI) | 0.32 [0.07, 1.40] |
|
| 4.1 Strict studies | 1 | 18 | Risk Ratio (M‐H, Fixed, 95% CI) | 0.0 [0.0, 0.0] |
| 4.2 Hybrid studies | 1 | 57 | Risk Ratio (M‐H, Fixed, 95% CI) | 0.32 [0.07, 1.40] |
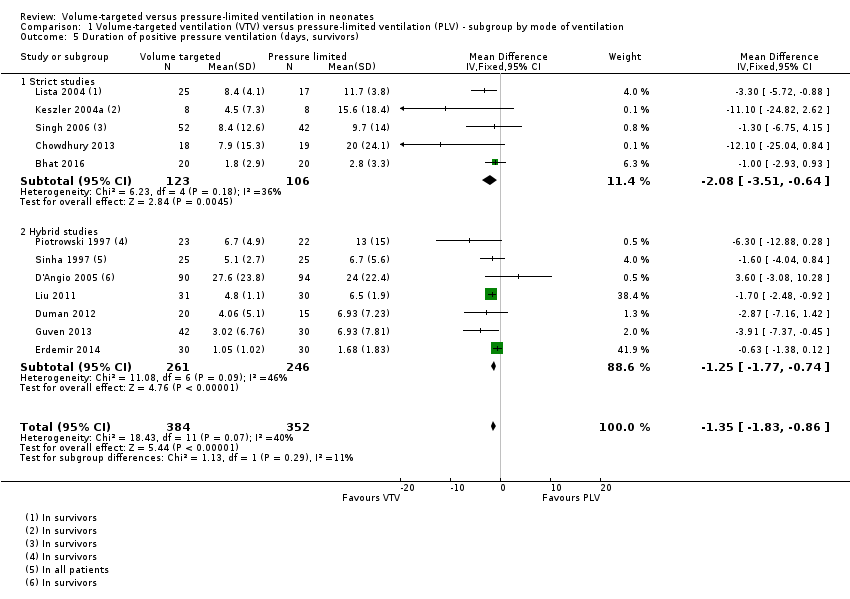
| 5 Duration of positive pressure ventilation (days, survivors) Show forest plot | 12 | 736 | Mean Difference (IV, Fixed, 95% CI) | ‐1.35 [‐1.83, ‐0.86] |
|
| 5.1 Strict studies | 5 | 229 | Mean Difference (IV, Fixed, 95% CI) | ‐2.08 [‐3.51, ‐0.64] |
| 5.2 Hybrid studies | 7 | 507 | Mean Difference (IV, Fixed, 95% CI) | ‐1.25 [‐1.77, ‐0.74] |
| 6 Duration of positive pressure ventilation (log data, survivors) Show forest plot | 5 | 381 | Mean Difference (IV, Fixed, 95% CI) | ‐0.08 [‐0.16, ‐0.00] |
|
| 6.1 Strict studies | 3 | 152 | Mean Difference (IV, Fixed, 95% CI) | ‐0.14 [‐0.24, ‐0.04] |
| 6.2 Hybrid studies | 2 | 229 | Mean Difference (IV, Fixed, 95% CI) | 0.02 [‐0.12, 0.15] |
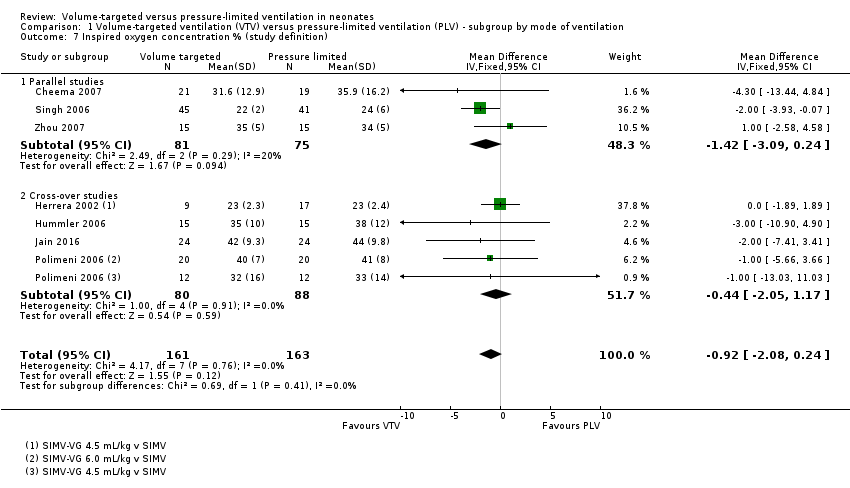
| 7 Inspired oxygen concentration % (study definition) Show forest plot | 7 | 324 | Mean Difference (IV, Fixed, 95% CI) | ‐0.92 [‐2.08, 0.24] |
|
| 7.1 Parallel studies | 3 | 156 | Mean Difference (IV, Fixed, 95% CI) | ‐1.42 [‐3.09, 0.24] |
| 7.2 Cross‐over studies | 4 | 168 | Mean Difference (IV, Fixed, 95% CI) | ‐0.44 [‐2.05, 1.17] |
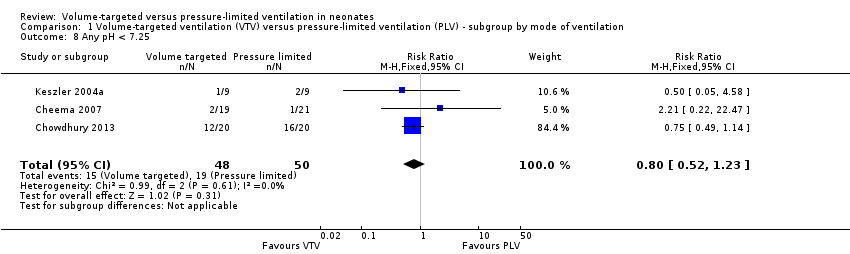
| 8 Any pH < 7.25 Show forest plot | 3 | 98 | Risk Ratio (M‐H, Fixed, 95% CI) | 0.80 [0.52, 1.23] |
|
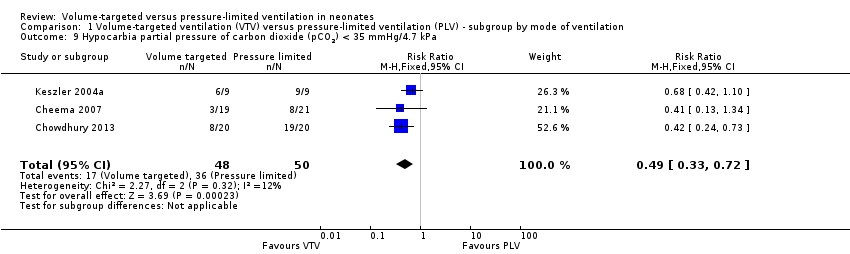
| 9 Hypocarbia partial pressure of carbon dioxide (pCO2) < 35 mmHg/4.7 kPa Show forest plot | 3 | 98 | Risk Ratio (M‐H, Fixed, 95% CI) | 0.49 [0.33, 0.72] |
|
| 10 Respiratory acidosis; pH < 7.25 and pCO2 > 8 kPa Show forest plot | 3 | 98 | Risk Ratio (M‐H, Fixed, 95% CI) | 0.93 [0.51, 1.70] |
|
| 11 Incidence of hypocarbia or respiratory acidosis Show forest plot | 2 | 58 | Risk Ratio (M‐H, Fixed, 95% CI) | 0.69 [0.42, 1.12] |
|
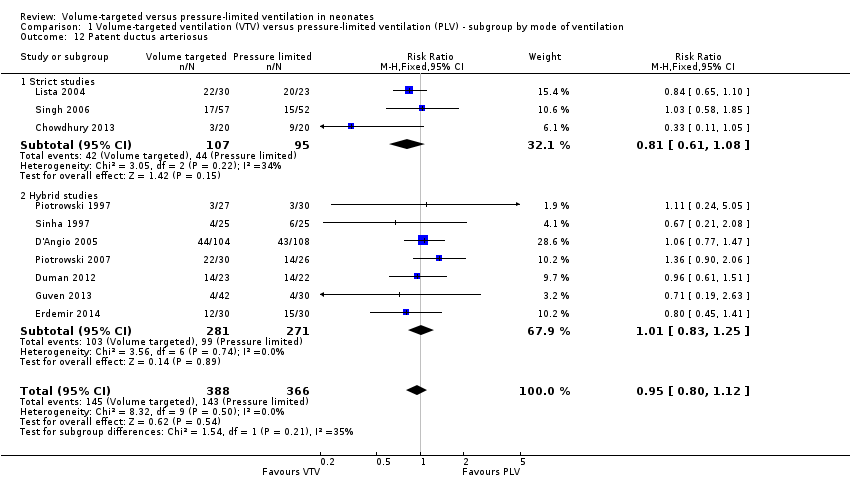
| 12 Patent ductus arteriosus Show forest plot | 10 | 754 | Risk Ratio (M‐H, Fixed, 95% CI) | 0.95 [0.80, 1.12] |
|
| 12.1 Strict studies | 3 | 202 | Risk Ratio (M‐H, Fixed, 95% CI) | 0.81 [0.61, 1.08] |
| 12.2 Hybrid studies | 7 | 552 | Risk Ratio (M‐H, Fixed, 95% CI) | 1.01 [0.83, 1.25] |
| 13 Air leak (any) Show forest plot | 5 | 374 | Risk Ratio (M‐H, Fixed, 95% CI) | 0.79 [0.44, 1.43] |
|
| 13.1 Strict studies | 2 | 71 | Risk Ratio (M‐H, Fixed, 95% CI) | 0.51 [0.09, 2.81] |
| 13.2 Hybrid Studies | 3 | 303 | Risk Ratio (M‐H, Fixed, 95% CI) | 0.84 [0.45, 1.58] |
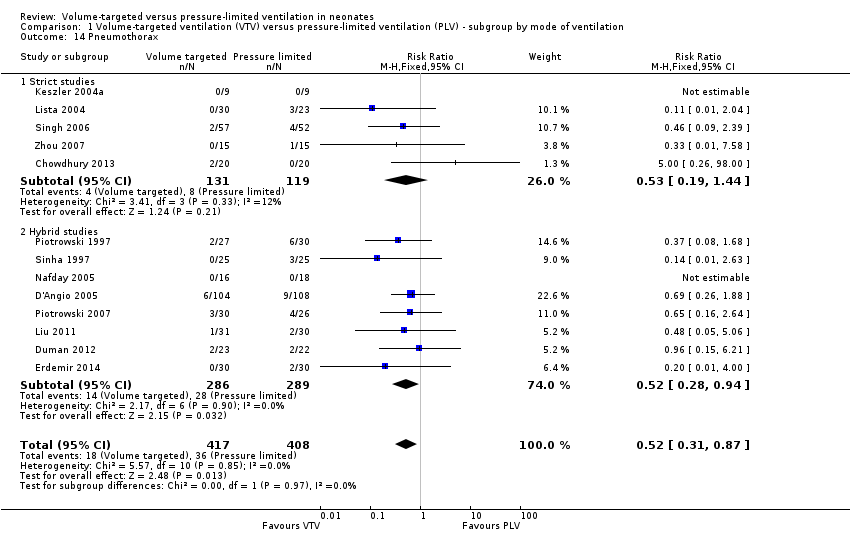
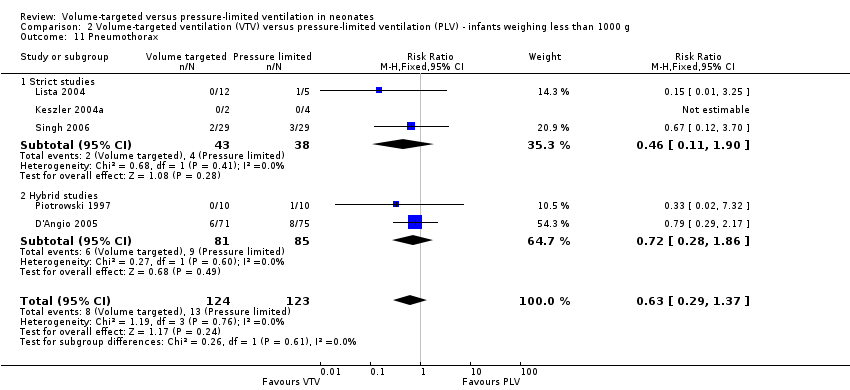
| 14 Pneumothorax Show forest plot | 13 | 825 | Risk Ratio (M‐H, Fixed, 95% CI) | 0.52 [0.31, 0.87] |
|
| 14.1 Strict studies | 5 | 250 | Risk Ratio (M‐H, Fixed, 95% CI) | 0.53 [0.19, 1.44] |
| 14.2 Hybrid studies | 8 | 575 | Risk Ratio (M‐H, Fixed, 95% CI) | 0.52 [0.28, 0.94] |
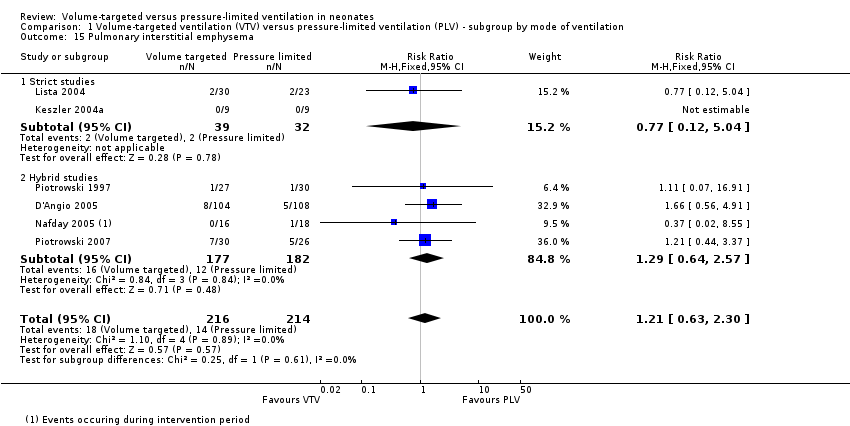
| 15 Pulmonary interstitial emphysema Show forest plot | 6 | 430 | Risk Ratio (M‐H, Fixed, 95% CI) | 1.21 [0.63, 2.30] |
|
| 15.1 Strict studies | 2 | 71 | Risk Ratio (M‐H, Fixed, 95% CI) | 0.77 [0.12, 5.04] |
| 15.2 Hybrid studies | 4 | 359 | Risk Ratio (M‐H, Fixed, 95% CI) | 1.29 [0.64, 2.57] |
| 16 Any intraventricular haemorrhage (IVH) Show forest plot | 6 | 501 | Risk Ratio (M‐H, Fixed, 95% CI) | 0.90 [0.70, 1.15] |
|
| 16.1 Strict studies | 2 | 125 | Risk Ratio (M‐H, Fixed, 95% CI) | 1.11 [0.74, 1.67] |
| 16.2 Hybrid studies | 4 | 376 | Risk Ratio (M‐H, Fixed, 95% CI) | 0.82 [0.60, 1.11] |
| 17 Periventricular leukomalacia (PVL) Show forest plot | 7 | 508 | Risk Ratio (M‐H, Fixed, 95% CI) | 0.45 [0.21, 0.98] |
|
| 17.1 Strict studies | 4 | 218 | Risk Ratio (M‐H, Fixed, 95% CI) | 0.53 [0.17, 1.65] |
| 17.2 Hybrid studies | 3 | 290 | Risk Ratio (M‐H, Fixed, 95% CI) | 0.40 [0.14, 1.14] |
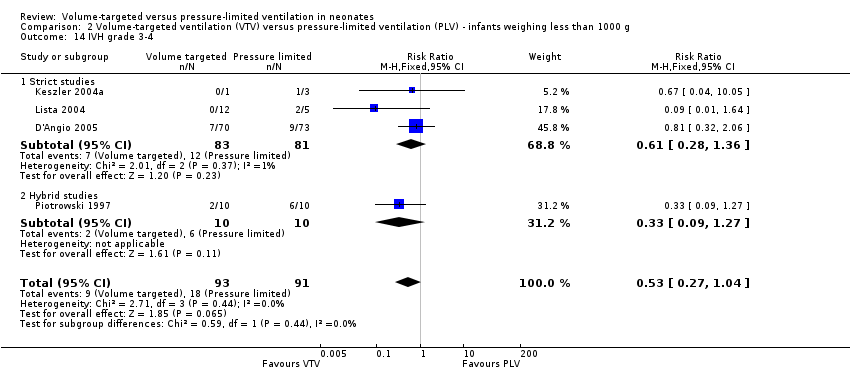
| 18 IVH grade 3‐4 Show forest plot | 10 | 712 | Risk Difference (M‐H, Fixed, 95% CI) | ‐0.09 [‐0.14, ‐0.04] |
|
| 18.1 Strict studies | 4 | 218 | Risk Difference (M‐H, Fixed, 95% CI) | ‐0.05 [‐0.13, 0.02] |
| 18.2 Hybrid studies | 6 | 494 | Risk Difference (M‐H, Fixed, 95% CI) | ‐0.10 [‐0.17, ‐0.04] |
| 19 Any IVH or PVL Show forest plot | 3 | 298 | Risk Ratio (M‐H, Fixed, 95% CI) | 0.83 [0.58, 1.18] |
|
| 19.1 Strict studies | 2 | 125 | Risk Ratio (M‐H, Fixed, 95% CI) | 0.83 [0.52, 1.35] |
| 19.2 Hybrid studies | 1 | 173 | Risk Ratio (M‐H, Fixed, 95% CI) | 0.82 [0.48, 1.39] |
| 20 IVH grade 3‐4 or PVL Show forest plot | 6 | 441 | Risk Ratio (M‐H, Fixed, 95% CI) | 0.47 [0.27, 0.80] |
|
| 20.1 Strict studies | 4 | 218 | Risk Ratio (M‐H, Fixed, 95% CI) | 0.51 [0.25, 1.03] |
| 20.2 Hybrid studies | 2 | 223 | Risk Ratio (M‐H, Fixed, 95% CI) | 0.42 [0.19, 0.96] |
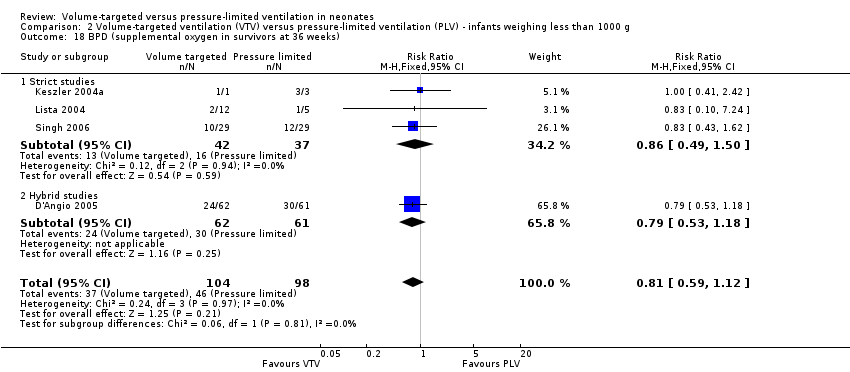
| 21 BPD (supplemental oxygen in survivors at 36 weeks only) Show forest plot | 9 | 620 | Risk Ratio (M‐H, Fixed, 95% CI) | 0.68 [0.53, 0.87] |
|
| 21.1 Strict studies | 4 | 218 | Risk Ratio (M‐H, Fixed, 95% CI) | 0.75 [0.52, 1.07] |
| 21.2 Hybrid studies | 5 | 402 | Risk Ratio (M‐H, Fixed, 95% CI) | 0.64 [0.46, 0.89] |