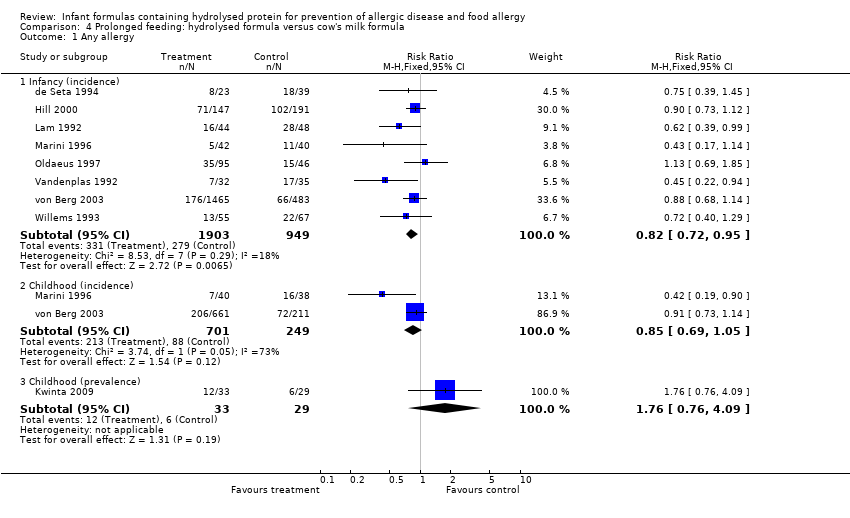
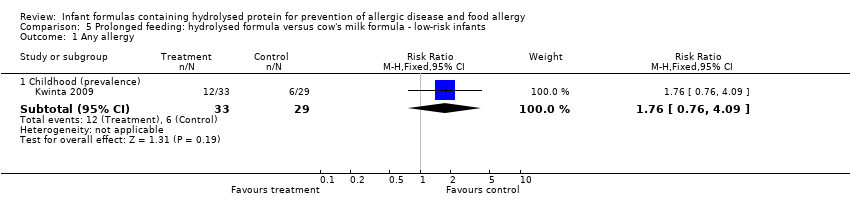
| 1 Any allergy Show forest plot | 8 | | Risk Ratio (M‐H, Fixed, 95% CI) | Subtotals only |
|
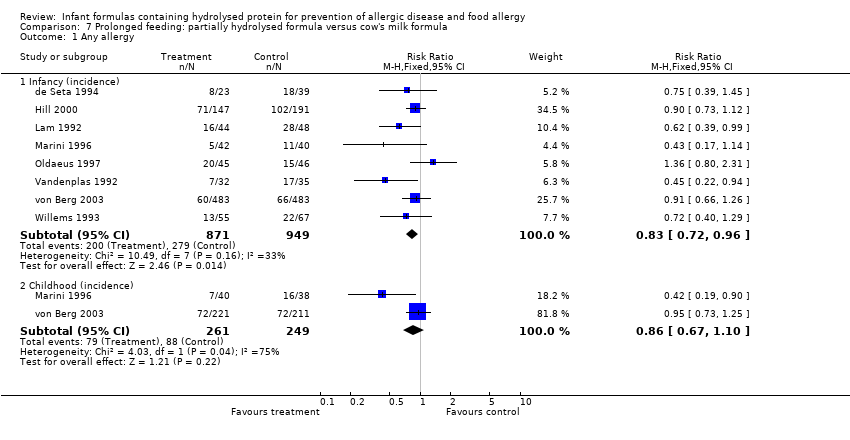
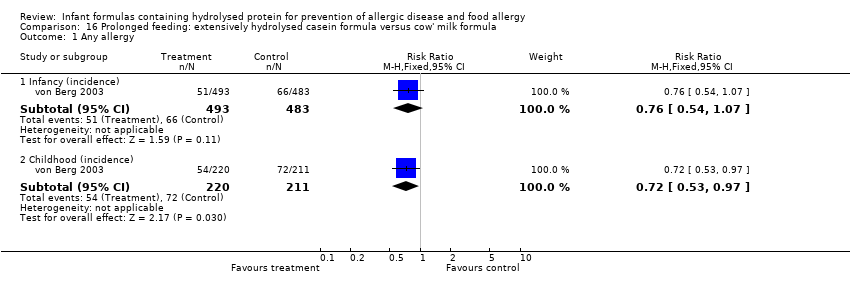
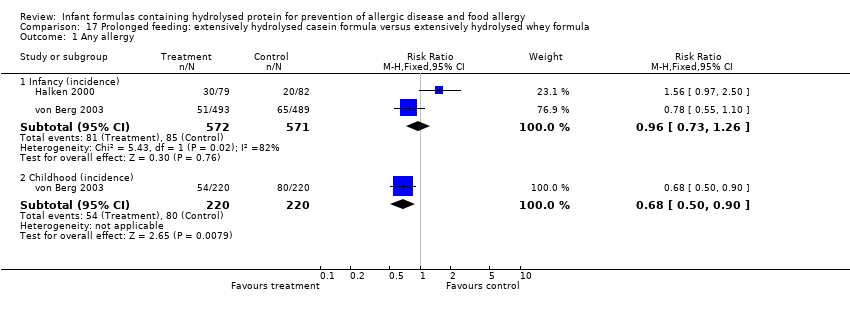
| 1.1 Infancy (incidence) | 8 | 2852 | Risk Ratio (M‐H, Fixed, 95% CI) | 0.82 [0.72, 0.95] |
| 1.2 Childhood (incidence) | 2 | 950 | Risk Ratio (M‐H, Fixed, 95% CI) | 0.85 [0.69, 1.05] |
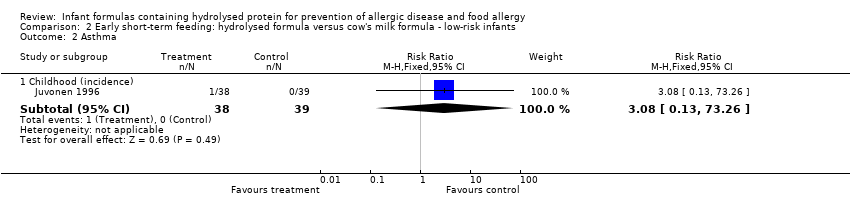
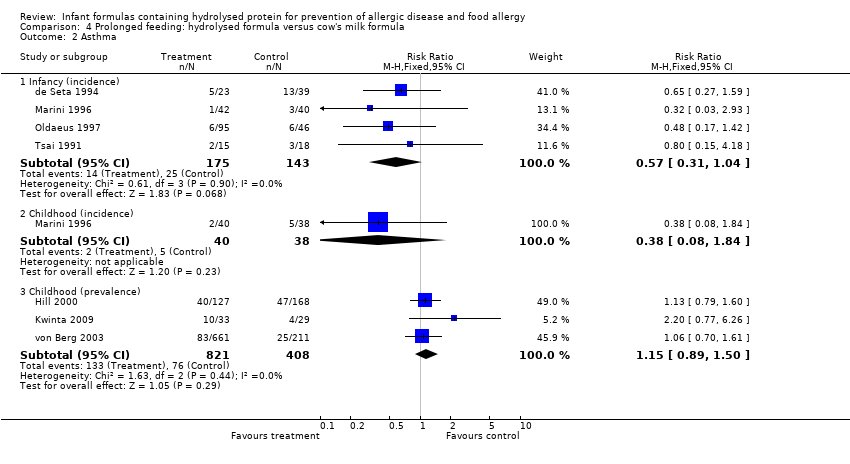
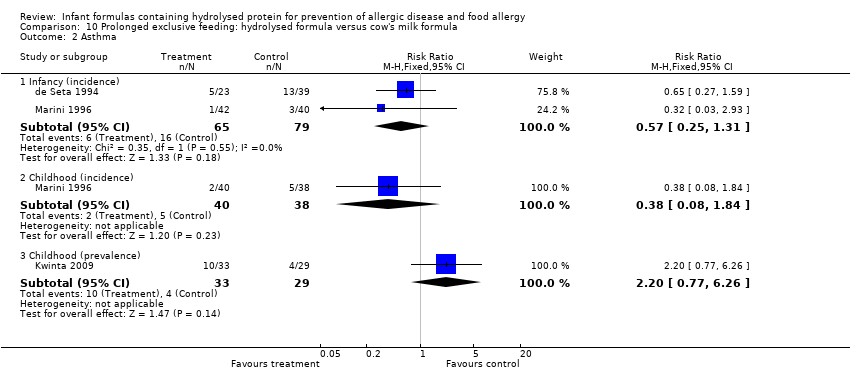
| 2 Asthma Show forest plot | 6 | | Risk Ratio (M‐H, Fixed, 95% CI) | Subtotals only |
|
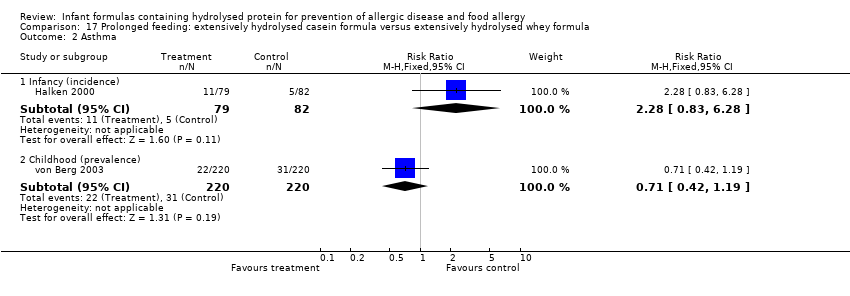
| 2.1 Infancy (incidence) | 4 | 318 | Risk Ratio (M‐H, Fixed, 95% CI) | 0.57 [0.31, 1.04] |
| 2.2 Childhood (incidence) | 1 | 78 | Risk Ratio (M‐H, Fixed, 95% CI) | 0.38 [0.08, 1.84] |
| 2.3 Childhood (prevalence) | 2 | 1167 | Risk Ratio (M‐H, Fixed, 95% CI) | 1.09 [0.83, 1.44] |
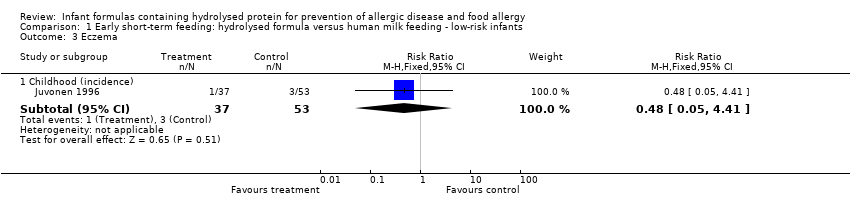
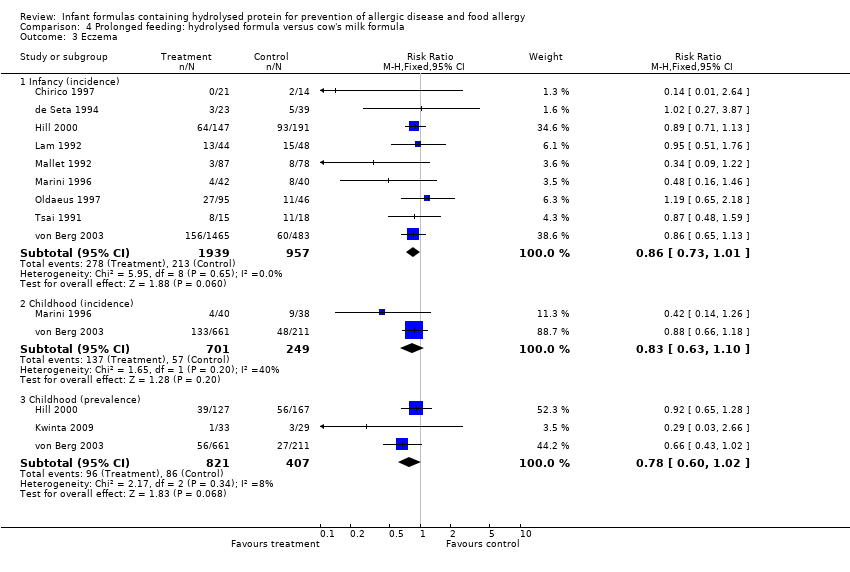
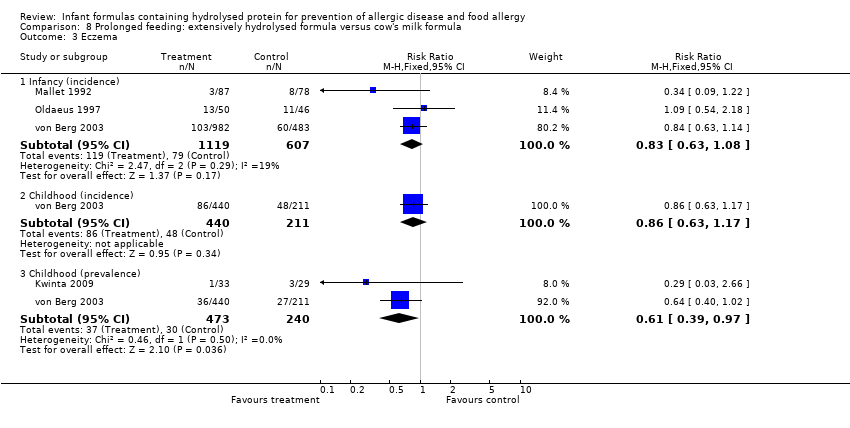
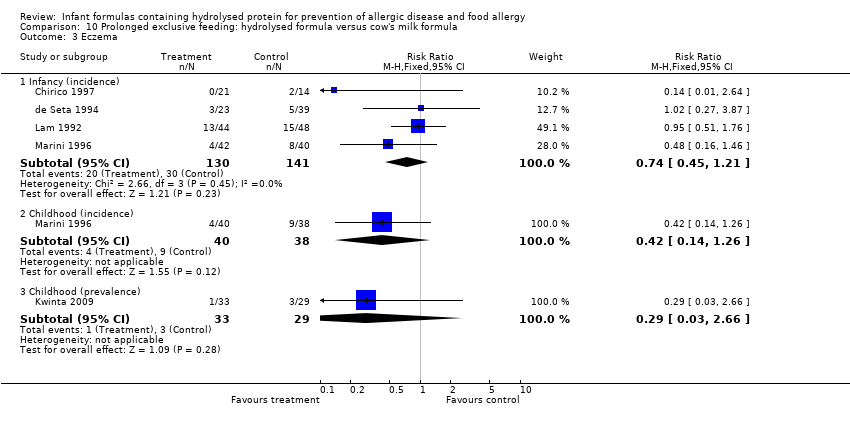
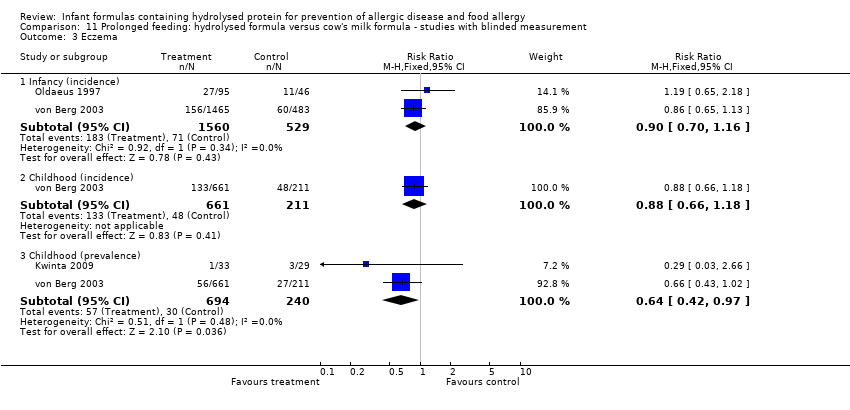
| 3 Eczema Show forest plot | 9 | | Risk Ratio (M‐H, Fixed, 95% CI) | Subtotals only |
|
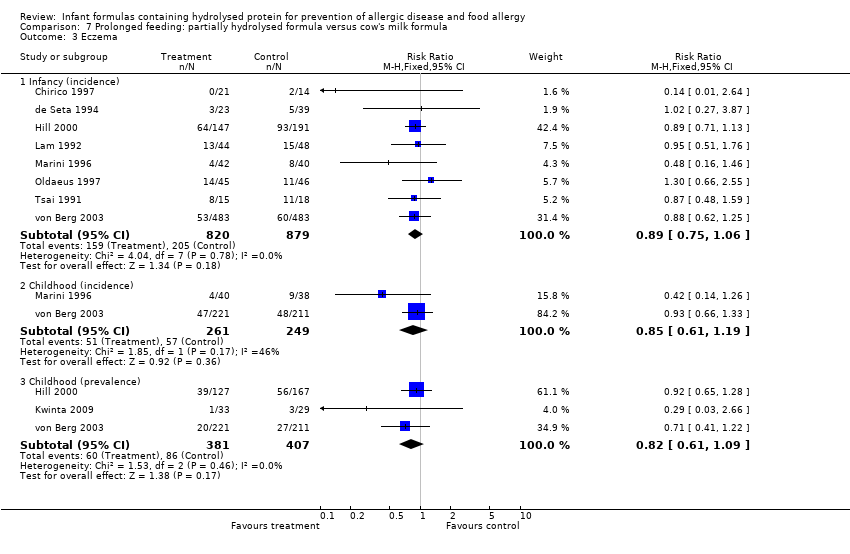
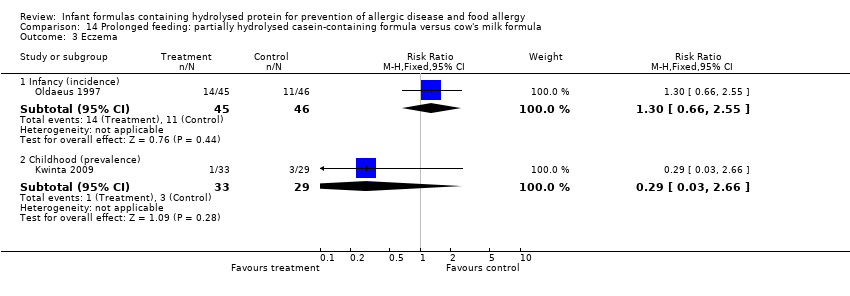
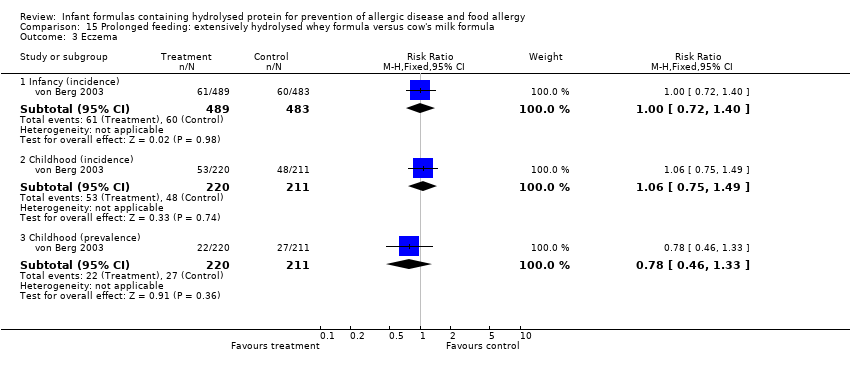
| 3.1 Infancy (incidence) | 9 | 2896 | Risk Ratio (M‐H, Fixed, 95% CI) | 0.86 [0.73, 1.01] |
| 3.2 Childhood (incidence) | 2 | 950 | Risk Ratio (M‐H, Fixed, 95% CI) | 0.83 [0.63, 1.10] |
| 3.3 Childhood (prevalence) | 2 | 1166 | Risk Ratio (M‐H, Fixed, 95% CI) | 0.80 [0.61, 1.04] |
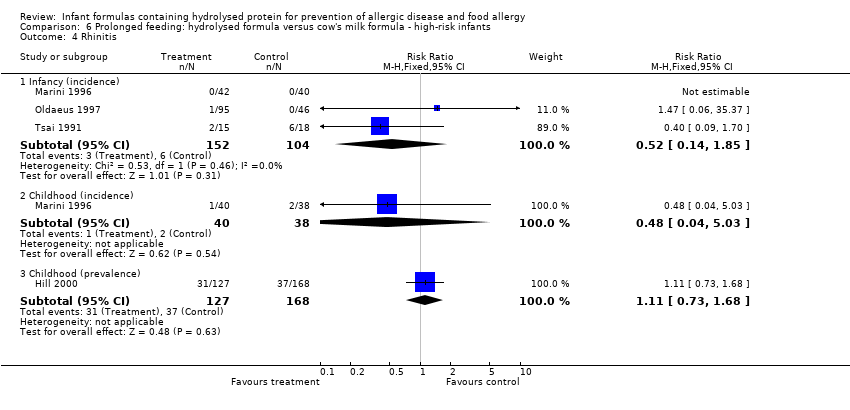
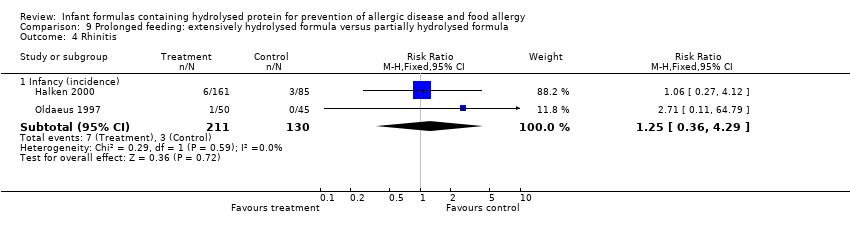
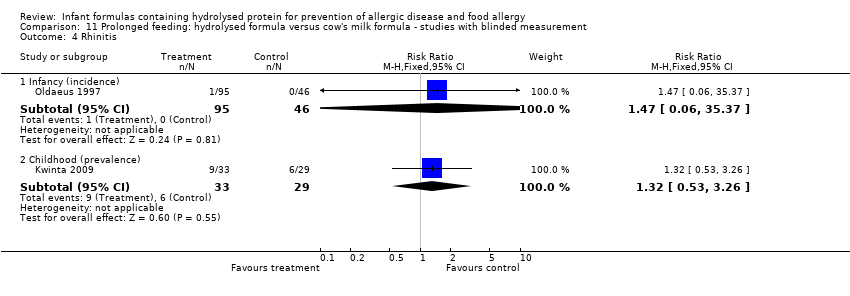
| 4 Rhinitis Show forest plot | 4 | | Risk Ratio (M‐H, Fixed, 95% CI) | Subtotals only |
|
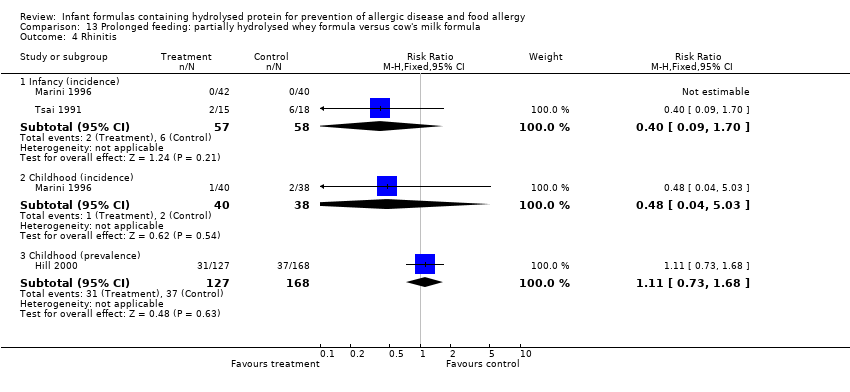
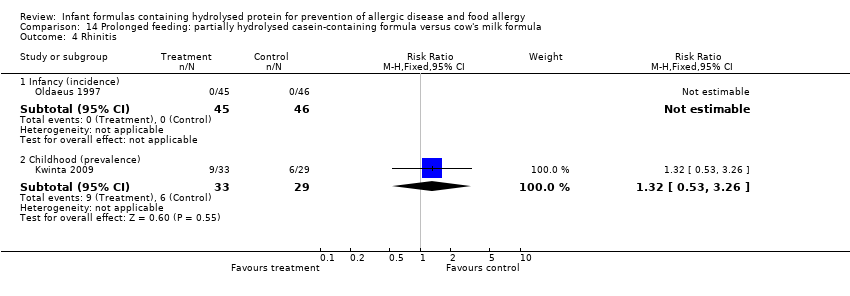
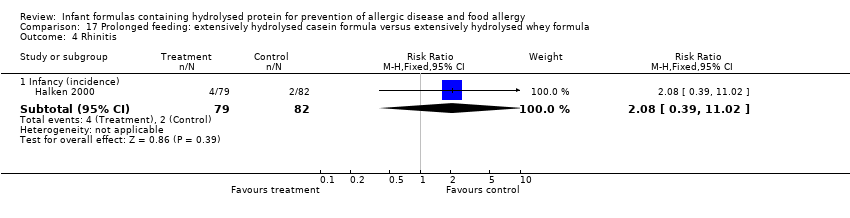
| 4.1 Infancy (incidence) | 3 | 256 | Risk Ratio (M‐H, Fixed, 95% CI) | 0.52 [0.14, 1.85] |
| 4.2 Childhood (incidence) | 1 | 78 | Risk Ratio (M‐H, Fixed, 95% CI) | 0.48 [0.04, 5.03] |
| 4.3 Childhood (prevalence) | 1 | 295 | Risk Ratio (M‐H, Fixed, 95% CI) | 1.11 [0.73, 1.68] |
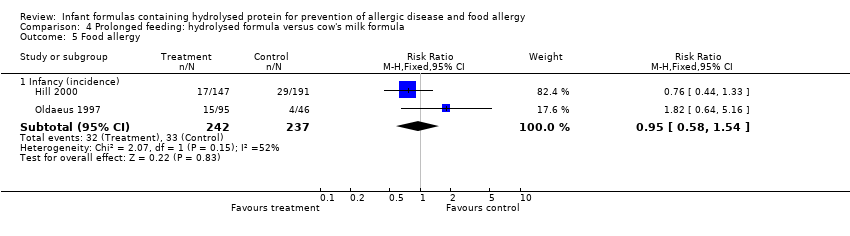
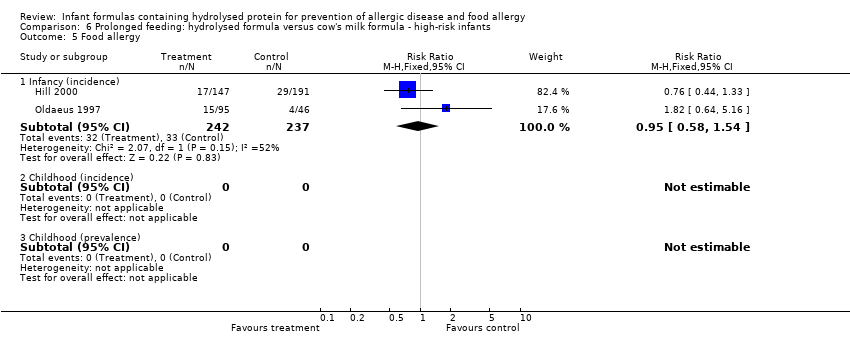
| 5 Food allergy Show forest plot | 2 | | Risk Ratio (M‐H, Fixed, 95% CI) | Subtotals only |
|
| 5.1 Infancy (incidence) | 2 | 479 | Risk Ratio (M‐H, Fixed, 95% CI) | 0.95 [0.58, 1.54] |
| 5.2 Childhood (incidence) | 0 | 0 | Risk Ratio (M‐H, Fixed, 95% CI) | 0.0 [0.0, 0.0] |
| 5.3 Childhood (prevalence) | 0 | 0 | Risk Ratio (M‐H, Fixed, 95% CI) | 0.0 [0.0, 0.0] |
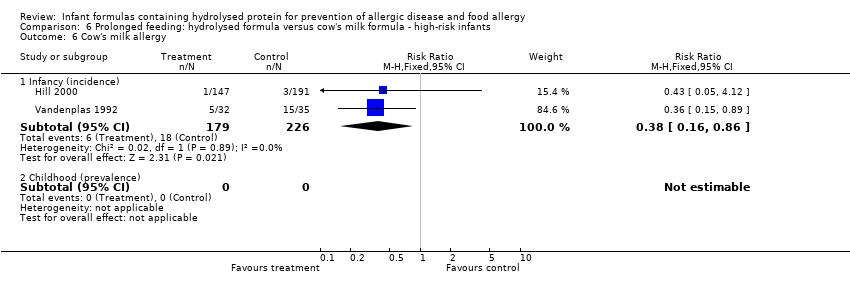
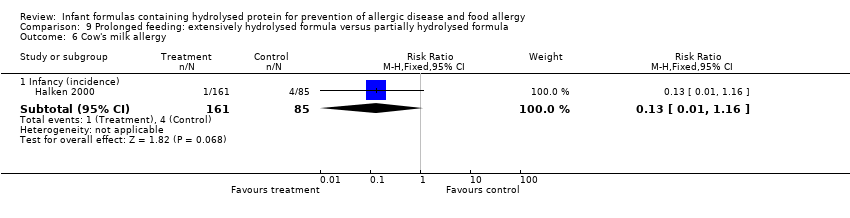
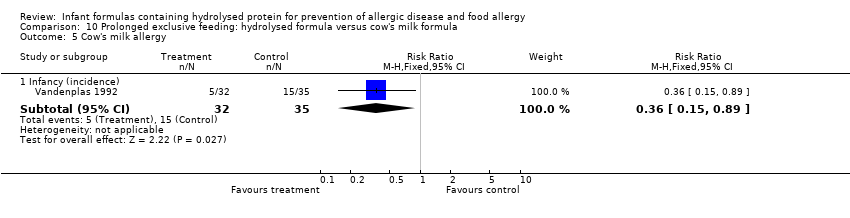
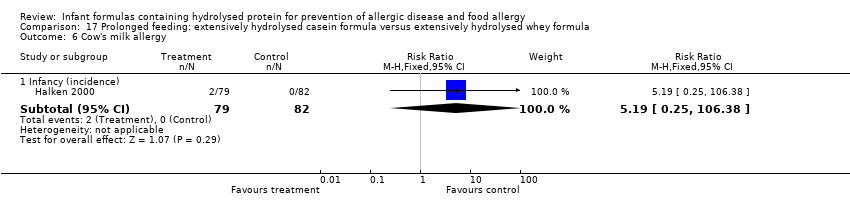
| 6 Cow's milk allergy Show forest plot | 2 | | Risk Ratio (M‐H, Fixed, 95% CI) | Subtotals only |
|
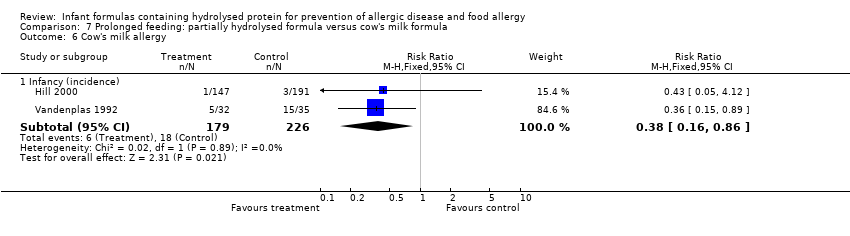
| 6.1 Infancy (incidence) | 2 | 405 | Risk Ratio (M‐H, Fixed, 95% CI) | 0.38 [0.16, 0.86] |
| 6.2 Childhood (prevalence) | 0 | 0 | Risk Ratio (M‐H, Fixed, 95% CI) | 0.0 [0.0, 0.0] |