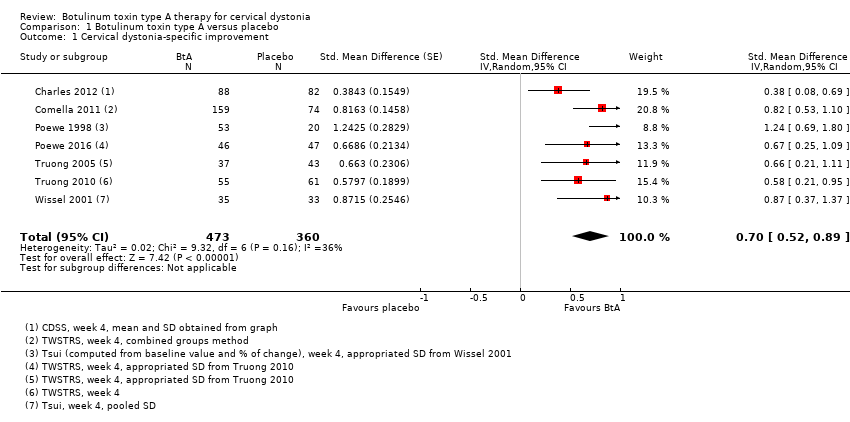
| 1 Cervical dystonia‐specific improvement Show forest plot | 7 | 833 | Std. Mean Difference (Random, 95% CI) | 0.70 [0.52, 0.89] |
|
| 2 Cervical dystonia‐specific improvement ‐ TWSTRS subgroup analysis Show forest plot | 4 | 522 | Mean Difference (IV, Random, 95% CI) | 8.06 [6.08, 10.05] |
|
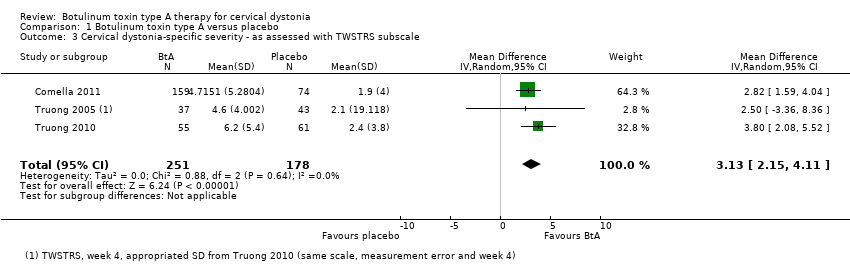
| 3 Cervical dystonia‐specific severity ‐ as assessed with TWSTRS subscale Show forest plot | 3 | 429 | Mean Difference (IV, Random, 95% CI) | 3.13 [2.15, 4.11] |
|
| 4 Cervical dystonia‐specific disability ‐ as assessed with TWSTRS subscale Show forest plot | 3 | 429 | Mean Difference (IV, Random, 95% CI) | 2.52 [1.72, 3.31] |
|
| 5 Cervical dystonia‐specific improvement ‐ doses subgroup analysis Show forest plot | 6 | 777 | Std. Mean Difference (Random, 95% CI) | 0.84 [0.68, 1.00] |
|
| 5.1 Low dose | 1 | 39 | Std. Mean Difference (Random, 95% CI) | 1.24 [0.55, 1.94] |
| 5.2 Medium dose | 6 | 545 | Std. Mean Difference (Random, 95% CI) | 0.76 [0.59, 0.94] |
| 5.3 High dose | 2 | 193 | Std. Mean Difference (Random, 95% CI) | 1.08 [0.53, 1.63] |
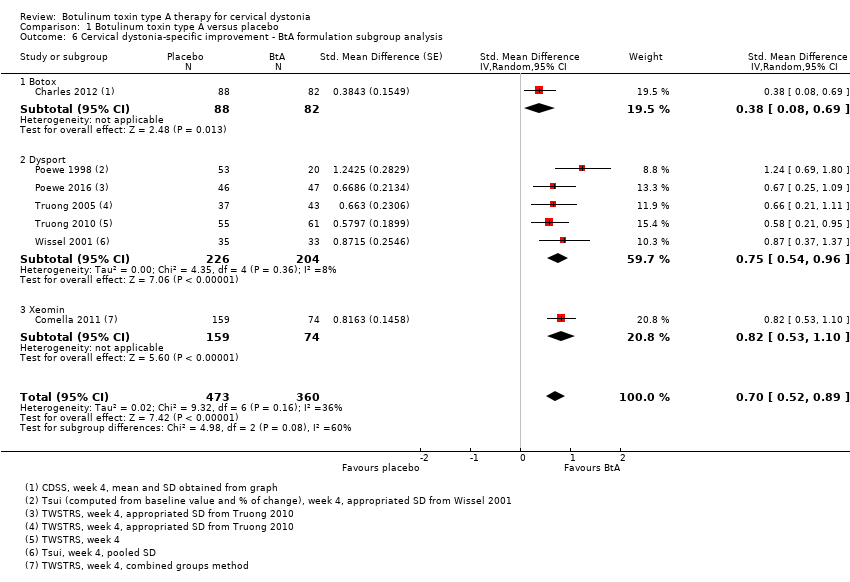
| 6 Cervical dystonia‐specific improvement ‐ BtA formulation subgroup analysis Show forest plot | 7 | 833 | Std. Mean Difference (Random, 95% CI) | 0.70 [0.52, 0.89] |
|
| 6.1 Botox | 1 | 170 | Std. Mean Difference (Random, 95% CI) | 0.38 [0.08, 0.69] |
| 6.2 Dysport | 5 | 430 | Std. Mean Difference (Random, 95% CI) | 0.75 [0.54, 0.96] |
| 6.3 Xeomin | 1 | 233 | Std. Mean Difference (Random, 95% CI) | 0.82 [0.53, 1.10] |
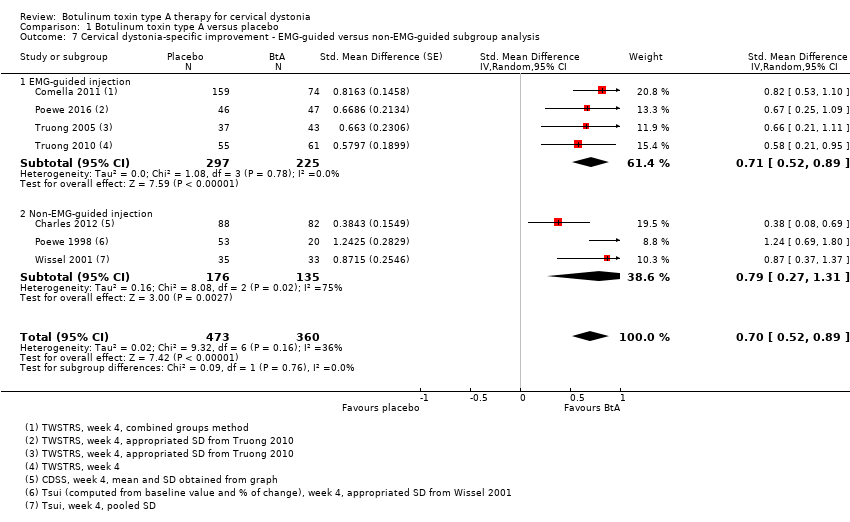
| 7 Cervical dystonia‐specific improvement ‐ EMG‐guided versus non‐EMG‐guided subgroup analysis Show forest plot | 7 | 833 | Std. Mean Difference (Random, 95% CI) | 0.70 [0.52, 0.89] |
|
| 7.1 EMG‐guided injection | 4 | 522 | Std. Mean Difference (Random, 95% CI) | 0.71 [0.52, 0.89] |
| 7.2 Non‐EMG‐guided injection | 3 | 311 | Std. Mean Difference (Random, 95% CI) | 0.79 [0.27, 1.31] |
| 8 Adverse events Show forest plot | 7 | 952 | Risk Ratio (M‐H, Random, 95% CI) | 1.19 [1.03, 1.36] |
|
| 9 Adverse events ‐ doses subgroup analysis Show forest plot | 6 | | Risk Ratio (M‐H, Random, 95% CI) | Subtotals only |
|
| 9.1 Low dose | 1 | 39 | Risk Ratio (M‐H, Random, 95% CI) | 1.47 [0.56, 3.85] |
| 9.2 Medium dose | 6 | 664 | Risk Ratio (M‐H, Random, 95% CI) | 1.23 [1.06, 1.44] |
| 9.3 High dose | 2 | 193 | Risk Ratio (M‐H, Random, 95% CI) | 1.90 [0.72, 5.02] |
| 10 Adverse events ‐ BtA formulation subgroup analysis Show forest plot | 7 | 952 | Risk Ratio (M‐H, Random, 95% CI) | 1.19 [1.03, 1.36] |
|
| 10.1 Botox | 1 | 170 | Risk Ratio (M‐H, Random, 95% CI) | 1.01 [0.78, 1.30] |
| 10.2 Dysport | 5 | 549 | Risk Ratio (M‐H, Random, 95% CI) | 1.30 [1.02, 1.66] |
| 10.3 Xeomin | 1 | 233 | Risk Ratio (M‐H, Random, 95% CI) | 1.22 [0.92, 1.62] |
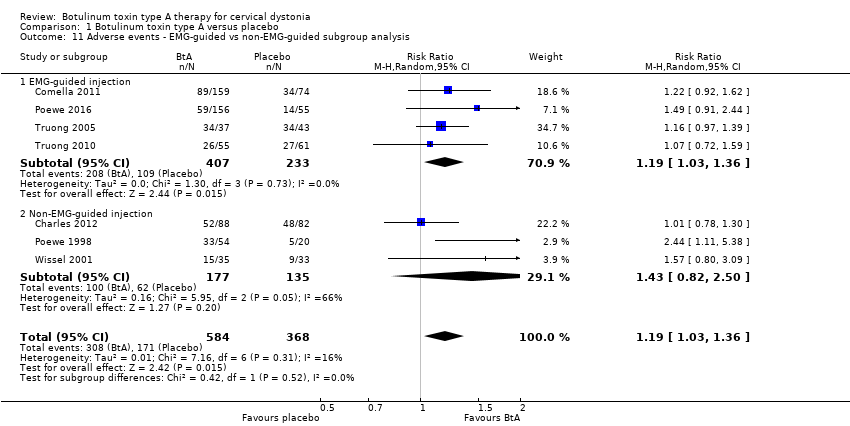
| 11 Adverse events ‐ EMG‐guided vs non‐EMG‐guided subgroup analysis Show forest plot | 7 | 952 | Risk Ratio (M‐H, Random, 95% CI) | 1.19 [1.03, 1.36] |
|
| 11.1 EMG‐guided injection | 4 | 640 | Risk Ratio (M‐H, Random, 95% CI) | 1.19 [1.03, 1.36] |
| 11.2 Non‐EMG‐guided injection | 3 | 312 | Risk Ratio (M‐H, Random, 95% CI) | 1.43 [0.82, 2.50] |
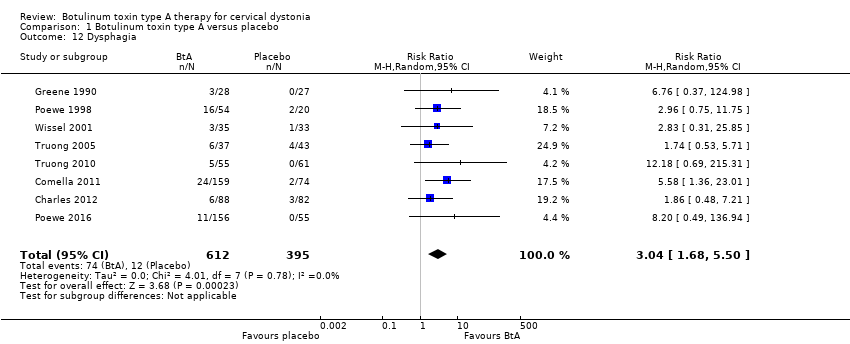
| 12 Dysphagia Show forest plot | 8 | 1007 | Risk Ratio (M‐H, Random, 95% CI) | 3.04 [1.68, 5.50] |
|
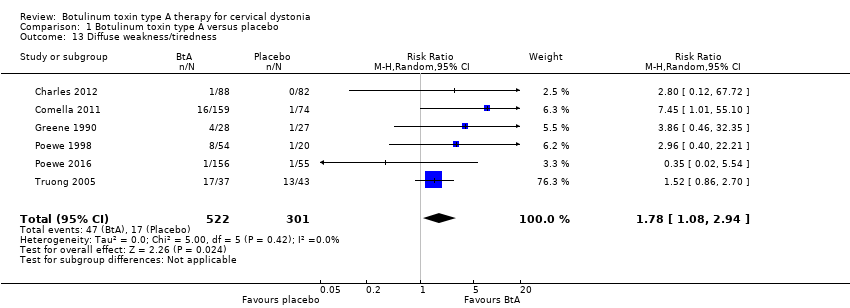
| 13 Diffuse weakness/tiredness Show forest plot | 6 | 823 | Risk Ratio (M‐H, Random, 95% CI) | 1.78 [1.08, 2.94] |
|
| 14 Neck weakness Show forest plot | 4 | 277 | Risk Ratio (M‐H, Random, 95% CI) | 3.23 [0.95, 10.91] |
|
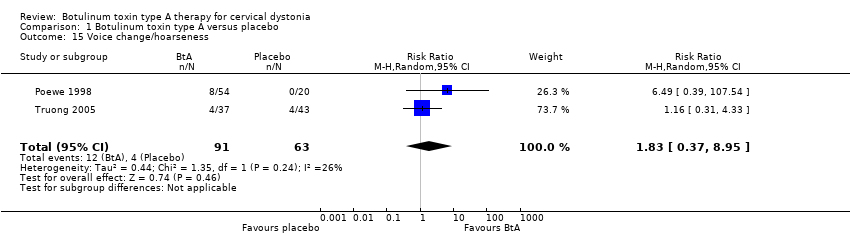
| 15 Voice change/hoarseness Show forest plot | 2 | 154 | Risk Ratio (M‐H, Random, 95% CI) | 1.83 [0.37, 8.95] |
|
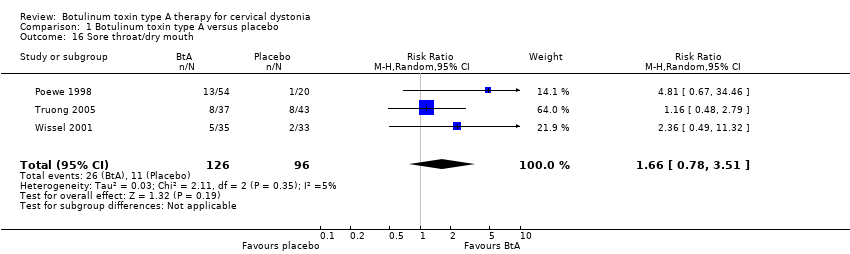
| 16 Sore throat/dry mouth Show forest plot | 3 | 222 | Risk Ratio (M‐H, Random, 95% CI) | 1.66 [0.78, 3.51] |
|
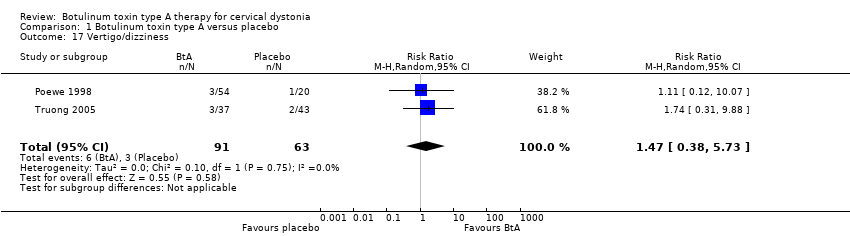
| 17 Vertigo/dizziness Show forest plot | 2 | 154 | Risk Ratio (M‐H, Random, 95% CI) | 1.47 [0.38, 5.73] |
|
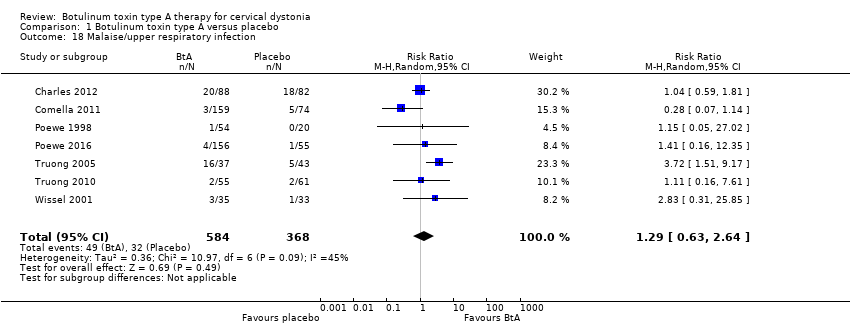
| 18 Malaise/upper respiratory infection Show forest plot | 7 | 952 | Risk Ratio (M‐H, Random, 95% CI) | 1.29 [0.63, 2.64] |
|
| 19 Local pain (injection site) Show forest plot | 7 | 837 | Risk Ratio (M‐H, Random, 95% CI) | 1.33 [0.88, 2.02] |
|
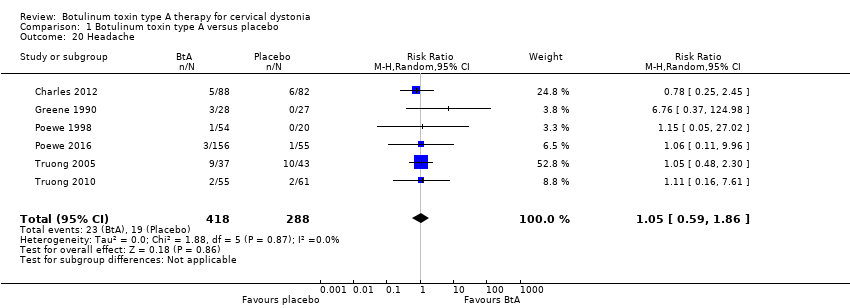
| 20 Headache Show forest plot | 6 | 706 | Risk Ratio (M‐H, Random, 95% CI) | 1.05 [0.59, 1.86] |
|
| 21 Any improvement by subjective clinician assessment Show forest plot | 4 | 544 | Risk Ratio (M‐H, Random, 95% CI) | 1.91 [1.47, 2.49] |
|
| 22 Any improvement by subjective participant assessment Show forest plot | 5 | 624 | Risk Ratio (M‐H, Random, 95% CI) | 2.30 [1.83, 2.90] |
|
| 23 Any improvement by subjective participant assessment ‐ doses subgroup analysis Show forest plot | 4 | | Risk Ratio (M‐H, Random, 95% CI) | Subtotals only |
|
| 23.1 Low dose | 1 | 39 | Risk Ratio (M‐H, Random, 95% CI) | 1.58 [0.30, 8.43] |
| 23.2 Medium dose | 4 | 336 | Risk Ratio (M‐H, Random, 95% CI) | 2.44 [1.82, 3.25] |
| 23.3 High dose | 2 | 193 | Risk Ratio (M‐H, Random, 95% CI) | 3.39 [2.16, 5.33] |
| 24 Any improvement by subjective participant assessment ‐ BtA formulation subgroup analysis Show forest plot | 5 | | Risk Ratio (M‐H, Random, 95% CI) | Subtotals only |
|
| 24.1 Botox | 1 | 170 | Risk Ratio (M‐H, Random, 95% CI) | 1.99 [1.34, 2.94] |
| 24.2 Dysport | 3 | 221 | Risk Ratio (M‐H, Random, 95% CI) | 2.13 [1.49, 3.04] |
| 24.3 Xeomin | 1 | 233 | Risk Ratio (M‐H, Random, 95% CI) | 3.23 [2.03, 5.14] |
| 25 Any improvement by subjective participant assessment ‐ EMG guided vs non‐EMG‐guided subgroup analysis Show forest plot | 5 | | Risk Ratio (M‐H, Random, 95% CI) | Subtotals only |
|
| 25.1 EMG‐guided injection | 2 | 313 | Risk Ratio (M‐H, Random, 95% CI) | 2.97 [1.99, 4.43] |
| 25.2 Non‐EMG‐guided injection | 3 | 311 | Risk Ratio (M‐H, Random, 95% CI) | 2.03 [1.53, 2.69] |
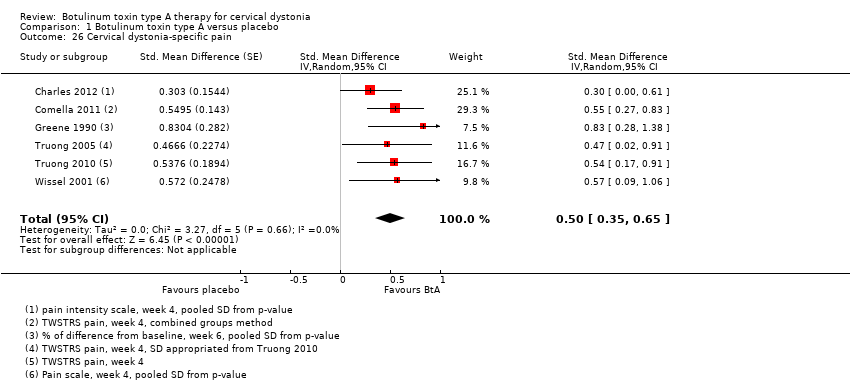
| 26 Cervical dystonia‐specific pain Show forest plot | 6 | | Std. Mean Difference (Random, 95% CI) | 0.50 [0.35, 0.65] |
|
| 27 Cervical dystonia‐specific pain ‐ TWSTRS pain subscale subgroup analysis Show forest plot | 3 | | Mean Difference (Random, 95% CI) | 2.11 [1.38, 2.83] |
|
| 28 Cervical dystonia‐specific pain ‐ BtA formulation subgroup analysis Show forest plot | 6 | | Std. Mean Difference (Random, 95% CI) | 0.50 [0.35, 0.65] |
|
| 28.1 Botox | 2 | | Std. Mean Difference (Random, 95% CI) | 0.51 [0.01, 1.02] |
| 28.2 Dysport | 3 | | Std. Mean Difference (Random, 95% CI) | 0.52 [0.28, 0.77] |
| 28.3 Xeomin | 1 | | Std. Mean Difference (Random, 95% CI) | 0.55 [0.27, 0.83] |
| 29 Cervical dystonia‐specific pain ‐ EMG‐guided vs non‐EMG‐guided subgroup analysis Show forest plot | 6 | 654 | Std. Mean Difference (Random, 95% CI) | 0.50 [0.35, 0.65] |
|
| 29.1 EMG‐guided injection | 3 | 429 | Std. Mean Difference (Random, 95% CI) | 0.53 [0.33, 0.73] |
| 29.2 Non‐EMG‐guided injection | 3 | 225 | Std. Mean Difference (Random, 95% CI) | 0.50 [0.20, 0.80] |
| 30 Tolerability ‐ withdrawals Show forest plot | 4 | 574 | Risk Ratio (IV, Random, 95% CI) | 0.38 [0.23, 0.62] |
|
| 31 Tolerability ‐ withdrawals due lack of efficacy subgroup analysis Show forest plot | 3 | 519 | Risk Ratio (IV, Random, 95% CI) | 0.30 [0.17, 0.53] |
|
| 32 Tolerability ‐ withdrawals due to adverse events subgroup analysis Show forest plot | 2 | 288 | Risk Ratio (IV, Random, 95% CI) | 3.10 [0.36, 26.74] |
|