Tratamiento con toxina botulínica tipo A para la distonía cervical
Información
- DOI:
- https://doi.org/10.1002/14651858.CD003633.pub3Copiar DOI

- Base de datos:
-
- Cochrane Database of Systematic Reviews
- Versión publicada:
-
- 12 diciembre 2017see what's new
- Tipo:
-
- Intervention
- Etapa:
-
- Review
- Grupo Editorial Cochrane:
-
Grupo Cochrane de Trastornos del movimiento
- Copyright:
-
- Copyright © 2017 The Cochrane Collaboration. Published by John Wiley & Sons, Ltd.
Cifras del artículo
Altmetric:
Citado por:
Autores
Contributions of authors
Austen P Moore ‐ APM; Cristina Sampaio ‐ CS; Filipe Brogueira Rodrigues ‐ FBR; Gonçalo S Duarte ‐ GSD; João Costa ‐ JC; Joaquim Ferreira ‐ JJF; Mafalda Castelão ‐ MC; Raquel E Marques ‐ REM.
Concieving the review ‐ APM, CS, JC, JJF
Designing the review ‐ APM, CS, JC, JJF
Co‐ordinating the review ‐ JC
Designing search strategies – FBR, GSD, JC
Undertaking searches – FBR, GSD
Screening search results – FRB, GSD, MC, REM
Organising retrieval of papers ‐ FRB, GSD, JC, MF, REM
Screening retrieved papers against eligibility criteria ‐ FRB, GSD, MC, REM
Appraising quality of papers ‐ FRB, GSD, MC, REM
Extracting data from papers ‐ FRB, GSD, MC, REM
Writing to authors of papers for additional information – GSD, JC, REM
Data management for the review – FRB, GSD, MC, REM
Entering data into Review Manager 5 ‐ FRB, GSD, MC, REM
Analysis of data ‐ FRB, GSD, MC, REM
Interpretation of data ‐ APM, CS, FRB, GSD, JC, JJF, MC, REM
Writing the review ‐ FRB, GSD, JC, MC, REM
GRADE assessment ‐ GSD, FBR
Providing general advice on the review – APM, CS, JC, JJF
Performing previous work that was the foundation of the current review – Ana Borges, Claudia Espírito Santo, Miguel Coelho.
Sources of support
Internal sources
-
Cochrane Movement Disorders, Portugal.
-
The Walton Centre for Neurology and Neurosurgery, UK.
External sources
-
No sources of support supplied
Declarations of interest
JC, JJF, and CS were investigators in clinical trials in botulinum toxin A and B use in dystonia sponsored by Elan (manufacturer of botulinum toxin type B), Allergan (manufacturer of botulinum toxin type A), and Ipsen (manufacturer of botulinum toxin type A). Searching for studies, selection of studies, data extraction and analysis (including risk of bias), and GRADE assessment were performed by authors (FBR, GSD, MC, REM) who were not trialists. JJF and CS were speakers in symposiums promoted by Elan, Allergan, and Ipsen.
APM has received royalties from Ipsen for the use 'LIVEchart' scoring system for botulinum toxin treatment efficacy. He has additionally received consulting fees from Ipsen, Merz (manufacturer of botulinum toxin type A), Eisai (manufacturer of botulinum toxin type B), and Allergan. The same companies have provided for support for travel to meetings for studies or other purposes.
Acknowledgements
We would like to thank Ema Roque (Cochrane Movement Disorders) and Daisy Abreu (Clinical Pharmacology Unit, Faculty of Medicine, University of Lisbon) sincerely for their contributions to this review.
Version history
| Published | Title | Stage | Authors | Version |
| 2020 Nov 12 | Botulinum toxin type A therapy for cervical dystonia | Review | Filipe B Rodrigues, Gonçalo S Duarte, Raquel E Marques, Mafalda Castelão, Joaquim Ferreira, Cristina Sampaio, Austen P Moore, João Costa | |
| 2017 Dec 12 | Botulinum toxin type A therapy for cervical dystonia | Review | Mafalda Castelão, Raquel E Marques, Gonçalo S Duarte, Filipe B Rodrigues, Joaquim Ferreira, Cristina Sampaio, Austen P Moore, João Costa | |
| 2005 Jan 24 | Botulinum toxin type A therapy for cervical dystonia | Review | João Costa, Cláudia C Espírito‐Santo, Ana A Borges, Joaquim Ferreira, Miguel M Coelho, Peter Moore, Cristina Sampaio | |
| 2001 Oct 23 | Botulinum toxin type A therapy for cervical dystonia | Protocol | João Costa, Joaquim Ferreira, Ana A Borges, Cláudia C Espírito‐Santo, Miguel M Coelho, Cristina C Sampaio | |
Differences between protocol and review
For this updated review the study designs accepted were restricted to parallel‐group studies, and we opted not to exclude based on allocation concealment. No changes were made in the type of participants included or in the interventions allowed.
Adverse events, which were originally a secondary outcome, were included in this updated review as a primary safety outcome. Also, in this safety analysis we considered the proportion of participants with the most frequent adverse events, which was not stated in the original protocol. An assessment of the duration of effect was included as a new secondary outcome measure.
We no longer consider immunogenicity to be an outcome to be studied in this systematic review, as we believe it does not enhance patient's, physician's, or policymaker's ability to make decisions regarding question of this review. At most, it is an inadequate surrogate measure of the risk of developing clinical non‐responsiveness.
We used new approaches to deal with missing data and unit of analysis issues.
We used the latest recommended Cochrane tool for assessing risk of bias in this review, which was expanded to include two additional criteria, added by the review authors. We opted to include the enriched population domains, since a known positive response to botulinum toxin type A and certain disease subtype are known to influence the magnitude of response to the intervention. As has been verified in a recent Cochrane methodology systematic review (Lundh 2017), industry‐sponsored trials display "the existence of an industry bias that cannot be explained by standard 'Risk of bias' assessments". We analysed blinding of outcome assessment in two new subcategories: subjective and objective assessment and also added a ‘Summary of findings' table. The search strategy was prolonged to October 2016.
Trial Sequential Analysis was not in the original review protocol.
Keywords
MeSH
Medical Subject Headings (MeSH) Keywords
Medical Subject Headings Check Words
Humans;
PICO

Study flow diagram

Risk of bias of included studies: review authors' judgements about each risk of bias item presented as percentages across all included studies
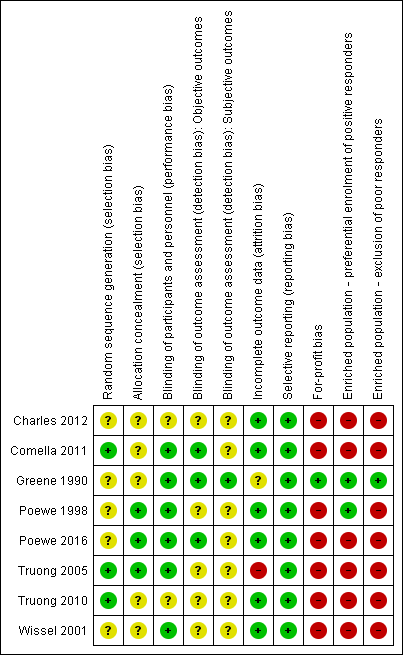
'Risk of bias' summary: review authors' judgements about each risk of bias item for each included study
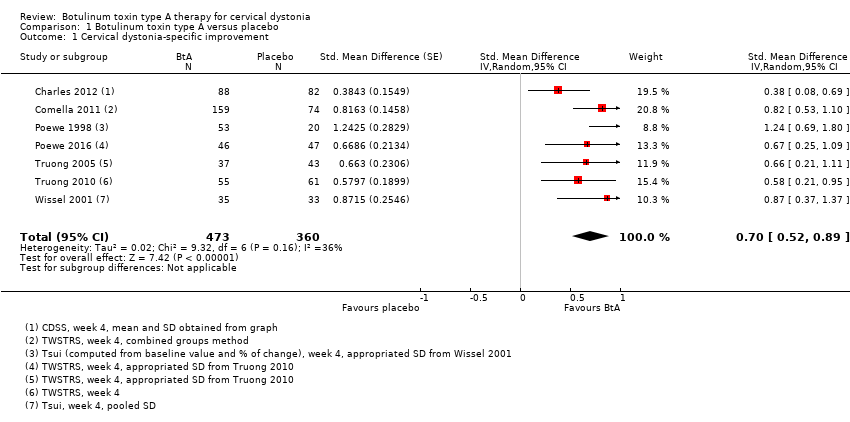
Comparison 1 Botulinum toxin type A versus placebo, Outcome 1 Cervical dystonia‐specific improvement.

Comparison 1 Botulinum toxin type A versus placebo, Outcome 2 Cervical dystonia‐specific improvement ‐ TWSTRS subgroup analysis.
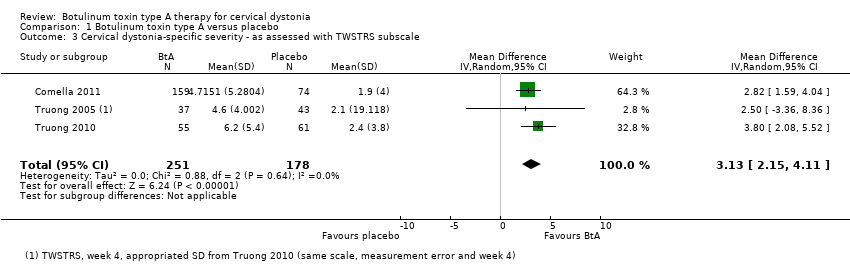
Comparison 1 Botulinum toxin type A versus placebo, Outcome 3 Cervical dystonia‐specific severity ‐ as assessed with TWSTRS subscale.

Comparison 1 Botulinum toxin type A versus placebo, Outcome 4 Cervical dystonia‐specific disability ‐ as assessed with TWSTRS subscale.

Comparison 1 Botulinum toxin type A versus placebo, Outcome 5 Cervical dystonia‐specific improvement ‐ doses subgroup analysis.
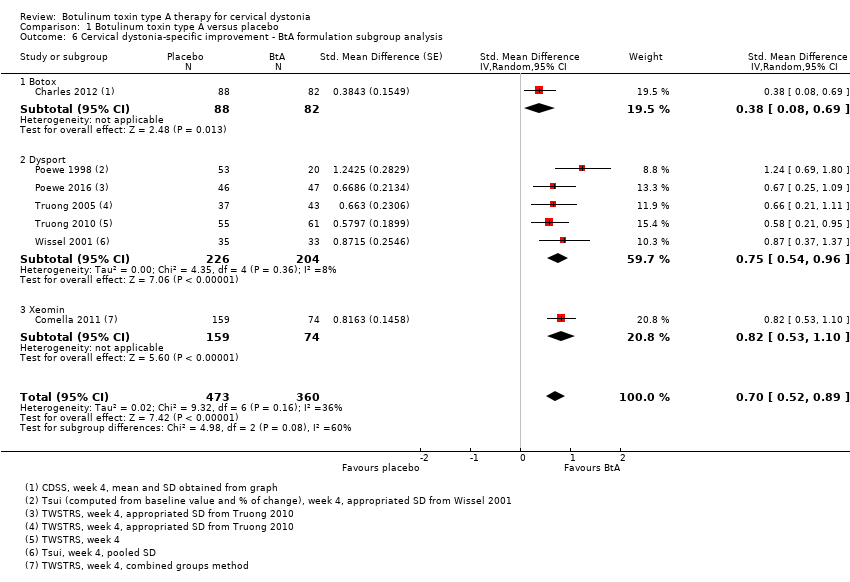
Comparison 1 Botulinum toxin type A versus placebo, Outcome 6 Cervical dystonia‐specific improvement ‐ BtA formulation subgroup analysis.
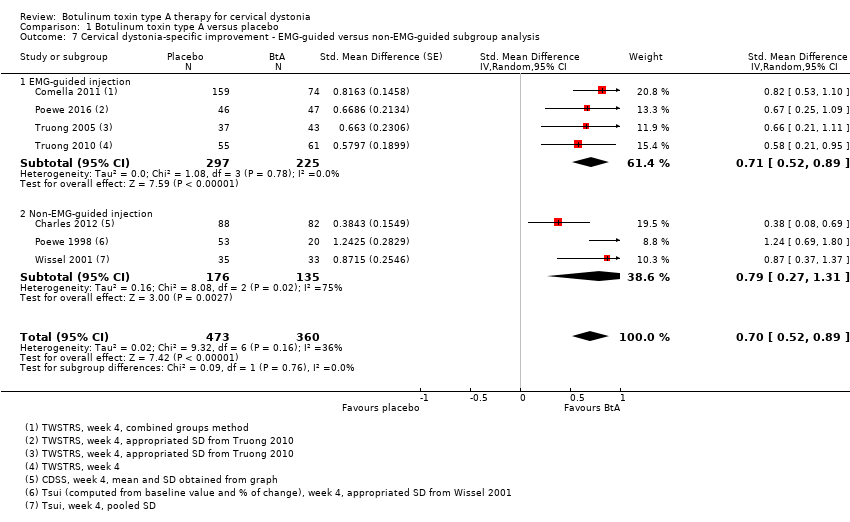
Comparison 1 Botulinum toxin type A versus placebo, Outcome 7 Cervical dystonia‐specific improvement ‐ EMG‐guided versus non‐EMG‐guided subgroup analysis.

Comparison 1 Botulinum toxin type A versus placebo, Outcome 8 Adverse events.

Comparison 1 Botulinum toxin type A versus placebo, Outcome 9 Adverse events ‐ doses subgroup analysis.

Comparison 1 Botulinum toxin type A versus placebo, Outcome 10 Adverse events ‐ BtA formulation subgroup analysis.
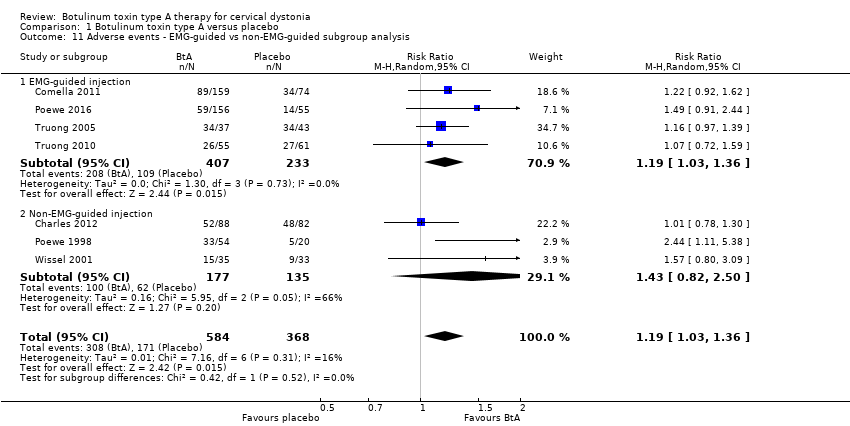
Comparison 1 Botulinum toxin type A versus placebo, Outcome 11 Adverse events ‐ EMG‐guided vs non‐EMG‐guided subgroup analysis.
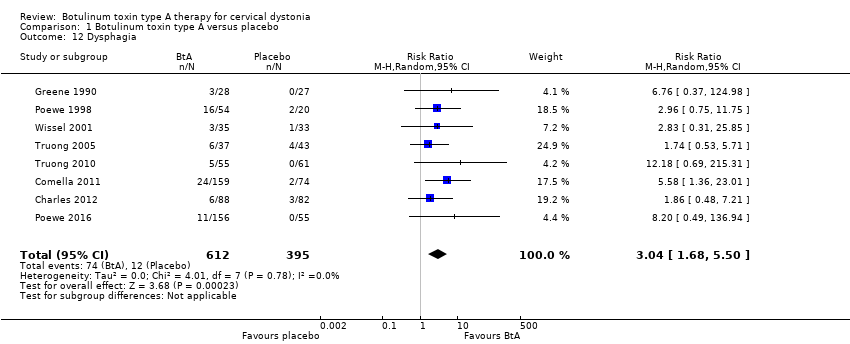
Comparison 1 Botulinum toxin type A versus placebo, Outcome 12 Dysphagia.
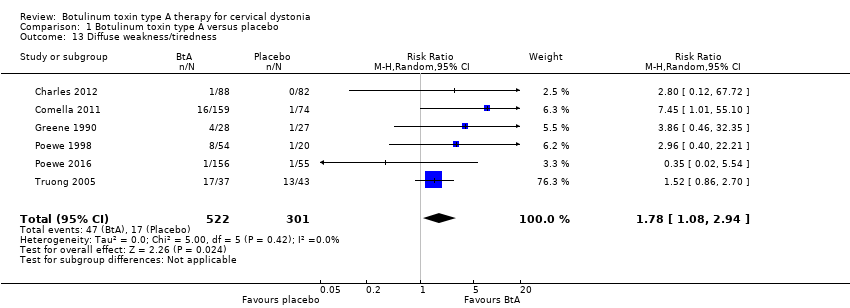
Comparison 1 Botulinum toxin type A versus placebo, Outcome 13 Diffuse weakness/tiredness.

Comparison 1 Botulinum toxin type A versus placebo, Outcome 14 Neck weakness.
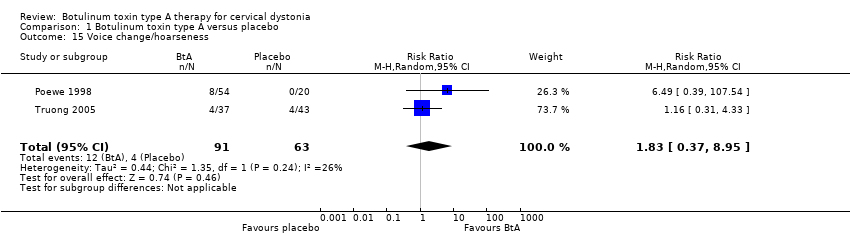
Comparison 1 Botulinum toxin type A versus placebo, Outcome 15 Voice change/hoarseness.
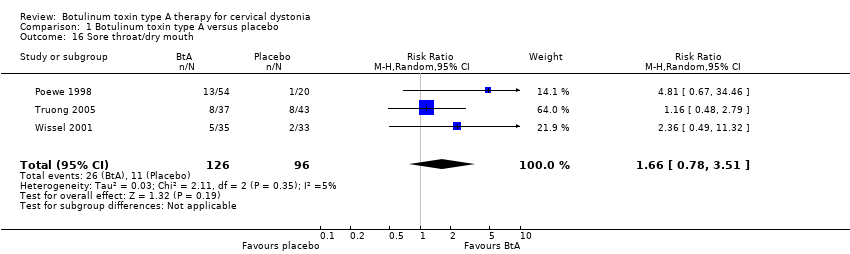
Comparison 1 Botulinum toxin type A versus placebo, Outcome 16 Sore throat/dry mouth.
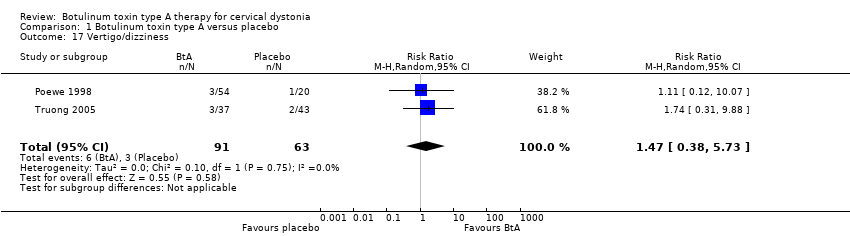
Comparison 1 Botulinum toxin type A versus placebo, Outcome 17 Vertigo/dizziness.
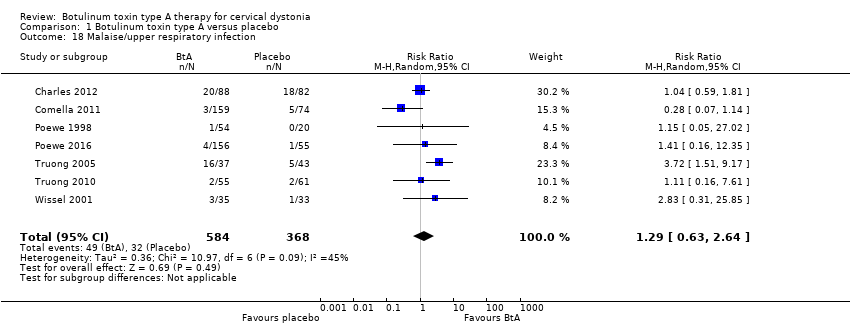
Comparison 1 Botulinum toxin type A versus placebo, Outcome 18 Malaise/upper respiratory infection.

Comparison 1 Botulinum toxin type A versus placebo, Outcome 19 Local pain (injection site).
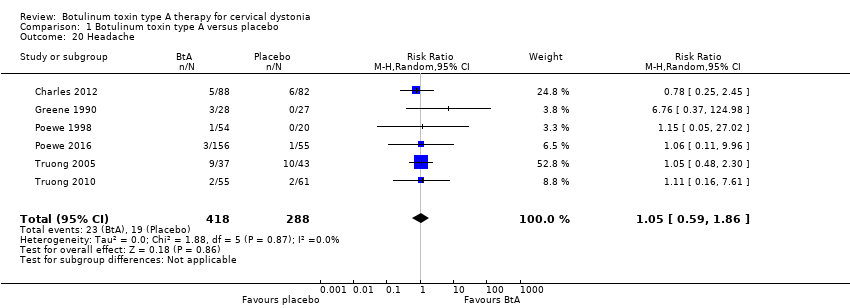
Comparison 1 Botulinum toxin type A versus placebo, Outcome 20 Headache.

Comparison 1 Botulinum toxin type A versus placebo, Outcome 21 Any improvement by subjective clinician assessment.

Comparison 1 Botulinum toxin type A versus placebo, Outcome 22 Any improvement by subjective participant assessment.

Comparison 1 Botulinum toxin type A versus placebo, Outcome 23 Any improvement by subjective participant assessment ‐ doses subgroup analysis.

Comparison 1 Botulinum toxin type A versus placebo, Outcome 24 Any improvement by subjective participant assessment ‐ BtA formulation subgroup analysis.

Comparison 1 Botulinum toxin type A versus placebo, Outcome 25 Any improvement by subjective participant assessment ‐ EMG guided vs non‐EMG‐guided subgroup analysis.
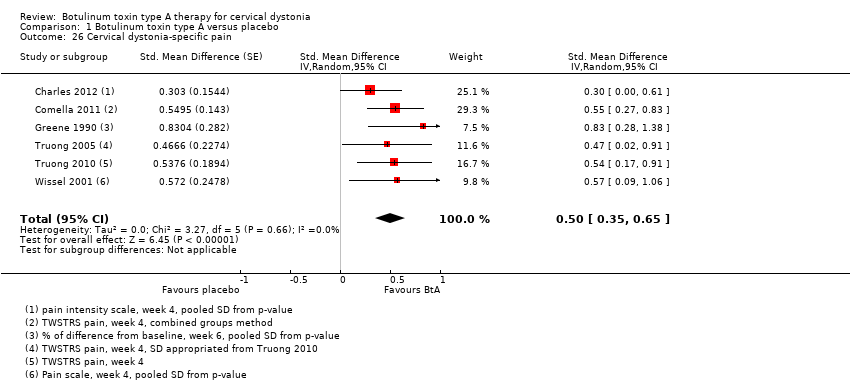
Comparison 1 Botulinum toxin type A versus placebo, Outcome 26 Cervical dystonia‐specific pain.

Comparison 1 Botulinum toxin type A versus placebo, Outcome 27 Cervical dystonia‐specific pain ‐ TWSTRS pain subscale subgroup analysis.

Comparison 1 Botulinum toxin type A versus placebo, Outcome 28 Cervical dystonia‐specific pain ‐ BtA formulation subgroup analysis.

Comparison 1 Botulinum toxin type A versus placebo, Outcome 29 Cervical dystonia‐specific pain ‐ EMG‐guided vs non‐EMG‐guided subgroup analysis.

Comparison 1 Botulinum toxin type A versus placebo, Outcome 30 Tolerability ‐ withdrawals.

Comparison 1 Botulinum toxin type A versus placebo, Outcome 31 Tolerability ‐ withdrawals due lack of efficacy subgroup analysis.

Comparison 1 Botulinum toxin type A versus placebo, Outcome 32 Tolerability ‐ withdrawals due to adverse events subgroup analysis.
| Botulinum toxin type A compared to placebo for cervical dystonia | ||||||
| Patient or population: adults with cervical dystonia | ||||||
| Outcomes | Relative effect | Anticipated absolute effects* (95% CI) | Certainty in the evidence | What happens | ||
| With placebo | With botulinum toxin type A | Difference | ||||
| Cervical dystonia‐specific impairment Assessed 3 to 6 weeks post‐injection using TWSTRS total score | ‐ | 3.9 TWSTRS units decrease | 12.45 TWSTRS units decrease | The mean change from baseline was 8.06 TWSTRS units higher (6.08 higher to 10.05 higher) in the BtA group compared to the placebo group | ⊕⊕⊕⊝ | BtA treatment probably improves cervical dystonia‐specific impairment |
| Adverse events Assessed at any point during follow‐up | RR 1.19 | 46.5% | 55.3% | 8.8% more | ⊕⊕⊕⊝ | BtA treatment probably increases the risk of adverse events |
| Subjective participant assessment Assessed 3 to 6 weeks post‐injection | RR 2.30 | 24.2% | 55.7% | 31.5% more | ⊕⊕⊕⊝ | BtA treatment probably increases the likelihood that patients will detect any form of improvement |
| Pain relief Assessed 3 to 6 weeks post‐injection using TWSTRS pain subscore | ‐b | ‐b | ‐b | The mean change from baseline was 2.11 TWSTRS units higher (1.38 higher to 2.83 higher) in the BtA group compared to the placebo group | ⊕⊕⊕⊝ | BtA treatment probably improves cervical dystonia‐related pain |
| Tolerability Assessed at any point during follow‐up | RR 0.38 | 20.5% | 7.8% (4.7 to 12.7) | 12.7% fewer (15.8 to 7.8) | ⊕⊕⊕⊝ | BtA treatment probably slightly decreases the risk of withdrawal of clinical trials |
| Dysphagia Assessed at any point during follow‐up | RR 3.04 | 3.0% | 9.2% | 6.2% more | ⊕⊕⊕⊝ | BtA treatment probably increases the risk of dysphagia |
| Diffuse weakness/tiredness Assessed at any point during follow‐up | RR 1.78 | 5.6% | 10.1% | 4.4% more | ⊕⊕⊕⊝ | BtA treatment probably increases the risk of diffuse weakness/tiredness |
| *The risk in the intervention group (and its 95% confidence interval) is based on the assumed risk in the comparison group and the relative effect of the intervention (and its 95% CI). | ||||||
| GRADE Working Group grades of evidence | ||||||
| a Downgraded one level due to serious study limitations, namely concerns with randomisation procedures and other biases such as 'for‐profit' bias. | ||||||
| Term | Definition |
| BtA‐non‐responsive | People who do not experience the expected benefit from treatment with botulinum toxin type A |
| Cervical dystonia or spasmodic torticollis | A common movement disorder in which people have abnormal movements or postures of the head and neck that they cannot control. It is frequently accompanied by social embarrassment and pain. |
| Chemodenervation | The process by which botulinum toxin causes muscular paralysis. Although all the anatomical elements necessary for muscular control are intact (i.e. nerve, synapse and muscle), there is a chemical process that disables the transmission of the electrical signal from the nerve to the muscle. |
| Dysphagia | A discomfort or difficulty when swallowing. |
| Electromyography | An examination that displays the electrical activity of muscles using pieces of metal attached to the skin or inserted into the muscle. |
| Non‐naive | People who have been treated in the past with botulinum toxin. |
| Voluntary action | Movements that people are able to control, start and stop when they want to. |
| Study ID | Number of participants | Total dropouts | Age mean, range (years) | Baseline CD impairment BtA/placebo | % participants naive to Bt | BtA formulation | Total dose per participant | EMG‐guidance | Study duration (weeks) |
| Charles 2012 | 170 | 35 (11 in BtA) | 55, 31‐76 | 9.2/9.3 (CDSS) | 0 | Botox (OnaBtA) | 236 | No | 10 |
| Comella 2011 | 233 | 14 (8 in BtA) | 53 | 42.4/41.8 (TWSTRS) | 39 | Xeomin (IncoBtA) | 120 or 240 | At discretion | 20 |
| Greene 1990 | 55 | 3 (3 in BtA) | 50 | 21% severe/ 41% severe | 100 | Botox (OnaBtA) | 150 to 165 | No | 12 |
| Poewe 1998 | 75 | 2 (2 in BtA) | 47, 26‐82 | 13.9/14.4 (Tsui scale) | 100 | Dysport (AboBtA) | 250, 500 or 1000 | No | 8 |
| Poewe 2016 | 213 | N/A | 49 | 46/47 (TWSTRS) | 10 | Dysport (AboBtA) | 500 | N/A | 12 |
| Truong 2005 | 80 | 56 (22 in BtA) | 54, 27‐78 | 45.1/46.2 (TWSTRS) | 26 | Dysport (AboBtA) | 500 | At discretion | 20 |
| Truong 2010 | 116 | 33 (10 in BtA) | 53, 20‐79 | 43.8/45.8 (TWSTRS) | 17 | Dysport (AboBtA) | 500 | At discretion | 12 |
| Wissel 2001 | 68 | 0 | 48, 18‐75 | 11.1/11.5 (Tsui scale) | 31 | Dysport (AboBtA) | 500 | No | 16 |
| Bt: botulinum toxin; CD: cervical dystonia; CDSS: Cervical Dystonia Severity Scale; EMG: electromyography; TWSTRS: Toronto Western Spasmodic Torticollis Rating Scale | |||||||||
| Outcome or subgroup title | No. of studies | No. of participants | Statistical method | Effect size |
| 1 Cervical dystonia‐specific improvement Show forest plot | 7 | 833 | Std. Mean Difference (Random, 95% CI) | 0.70 [0.52, 0.89] |
| 2 Cervical dystonia‐specific improvement ‐ TWSTRS subgroup analysis Show forest plot | 4 | 522 | Mean Difference (IV, Random, 95% CI) | 8.06 [6.08, 10.05] |
| 3 Cervical dystonia‐specific severity ‐ as assessed with TWSTRS subscale Show forest plot | 3 | 429 | Mean Difference (IV, Random, 95% CI) | 3.13 [2.15, 4.11] |
| 4 Cervical dystonia‐specific disability ‐ as assessed with TWSTRS subscale Show forest plot | 3 | 429 | Mean Difference (IV, Random, 95% CI) | 2.52 [1.72, 3.31] |
| 5 Cervical dystonia‐specific improvement ‐ doses subgroup analysis Show forest plot | 6 | 777 | Std. Mean Difference (Random, 95% CI) | 0.84 [0.68, 1.00] |
| 5.1 Low dose | 1 | 39 | Std. Mean Difference (Random, 95% CI) | 1.24 [0.55, 1.94] |
| 5.2 Medium dose | 6 | 545 | Std. Mean Difference (Random, 95% CI) | 0.76 [0.59, 0.94] |
| 5.3 High dose | 2 | 193 | Std. Mean Difference (Random, 95% CI) | 1.08 [0.53, 1.63] |
| 6 Cervical dystonia‐specific improvement ‐ BtA formulation subgroup analysis Show forest plot | 7 | 833 | Std. Mean Difference (Random, 95% CI) | 0.70 [0.52, 0.89] |
| 6.1 Botox | 1 | 170 | Std. Mean Difference (Random, 95% CI) | 0.38 [0.08, 0.69] |
| 6.2 Dysport | 5 | 430 | Std. Mean Difference (Random, 95% CI) | 0.75 [0.54, 0.96] |
| 6.3 Xeomin | 1 | 233 | Std. Mean Difference (Random, 95% CI) | 0.82 [0.53, 1.10] |
| 7 Cervical dystonia‐specific improvement ‐ EMG‐guided versus non‐EMG‐guided subgroup analysis Show forest plot | 7 | 833 | Std. Mean Difference (Random, 95% CI) | 0.70 [0.52, 0.89] |
| 7.1 EMG‐guided injection | 4 | 522 | Std. Mean Difference (Random, 95% CI) | 0.71 [0.52, 0.89] |
| 7.2 Non‐EMG‐guided injection | 3 | 311 | Std. Mean Difference (Random, 95% CI) | 0.79 [0.27, 1.31] |
| 8 Adverse events Show forest plot | 7 | 952 | Risk Ratio (M‐H, Random, 95% CI) | 1.19 [1.03, 1.36] |
| 9 Adverse events ‐ doses subgroup analysis Show forest plot | 6 | Risk Ratio (M‐H, Random, 95% CI) | Subtotals only | |
| 9.1 Low dose | 1 | 39 | Risk Ratio (M‐H, Random, 95% CI) | 1.47 [0.56, 3.85] |
| 9.2 Medium dose | 6 | 664 | Risk Ratio (M‐H, Random, 95% CI) | 1.23 [1.06, 1.44] |
| 9.3 High dose | 2 | 193 | Risk Ratio (M‐H, Random, 95% CI) | 1.90 [0.72, 5.02] |
| 10 Adverse events ‐ BtA formulation subgroup analysis Show forest plot | 7 | 952 | Risk Ratio (M‐H, Random, 95% CI) | 1.19 [1.03, 1.36] |
| 10.1 Botox | 1 | 170 | Risk Ratio (M‐H, Random, 95% CI) | 1.01 [0.78, 1.30] |
| 10.2 Dysport | 5 | 549 | Risk Ratio (M‐H, Random, 95% CI) | 1.30 [1.02, 1.66] |
| 10.3 Xeomin | 1 | 233 | Risk Ratio (M‐H, Random, 95% CI) | 1.22 [0.92, 1.62] |
| 11 Adverse events ‐ EMG‐guided vs non‐EMG‐guided subgroup analysis Show forest plot | 7 | 952 | Risk Ratio (M‐H, Random, 95% CI) | 1.19 [1.03, 1.36] |
| 11.1 EMG‐guided injection | 4 | 640 | Risk Ratio (M‐H, Random, 95% CI) | 1.19 [1.03, 1.36] |
| 11.2 Non‐EMG‐guided injection | 3 | 312 | Risk Ratio (M‐H, Random, 95% CI) | 1.43 [0.82, 2.50] |
| 12 Dysphagia Show forest plot | 8 | 1007 | Risk Ratio (M‐H, Random, 95% CI) | 3.04 [1.68, 5.50] |
| 13 Diffuse weakness/tiredness Show forest plot | 6 | 823 | Risk Ratio (M‐H, Random, 95% CI) | 1.78 [1.08, 2.94] |
| 14 Neck weakness Show forest plot | 4 | 277 | Risk Ratio (M‐H, Random, 95% CI) | 3.23 [0.95, 10.91] |
| 15 Voice change/hoarseness Show forest plot | 2 | 154 | Risk Ratio (M‐H, Random, 95% CI) | 1.83 [0.37, 8.95] |
| 16 Sore throat/dry mouth Show forest plot | 3 | 222 | Risk Ratio (M‐H, Random, 95% CI) | 1.66 [0.78, 3.51] |
| 17 Vertigo/dizziness Show forest plot | 2 | 154 | Risk Ratio (M‐H, Random, 95% CI) | 1.47 [0.38, 5.73] |
| 18 Malaise/upper respiratory infection Show forest plot | 7 | 952 | Risk Ratio (M‐H, Random, 95% CI) | 1.29 [0.63, 2.64] |
| 19 Local pain (injection site) Show forest plot | 7 | 837 | Risk Ratio (M‐H, Random, 95% CI) | 1.33 [0.88, 2.02] |
| 20 Headache Show forest plot | 6 | 706 | Risk Ratio (M‐H, Random, 95% CI) | 1.05 [0.59, 1.86] |
| 21 Any improvement by subjective clinician assessment Show forest plot | 4 | 544 | Risk Ratio (M‐H, Random, 95% CI) | 1.91 [1.47, 2.49] |
| 22 Any improvement by subjective participant assessment Show forest plot | 5 | 624 | Risk Ratio (M‐H, Random, 95% CI) | 2.30 [1.83, 2.90] |
| 23 Any improvement by subjective participant assessment ‐ doses subgroup analysis Show forest plot | 4 | Risk Ratio (M‐H, Random, 95% CI) | Subtotals only | |
| 23.1 Low dose | 1 | 39 | Risk Ratio (M‐H, Random, 95% CI) | 1.58 [0.30, 8.43] |
| 23.2 Medium dose | 4 | 336 | Risk Ratio (M‐H, Random, 95% CI) | 2.44 [1.82, 3.25] |
| 23.3 High dose | 2 | 193 | Risk Ratio (M‐H, Random, 95% CI) | 3.39 [2.16, 5.33] |
| 24 Any improvement by subjective participant assessment ‐ BtA formulation subgroup analysis Show forest plot | 5 | Risk Ratio (M‐H, Random, 95% CI) | Subtotals only | |
| 24.1 Botox | 1 | 170 | Risk Ratio (M‐H, Random, 95% CI) | 1.99 [1.34, 2.94] |
| 24.2 Dysport | 3 | 221 | Risk Ratio (M‐H, Random, 95% CI) | 2.13 [1.49, 3.04] |
| 24.3 Xeomin | 1 | 233 | Risk Ratio (M‐H, Random, 95% CI) | 3.23 [2.03, 5.14] |
| 25 Any improvement by subjective participant assessment ‐ EMG guided vs non‐EMG‐guided subgroup analysis Show forest plot | 5 | Risk Ratio (M‐H, Random, 95% CI) | Subtotals only | |
| 25.1 EMG‐guided injection | 2 | 313 | Risk Ratio (M‐H, Random, 95% CI) | 2.97 [1.99, 4.43] |
| 25.2 Non‐EMG‐guided injection | 3 | 311 | Risk Ratio (M‐H, Random, 95% CI) | 2.03 [1.53, 2.69] |
| 26 Cervical dystonia‐specific pain Show forest plot | 6 | Std. Mean Difference (Random, 95% CI) | 0.50 [0.35, 0.65] | |
| 27 Cervical dystonia‐specific pain ‐ TWSTRS pain subscale subgroup analysis Show forest plot | 3 | Mean Difference (Random, 95% CI) | 2.11 [1.38, 2.83] | |
| 28 Cervical dystonia‐specific pain ‐ BtA formulation subgroup analysis Show forest plot | 6 | Std. Mean Difference (Random, 95% CI) | 0.50 [0.35, 0.65] | |
| 28.1 Botox | 2 | Std. Mean Difference (Random, 95% CI) | 0.51 [0.01, 1.02] | |
| 28.2 Dysport | 3 | Std. Mean Difference (Random, 95% CI) | 0.52 [0.28, 0.77] | |
| 28.3 Xeomin | 1 | Std. Mean Difference (Random, 95% CI) | 0.55 [0.27, 0.83] | |
| 29 Cervical dystonia‐specific pain ‐ EMG‐guided vs non‐EMG‐guided subgroup analysis Show forest plot | 6 | 654 | Std. Mean Difference (Random, 95% CI) | 0.50 [0.35, 0.65] |
| 29.1 EMG‐guided injection | 3 | 429 | Std. Mean Difference (Random, 95% CI) | 0.53 [0.33, 0.73] |
| 29.2 Non‐EMG‐guided injection | 3 | 225 | Std. Mean Difference (Random, 95% CI) | 0.50 [0.20, 0.80] |
| 30 Tolerability ‐ withdrawals Show forest plot | 4 | 574 | Risk Ratio (IV, Random, 95% CI) | 0.38 [0.23, 0.62] |
| 31 Tolerability ‐ withdrawals due lack of efficacy subgroup analysis Show forest plot | 3 | 519 | Risk Ratio (IV, Random, 95% CI) | 0.30 [0.17, 0.53] |
| 32 Tolerability ‐ withdrawals due to adverse events subgroup analysis Show forest plot | 2 | 288 | Risk Ratio (IV, Random, 95% CI) | 3.10 [0.36, 26.74] |