Intervenciones para el tratamiento de la colitis colágena
Información
- DOI:
- https://doi.org/10.1002/14651858.CD003575.pub6Copiar DOI

- Base de datos:
-
- Cochrane Database of Systematic Reviews
- Versión publicada:
-
- 11 noviembre 2017see what's new
- Tipo:
-
- Intervention
- Etapa:
-
- Review
- Grupo Editorial Cochrane:
-
Grupo Cochrane de Salud digestiva
- Copyright:
-
- Copyright © 2017 The Cochrane Collaboration. Published by John Wiley & Sons, Ltd.
Cifras del artículo
Altmetric:
Citado por:
Autores
Declarations of interest
Tahir S Kafil: None known.
Tran M Nguyen: None known.
Petrease H Patton: None known.
John K MacDonald: None known.
Nilesh Chande has received consulting fees from AbbVie, Janssen, Takeda, and Ferring; and speaker's fees from AbbVie, Janssen, and Actavis. All of these financial activities are outside the submitted work.
John WD McDonald: None known.
Acknowledgements
Partial funding for the Cochrane IBD Group (April 1, 2016 ‐ March 31, 2018) has been provided by Crohn's and Colitis Canada (CCC).
Version history
| Published | Title | Stage | Authors | Version |
| 2017 Nov 11 | Interventions for treating collagenous colitis | Review | Tahir S Kafil, Tran M Nguyen, Petrease H Patton, John K MacDonald, Nilesh Chande, John WD McDonald | |
| 2008 Apr 23 | Interventions for treating collagenous colitis | Review | Nilesh Chande, John WD McDonald, John K MacDonald | |
| 2006 Oct 18 | Interventions for treating collagenous colitis | Review | Nilesh Chande, John WD McDonald, John K MacDonald | |
| 2005 Oct 19 | Interventions for treating collagenous colitis | Review | Nilesh Chande, John WD McDonald, John K MacDonald | |
| 2004 Jan 26 | Interventions for treating collagenous colitis | Review | Nilesh Chande, John W D McDonald, John K MacDonald | |
| 2003 Apr 07 | Interventions for treating collagenous colitis | Review | Nilesh Chande, John W McDonald, John K MacDonald | |
Differences between protocol and review
We updated the methods to include a full risk of bias assessment for the included studies. We utilized the GRADE criteria to assess the overall quality of the evidence supporting the primary and secondary outcomes. A PRISMA diagram was used to document the study flow.
Keywords
MeSH
Medical Subject Headings (MeSH) Keywords
- Bismuth [therapeutic use];
- Boswellia [chemistry];
- Budesonide [therapeutic use];
- Cholestyramine Resin [therapeutic use];
- Chronic Disease;
- Colitis, Collagenous [complications, *therapy];
- Diarrhea [etiology, *therapy];
- Glucocorticoids [therapeutic use];
- Mesalamine [therapeutic use];
- Organometallic Compounds [therapeutic use];
- Plant Extracts [therapeutic use];
- Prednisolone [therapeutic use];
- Probiotics [therapeutic use];
- Randomized Controlled Trials as Topic;
- Salicylates [therapeutic use];
Medical Subject Headings Check Words
Humans;
PICO

Study flow diagram.

Risk of bias summary: review authors' judgements about each risk of bias item for each included study.

Comparison 1 Bismuth subsalicylate versus placebo, Outcome 1 Clinical response.
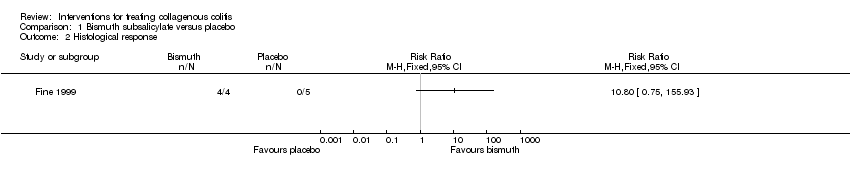
Comparison 1 Bismuth subsalicylate versus placebo, Outcome 2 Histological response.

Comparison 1 Bismuth subsalicylate versus placebo, Outcome 3 Adverse events.

Comparison 1 Bismuth subsalicylate versus placebo, Outcome 4 Withdrawals due to adverse events.
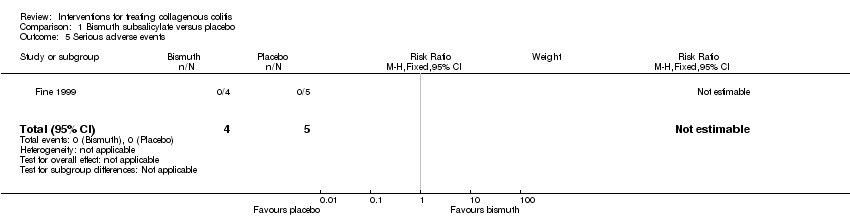
Comparison 1 Bismuth subsalicylate versus placebo, Outcome 5 Serious adverse events.

Comparison 2 Boswellia serrata extract versus placebo, Outcome 1 Clinical response.

Comparison 2 Boswellia serrata extract versus placebo, Outcome 2 Adverse events.

Comparison 2 Boswellia serrata extract versus placebo, Outcome 3 Withdrawals due to adverse events.

Comparison 3 Budesonide versus mesalazine, Outcome 1 Clinical response.
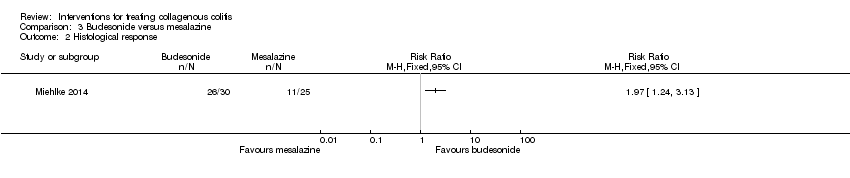
Comparison 3 Budesonide versus mesalazine, Outcome 2 Histological response.
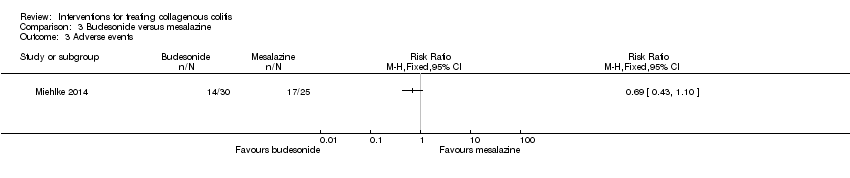
Comparison 3 Budesonide versus mesalazine, Outcome 3 Adverse events.

Comparison 3 Budesonide versus mesalazine, Outcome 4 Withdrawals due to adverse events.

Comparison 3 Budesonide versus mesalazine, Outcome 5 Serious adverse events.

Comparison 4 Mesalamine versus placebo, Outcome 1 Clinical response.
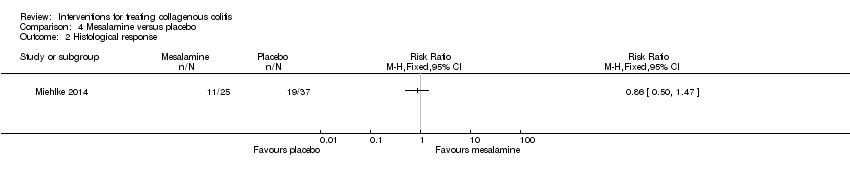
Comparison 4 Mesalamine versus placebo, Outcome 2 Histological response.

Comparison 4 Mesalamine versus placebo, Outcome 3 Adverse events.
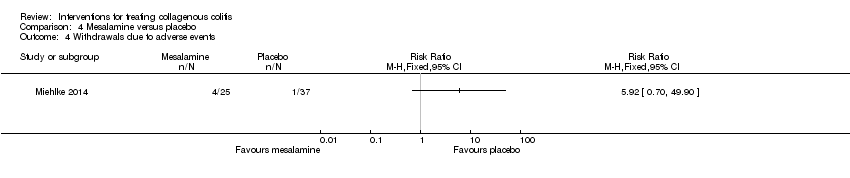
Comparison 4 Mesalamine versus placebo, Outcome 4 Withdrawals due to adverse events.

Comparison 4 Mesalamine versus placebo, Outcome 5 Serious adverse events.

Comparison 5 Mesalazine vs. mesalazine + cholestyramine, Outcome 1 Clinical response.
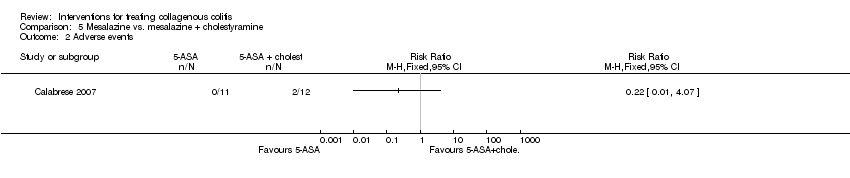
Comparison 5 Mesalazine vs. mesalazine + cholestyramine, Outcome 2 Adverse events.

Comparison 6 Prednisolone versus placebo, Outcome 1 Clinical response.

Comparison 6 Prednisolone versus placebo, Outcome 2 Withdrawals due to adverse events.

Comparison 7 Probiotics versus placebo, Outcome 1 Clinical response.

Comparison 7 Probiotics versus placebo, Outcome 2 Adverse events.

Comparison 7 Probiotics versus placebo, Outcome 3 Withdrawals due to adverse events.
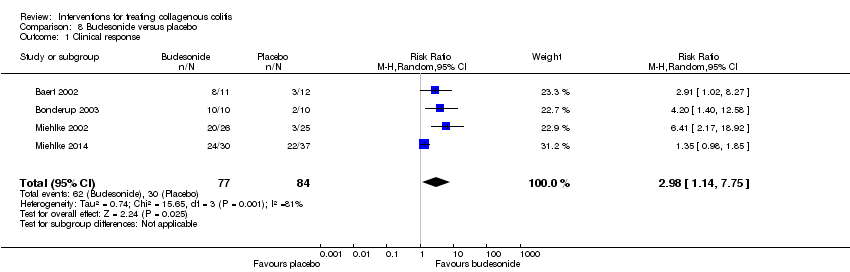
Comparison 8 Budesonide versus placebo, Outcome 1 Clinical response.

Comparison 8 Budesonide versus placebo, Outcome 2 Clinical response sensitivity analysis excluding Miehlke 2014.

Comparison 8 Budesonide versus placebo, Outcome 3 Histological response.

Comparison 8 Budesonide versus placebo, Outcome 4 Histological response sensitivity analysis excluding Miehlke 2014.

Comparison 8 Budesonide versus placebo, Outcome 5 Maintenance of clinical response.
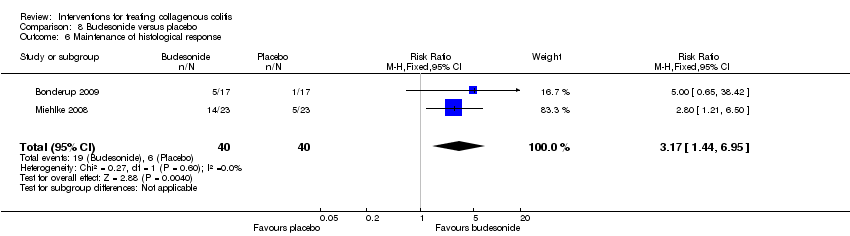
Comparison 8 Budesonide versus placebo, Outcome 6 Maintenance of histological response.

Comparison 8 Budesonide versus placebo, Outcome 7 Adverse events.
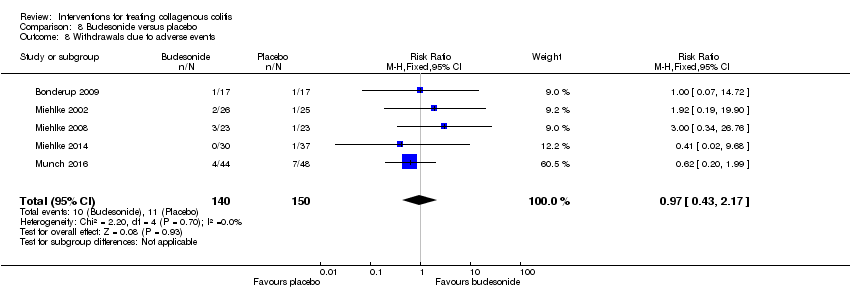
Comparison 8 Budesonide versus placebo, Outcome 8 Withdrawals due to adverse events.

Comparison 8 Budesonide versus placebo, Outcome 9 Serious adverse events.
| Bismuth subsalicylate versus placebo for treating collagenous colitis | ||||||
| Patient or population: Patients with collagenous colitis | ||||||
| Outcomes | Anticipated absolute effects* (95% CI) | Relative effect | № of participants | Quality of the evidence | Comments | |
| Risk with placebo | Risk with Bismuth subsalicylate | |||||
| Clinical response | 0 per 10001 | 0 per 1000 | RR 10.80 | 9 | ⊕⊝⊝⊝ | |
| Histological response | 0 per 10001 | 0 per 1000 | RR 10.80 | 9 | ⊕⊝⊝⊝ | |
| *The risk in the intervention group (and its 95% confidence interval) is based on the assumed risk in the comparison group and the relative effect of the intervention (and its 95% CI). | ||||||
| GRADE Working Group grades of evidence | ||||||
| 1 Control group risk comes from control arm of the included study. | ||||||
| Boswellia serrata extract versus placebo for treating collagenous colitis | ||||||
| Patient or population: Patients with collagenous colitis | ||||||
| Outcomes | Anticipated absolute effects* (95% CI) | Relative effect | № of participants | Quality of the evidence | Comments | |
| Risk with placebo | Risk with Boswellia serrata extract | |||||
| Clinical response | 267 per 10001 | 437 per 1000 | RR 1.64 | 31 | ⊕⊕⊝⊝ | |
| Adverse events | 67 per 10001 | 125 per 1000 | RR 1.88 | 31 | ⊕⊕⊝⊝ | |
| Withdrawals due to adverse events | 0 per 10001 | 0 per 1000 | RR 2.82 | 31 | ⊕⊕⊝⊝ | |
| *The risk in the intervention group (and its 95% confidence interval) is based on the assumed risk in the comparison group and the relative effect of the intervention (and its 95% CI). | ||||||
| GRADE Working Group grades of evidence | ||||||
| 1 Control group risk comes from control arm of the included study. | ||||||
| Budesonide versus mesalazine for treating collagenous colitis | ||||||
| Patient or population: Patients with collagenous colitis | ||||||
| Outcomes | Anticipated absolute effects* (95% CI) | Relative effect | № of participants | Quality of the evidence | Comments | |
| Risk with mesalazine | Risk with Budesonide | |||||
| Clinical response | 440 per 10001 | 801 per 1000 | RR 1.82 | 55 | ⊕⊕⊝⊝ | |
| Histological response | 440 per 10001 | 867 per 1000 | RR 1.97 | 55 | ⊕⊕⊝⊝ | |
| Adverse events | 680 per 10001 | 469 per 1000 | RR 0.69 | 55 | ⊕⊕⊝⊝ | |
| Withdrawals due to adverse events | 160 per 10001 | 14 per 1000 | RR 0.09 | 55 | ⊕⊕⊝⊝ | |
| Serious adverse events | 120 per 10001 | 14 per 1000 | RR 0.12 | 55 | ⊕⊕⊝⊝ | |
| *The risk in the intervention group (and its 95% confidence interval) is based on the assumed risk in the comparison group and the relative effect of the intervention (and its 95% CI). | ||||||
| GRADE Working Group grades of evidence | ||||||
| 1 Control group risk comes from control arm of the included study. | ||||||
| Mesalamine versus placebo for treating collagenous colitis | ||||||
| Patient or population: Patients with collagenous colitis | ||||||
| Outcomes | Anticipated absolute effects* (95% CI) | Relative effect | № of participants | Quality of the evidence | Comments | |
| Risk with placebo | Risk with Mesalamine | |||||
| Clinical response | 595 per 10001 | 440 per 1000 | RR 0.74 | 62 | ⊕⊕⊝⊝ | |
| Histological response | 514 per 10001 | 442 per 1000 | RR 0.86 | 62 | ⊕⊕⊝⊝ | |
| Adverse events | 541 per 10001 | 681 per 1000 | RR 1.26 | 62 | ⊕⊕⊝⊝ | |
| Withdrawals due to adverse events | 27 per 10001 | 160 per 1000 | RR 5.92 | 62 | ⊕⊕⊝⊝ | |
| Serious adverse events | 27 per 10001 | 120 per 1000 | RR 4.44 | 62 | ⊕⊕⊝⊝ | |
| *The risk in the intervention group (and its 95% confidence interval) is based on the assumed risk in the comparison group and the relative effect of the intervention (and its 95% CI). | ||||||
| GRADE Working Group grades of evidence | ||||||
| 1 Control group risk comes from control arm of the included study. | ||||||
| Mesalazine vs. mesalazine + cholestyramine for treating collagenous colitis | ||||||
| Patient or population: Patients with collagenous colitis | ||||||
| Outcomes | Anticipated absolute effects* (95% CI) | Relative effect | № of participants | Quality of the evidence | Comments | |
| Risk with mesalazine + cholestyramine | Risk with Mesalazine | |||||
| Clinical response | 167 per 10001 | 123 per 1000 | RR 0.74 | 23 | ⊕⊝⊝⊝ | |
| Adverse events | 0 per 10001 | 0 per 1000 | RR 0.22 | 23 | ⊕⊝⊝⊝ | |
| *The risk in the intervention group (and its 95% confidence interval) is based on the assumed risk in the comparison group and the relative effect of the intervention (and its 95% CI). | ||||||
| GRADE Working Group grades of evidence | ||||||
| 1 Control group risk comes from control arm of the included study. | ||||||
| Prednisolone versus placebo for treating collagenous colitis | ||||||
| Patient or population: Patients with collagenous colitis | ||||||
| Outcomes | Anticipated absolute effects* (95% CI) | Relative effect | № of participants | Quality of the evidence | Comments | |
| Risk with placebo | Risk with Prednisolone | |||||
| Clinical response | 0 per 10001 | 0 per 1000 | RR 4.89 | 11 | ⊕⊝⊝⊝ | |
| *The risk in the intervention group (and its 95% confidence interval) is based on the assumed risk in the comparison group and the relative effect of the intervention (and its 95% CI). | ||||||
| GRADE Working Group grades of evidence | ||||||
| 1 Control group risk comes from control arm of the included study. | ||||||
| Probiotics versus placebo for treating collagenous colitis | ||||||
| Patient or population: Patients with collagenous colitis | ||||||
| Outcomes | Anticipated absolute effects* (95% CI) | Relative effect | № of participants | Quality of the evidence | Comments | |
| Risk with placebo | Risk with Probiotics | |||||
| Clinical response | 125 per 10001 | 286 per 1000 | RR 2.29 | 29 | ⊕⊝⊝⊝ | |
| Adverse events | 500 per 10001 | 285 per 1000 | RR 0.57 | 29 | ⊕⊝⊝⊝ | |
| *The risk in the intervention group (and its 95% confidence interval) is based on the assumed risk in the comparison group and the relative effect of the intervention (and its 95% CI). | ||||||
| GRADE Working Group grades of evidence | ||||||
| 1 Control group risk comes from control arm of the included study. | ||||||
| Budesonide versus placebo for treating collagenous colitis | ||||||
| Patient or population: Patients with collagenous colitis | ||||||
| Outcomes | Anticipated absolute effects* (95% CI) | Relative effect | № of participants | Quality of the evidence | Comments | |
| Risk with placebo | Risk with Budesonide | |||||
| Clinical response sensitivity analysis excluding Miehlke 2014 | 170 per 10001 | 722 per 1000 | RR 4.56 (2.43 to 8.55) | 94 | ⊕⊕⊝⊝ | |
| Histological response sensitivity analysis excluding Miehlke 2014 | 170 per 10001 | 706 per 1000 | RR 4.15 (2.25 to 7.66) | 94 | ⊕⊕⊝⊝ | |
| Maintenance of clinical response | 205 per 10001 | 675 per 1000 | RR 3.30 | 172 | ⊕⊕⊝⊝ | |
| Maintenance of histological response | 150 per 10001 | 476 per 1000 | RR 3.17 | 80 | ⊕⊝⊝⊝ | |
| Adverse events | 420 per 10001 | 496 per 1000 | RR 1.18 | 290 | ⊕⊕⊕⊝ | |
| Withdrawals due to adverse events | 73 per 10001 | 71 per 1000 | RR 0.97 | 290 | ⊕⊕⊝⊝ | |
| Serious adverse events | 11 per 10001 | 12 per 1000 | RR 1.11 | 175 | ⊕⊕⊝⊝ | |
| *The risk in the intervention group (and its 95% confidence interval) is based on the assumed risk in the comparison group and the relative effect of the intervention (and its 95% CI). | ||||||
| GRADE Working Group grades of evidence | ||||||
| 1 Control group risk comes from control arm of meta‐analysis, based on included trials. | ||||||
| Therapy | References |
| 5‐ASA compounds | Weidner 1984, Farah 1985, Giardiello 1987, Wang 1987, Jessurun 1987, Eckstein 1988, Mason 1988, Rokkas 1988, O'Mahony 1990, Gubbins 1991, Giardiello 1991, Carpenter 1992, Fasoli 1994, Katanuma 1995, Bohr 1996, Goff 1997, Mullhaupt 1998, Wang 1999, Bonner 2000, Fielder 2001, Pardi 2001, Kimble 2001, Bozdech 2001, Abdo 2002, Fernandez 2003, Honkoop 2003, Randall 2003, Buchman 2004, Mowat 2005, Fekih 2006, Roe 2006, Madisch 2006, Narvaez 2006, de la Iglesia 2007, Ekiz 2007, Freeman 2007, Koch 2007, Halsey 2007, Rubio‐Tapia 2007 |
| Antibiotics | Mogensen 1984, Wang 1987, Puri 1994, Pimental 1995, Bohr 1996, Mullhaupt 1998, Swensson 1999, Honkoop 2001, Madisch 2006 |
| Antihistamine | Benchimol 2007 |
| Azathioprine/6‐mercaptopurine | Goff 1997, Pardi 2001, Roe 2006, Wickbom 2006 |
| Bismuth subsalicylate | Girard 1987, Fine 1998, Bohr 1999, Bozdech 2001, Buchman 2004, Madisch 2006, Chande 2007, Rubio‐Tapia 2007 |
| Budesonide | Van Gossum 1998, Delarive 1998, Lanyi 1999, Tromm 1999, Bohr 1999, Mueller‐Wittlic 2000, Bajor 2003, Fernandez 2003, Honkoop 2003, Buchman 2004, Hawkins 2004, Barta 2005, Bajor 2006, Roe 2006, Wickbom 2006, Freeman 2006, Hilmer 2006, Chopra 2006, Kiesslich 2006, de la Iglesia 2007, Freeman 2007, Brar 2007 |
| Cholestyramine/colestipol | Andersen 1993, Bohr 1996, Ung 2000, Fernandez 2003, Baert 2004, Mahmoud 2005, Hilmer 2006 |
| Cyclosporine | Eijsbouts 1995, Roe 2006 |
| Dietary modification | Fekih 2006 |
| Elemental diet | Teahon 1994 |
| Ketotifen | Marshall 1998, Benchimol 2007 |
| Methotrexate | Bhullar 1996, Hillman 2001, Riddell 2007 |
| Octreotide | Fisher 1996, Goff 1997 |
| Pentoxifylline | Peterson 1996, Williams 1998 |
| Probiotics | Tromm 2004 |
| Steroids, intravenous | Pardi 2001, Buchman 2004 |
| Steroids, oral | Palmer 1986, Hamilton 1986, Giardiello 1987, Wang 1987, Jessurun 1987, O'Mahony 1990, Sloth 1991, Giardiello 1991, Carpenter 1992, Fasoli 1994, Pimental 1995, Katanuma 1995, Bohr 1996, Goff 1997, Duncan 1997, Wang 1999, Castellano 1999, Swensson 1999, Bonner 2000, Fielder 2001, Persoz 2001, Honkoop 2001, Abdo 2002, Fernandez 2003, Honkoop 2003, Buchman 2004, Mowat 2005, O'Beirne 2005, Taha 2006, Madisch 2006, Narvaez 2006, Rubio‐Tapia 2007 |
| Steroids, topical | Wang 1987, Mason 1988 |
| Surgery | Jarnerot 1995, Alikhan 1997, Munch 2005, Shen 2006, Davis 2007 |
| Symptomatic therapy: antidiarrheal agents, bulking agents, spasmolytics | Bamford 1982, Eaves 1983, Giardiello 1987, Wang 1987, Gubbins 1991, Pimental 1995, Katanuma 1995, Bohr 1996, Goff 1997, Mullhaupt 1998, Wang 1999, Fielder 2001, Abdo 2002, Honkoop 2003, Mowat 2005, Smith 2005, Fekih 2006, Hilmer 2006, Madisch 2006, Ekiz 2007, Khawaja 2007, Halsey 2007 |
| Verapamil | Scheidler 2001 |
| Outcome or subgroup title | No. of studies | No. of participants | Statistical method | Effect size |
| 1 Clinical response Show forest plot | 1 | Risk Ratio (M‐H, Fixed, 95% CI) | Totals not selected | |
| 2 Histological response Show forest plot | 1 | Risk Ratio (M‐H, Fixed, 95% CI) | Totals not selected | |
| 3 Adverse events Show forest plot | 1 | 9 | Risk Ratio (M‐H, Fixed, 95% CI) | 0.0 [0.0, 0.0] |
| 4 Withdrawals due to adverse events Show forest plot | 1 | 9 | Risk Ratio (M‐H, Fixed, 95% CI) | 0.0 [0.0, 0.0] |
| 5 Serious adverse events Show forest plot | 1 | 9 | Risk Ratio (M‐H, Fixed, 95% CI) | 0.0 [0.0, 0.0] |
| Outcome or subgroup title | No. of studies | No. of participants | Statistical method | Effect size |
| 1 Clinical response Show forest plot | 1 | Risk Ratio (M‐H, Fixed, 95% CI) | Totals not selected | |
| 2 Adverse events Show forest plot | 1 | Risk Ratio (M‐H, Fixed, 95% CI) | Totals not selected | |
| 3 Withdrawals due to adverse events Show forest plot | 1 | Risk Ratio (M‐H, Fixed, 95% CI) | Totals not selected | |
| Outcome or subgroup title | No. of studies | No. of participants | Statistical method | Effect size |
| 1 Clinical response Show forest plot | 1 | Risk Ratio (M‐H, Fixed, 95% CI) | Totals not selected | |
| 2 Histological response Show forest plot | 1 | Risk Ratio (M‐H, Fixed, 95% CI) | Totals not selected | |
| 3 Adverse events Show forest plot | 1 | Risk Ratio (M‐H, Fixed, 95% CI) | Totals not selected | |
| 4 Withdrawals due to adverse events Show forest plot | 1 | Risk Ratio (M‐H, Fixed, 95% CI) | Totals not selected | |
| 5 Serious adverse events Show forest plot | 1 | Risk Ratio (M‐H, Fixed, 95% CI) | Totals not selected | |
| Outcome or subgroup title | No. of studies | No. of participants | Statistical method | Effect size |
| 1 Clinical response Show forest plot | 1 | Risk Ratio (M‐H, Fixed, 95% CI) | Totals not selected | |
| 2 Adverse events Show forest plot | 1 | Risk Ratio (M‐H, Fixed, 95% CI) | Totals not selected | |
| Outcome or subgroup title | No. of studies | No. of participants | Statistical method | Effect size |
| 1 Clinical response Show forest plot | 1 | Risk Ratio (M‐H, Fixed, 95% CI) | Totals not selected | |
| 2 Withdrawals due to adverse events Show forest plot | 1 | Risk Ratio (M‐H, Fixed, 95% CI) | Totals not selected | |
| Outcome or subgroup title | No. of studies | No. of participants | Statistical method | Effect size |
| 1 Clinical response Show forest plot | 1 | Risk Ratio (M‐H, Fixed, 95% CI) | Totals not selected | |
| 2 Adverse events Show forest plot | 1 | Risk Ratio (M‐H, Fixed, 95% CI) | Totals not selected | |
| 3 Withdrawals due to adverse events Show forest plot | 1 | Risk Ratio (M‐H, Fixed, 95% CI) | Totals not selected | |
| Outcome or subgroup title | No. of studies | No. of participants | Statistical method | Effect size |
| 1 Clinical response Show forest plot | 4 | 161 | Risk Ratio (M‐H, Random, 95% CI) | 2.98 [1.14, 7.75] |
| 2 Clinical response sensitivity analysis excluding Miehlke 2014 Show forest plot | 3 | 94 | Risk Ratio (M‐H, Fixed, 95% CI) | 4.56 [2.43, 8.55] |
| 3 Histological response Show forest plot | 4 | 161 | Risk Ratio (M‐H, Random, 95% CI) | 2.68 [1.37, 5.24] |
| 4 Histological response sensitivity analysis excluding Miehlke 2014 Show forest plot | 3 | 94 | Risk Ratio (M‐H, Fixed, 95% CI) | 4.15 [2.25, 7.66] |
| 5 Maintenance of clinical response Show forest plot | 3 | 172 | Risk Ratio (M‐H, Fixed, 95% CI) | 3.30 [2.13, 5.09] |
| 6 Maintenance of histological response Show forest plot | 2 | 80 | Risk Ratio (M‐H, Fixed, 95% CI) | 3.17 [1.44, 6.95] |
| 7 Adverse events Show forest plot | 5 | 290 | Risk Ratio (M‐H, Fixed, 95% CI) | 1.18 [0.92, 1.51] |
| 8 Withdrawals due to adverse events Show forest plot | 5 | 290 | Risk Ratio (M‐H, Fixed, 95% CI) | 0.97 [0.43, 2.17] |
| 9 Serious adverse events Show forest plot | 4 | 175 | Risk Ratio (M‐H, Fixed, 95% CI) | 1.11 [0.15, 8.01] |