Intervenciones para mejorar las prácticas de prescripción de antibióticos en pacientes hospitalizados
Resumen
Antecedentes
La resistencia a los antibióticos es un problema significativo para la salud pública. Las infecciones causadas por bacterias con farmacorresistencia múltiple se asocian con una estancia hospitalaria prolongada y muerte en comparación con las infecciones causadas por las bacterias sensibles. El uso de antibióticos apropiados en los hospitales debe asegurar el tratamiento efectivo de los pacientes con infección y reducir prescripciones innecesarias. Se actualizó esta revisión sistemática para evaluar la repercusión de las intervenciones y mejorar la prescripción de antibióticos en pacientes hospitalizados.
Objetivos
Calcular la efectividad y la seguridad de las intervenciones para mejorar la prescripción de antibióticos a pacientes hospitalizados e investigar el efecto de dos funciones de las intervenciones: la restricción y la facilitación.
Métodos de búsqueda
Se hicieron búsquedas en el Registro Cochrane Central de Ensayos Controlados (Cochrane Central Register of Controlled Trials) (CENTRAL) (the Cochrane Library), MEDLINE y en Embase. Se buscaron estudios adicionales utilizando las bibliografías de los artículos incluidos y archivos personales. La última búsqueda a partir de la que se evaluaron los registros y se incorporaron a la revisión los estudios identificados fue enero de 2015.
Criterios de selección
Se incluyeron ensayos controlados aleatorios (ECA) y estudios no aleatorios (ENA). Se incluyeron tres diseños de estudio no aleatorios para medir los resultados conductuales y clínicos y analizar la variación en los efectos: ensayos no aleatorios (ENA), estudios controlados de antes y después (ECAD) y estudios de series de tiempo interrumpido (STI). Para esta actualización también se incluyeron tres diseños adicionales de ENA (estudios de control de casos, cohortes y cualitativos) para identificar las consecuencias imprevistas. Las intervenciones comprendían los tipos profesionales o estructurales definidos por el Grupo Cochrane para una Práctica y Organización Sanitaria Efectiva. La restricción se definió como "el uso de reglas para reducir la oportunidad de incurrir en la conducta estudiada (o aumentar la conducta estudiada mediante la reducción de la oportunidad para incurrir en conductas contrapuestas)". La facilitación se definió como "el aumento de los medios y la reducción de las barreras para aumentar la capacidad o la oportunidad". La principal comparación fue entre intervención y no intervención.
Obtención y análisis de los datos
Dos autores de la revisión extrajeron los datos y evaluaron el riesgo de sesgo de los estudios. Se realizó el metanálisis y la metarregresión de ECA y la metarregresión de los estudios de STI. Se clasificaron las funciones de cambio de conducta para todas las intervenciones de la revisión, incluidos los estudios de las versiones publicadas anteriormente. Se analizaron los datos dicotómicos con una diferencia de riesgos (DR). Se evaluó la confiabilidad de las pruebas con los criterios GRADE.
Resultados principales
Esta revisión incluye 221 estudios (58 ECA y 163 ENA). La mayoría de los estudios fueron de América del Norte (96) o Europa (87). Los estudios restantes fueron de Asia (19), Sudamérica (8), Australia (8) y Asia oriental (3). Aunque el riesgo de sesgo de un 62% de ECA fue alto, los hallazgos para los resultados principales de la revisión fueron similares cuando se restringió el análisis a los estudios con bajo riesgo de sesgo.
Más pacientes hospitalizados fueron tratados según la política de prescripción de antibióticos con la intervención en comparación con ninguna intervención sobre la base de 29 ECA de intervenciones de facilitación en su mayoría (DR 15%; intervalo de confianza [IC] del 95%: 14% a 16%; 23 394 participantes; pruebas de confiabilidad alta). Lo anterior representa un aumento de un 43% a un 58%. Hubo altos niveles de heterogeneidad del tamaño del efecto pero la dirección favoreció a la intervención de una manera constante.
La duración del tratamiento con antibióticos disminuyó de 11 a 1,95 días (IC del 95%: 2,22 a 1,67; 14 ECA; 3318 participantes; pruebas de confiabilidad alta). La información de los estudios no aleatorios mostró que las intervenciones se asocian con una mejoría en las prescripciones, según la política de antibióticos en la práctica clínica de rutina, con un 70% de intervenciones hospitalarias de en comparación con un 31% de ECA. El riesgo de muerte fue similar entre los grupos de intervención y control (11% en ambos brazos), lo que indica que es probable que la administración de antibióticos se reduzca sin afectar negativamente la mortalidad (DR 0%; IC del 95%: ‐1% a 0%; 28 ECA; 15 827 participantes; pruebas de confiabilidad moderada). Las intervenciones de control de antibióticos probablemente reduzcan la estancia hospitalaria en 1,12 días (IC del 95%: 0,7 a 1,54 días; 15 ECA; 3834 participantes; pruebas de confiabilidad moderada). Un ECA y seis ENA plantearon inquietudes de que las intervenciones restrictivas pueden llevar a un retraso en el tratamiento y a una cultura profesional negativa por el deterioro en la comunicación y la confianza entre los infectólogos y los equipos clínicos (pruebas de confiabilidad baja).
Tanto la facilitación como la restricción se asociaron de forma independiente con un mayor cumplimiento de las políticas de los antibióticos, y la facilitación mejoró el efecto de las intervenciones restrictivas (pruebas de confiabilidad alta). Las intervenciones de facilitación que incluyeron sugerencias fueron probablemente más efectivas que las que no incluyeron ninguna interacción (pruebas de confiabilidad moderada).
Había pruebas de muy baja confiabilidad acerca del efecto de las intervenciones sobre la reducción de las infecciones por Clostridium difficile (mediana ‐48,6%; rango intercuartil ‐80,7% a ‐19,2%; siete estudios). Éste también fue el caso para las bacterias gramnegativas resistentes (mediana ‐12,9%; rango intercuartil ‐35,3% a 25,2%; 11 estudios) y las bacterias grampositivas resistentes (mediana ‐19,3%; rango intercuartil ‐50,1% a 23,1%; nueve estudios). Había demasiada varianza en los resultados microbianos para evaluar confiablemente el efecto del cambio en el uso de antibióticos.
Heterogeneidad del efecto de las intervenciones sobre los resultados de prescripción
Se analizaron los modificadores del efecto en 29 ECA y 91 estudios de STI. La facilitación y la restricción se asociaron de forma independiente con un tamaño más grande del efecto (pruebas de confiabilidad alta). Se incluyeron las sugerencias en 4 (17%) de 23 ECA y 20 (47%) de 43 estudios con intervenciones de facilitación, y se asociaron con un mayor efecto de la intervención. La facilitación se incluyó en 13 (45%) de 29 estudios de STI con intervenciones restrictivas y el efecto de intervención mejorado.
Conclusiones de los autores
Se encontraron pruebas de confiabilidad alta de que las intervenciones son efectivas para aumentar el cumplimiento de la política de antibióticos y reducir la duración del tratamiento con antibióticos. El menor uso de antibióticos probablemente no aumente la mortalidad y quizás reduzca la estancia hospitalaria. Es poco probable que más ensayos que comparan el control de antibióticos con ninguna intervención cambien las conclusiones. La facilitación aumentó sistemáticamente el efecto de las intervenciones, como las que incluían un componente restrictivo. Aunque las sugerencias aumentaron adicionalmente el efecto de la intervención, se usaron en sólo una minoría de intervenciones de facilitación. Las intervenciones fueron exitosas en cuanto a la reducción segura del uso innecesario de antibióticos en los hospitales, a pesar de que la mayoría no usó las técnicas de cambio de conducta más efectivas. En consecuencia, la difusión efectiva de los resultados podría tener una repercusión considerable en las políticas y los servicios de salud. En cambio, la investigación futura debe centrarse en los objetivos del tratamiento y la evaluación de otras medidas de seguridad del paciente, evaluar las diferentes intervenciones de control y explorar las barreras y los facilitadores de la implementación. Se requiere más investigación sobre las consecuencias imprevistas de las intervenciones restrictivas.
PICO
Resumen en términos sencillos
Mejora de la prescripción de antibióticos por parte de médicos que trabajan en ámbitos hospitalarios
Objetivo de la revisión
El objetivo de esta revisión Cochrane fue buscar maneras de mejorar la prescripción de antibióticos por parte de médicos en ámbitos hospitalarios. Se recopilaron y analizaron todos los estudios relevantes para responder a esta pregunta y se encontraron 221 estudios.
Mensajes clave
La aplicación de una política de antibióticos resulta en una mejoría de las prácticas de prescripción y reduce la duración del tratamiento con antibióticos.
Las intervenciones orientadas a los médicos para mejorar las prácticas de prescripción de antibióticos redujeron la estancia hospitalaria de los pacientes en 1,12 días (resultados de 15 estudios) y no aumentaron el riesgo de muerte (resultados de 29 estudios). Las intervenciones que brindaron asesoramiento o sugerencias a los médicos fueron más efectivas para mejorar las prácticas de prescripción que las intervenciones que no brindaron esta información. Las pruebas de siete estudios plantearon inquietudes de que con las intervenciones que aplican reglas para hacer que los médicos prescriban de una manera adecuada hubo retrasos en el tratamiento y un deterioro en la confianza entre los infectólogos y los equipos clínicos.
¿Qué se estudió en la revisión?
Los antibióticos se usan para tratar las infecciones bacterianas, como la neumonía. Muchas bacterias se han tornado resistentes a los antibióticos con el transcurso del tiempo. La resistencia a los antibióticos es un grave problema para los pacientes y los sistemas de asistencia sanitaria porque las infecciones causadas por bacterias resistentes a los antibióticos pueden llevar a tasas mayores de muerte y estancias hospitalarias más prolongadas. La resistencia bacteriana con frecuencia es consecuencia del uso innecesario de los antibióticos. Los estudios han mostrado que en cerca de la mitad de los casos los médicos de los hospitales no prescriben antibióticos de forma adecuada.
Se investigó la efectividad y la seguridad de las intervenciones para ayudar a los médicos a que prescriban los antibióticos de una manera adecuada y las técnicas del cambio de conducta que podrían influir en el éxito de las intervenciones.
Resultados clave
Se encontraron 221 estudios relevantes. Noventa y seis estudios fueron de América del Norte. Los restantes 125 estudios fueron de Europa (87), Asia (19), América del Sur (8), Australia (8) y Asia oriental (3). Los estudios analizaron las intervenciones, clasificadas de manera general en dos categorías: las técnicas restrictivas, que aplican reglas para hacer que los médicos prescriban de una manera adecuada, y las técnicas de facilitación, que brindan asesoramiento o sugerencias a los médicos para ayudarlos a prescribir de forma apropiada.
Se encontraron pruebas de confiabilidad alta de que las intervenciones llevan a que más pacientes hospitalizados reciban el tratamiento apropiado para la enfermedad según las políticas de prescripción de antibióticos. Se encontraron pruebas de confiabilidad moderada de que las intervenciones reducen la duración de la estancia hospitalaria sin aumentar la mortalidad. Tanto las técnicas de restricción como las de facilitación fueron exitosas en lograr la efectividad de la intervención. No se necesitan más estudios para responder la pregunta de si estas intervenciones reducen la administración innecesaria de antibióticos, pero se necesita más investigación para comprender las consecuencias imprevistas del uso de intervenciones restrictivas.
Las intervenciones fueron exitosas en reducir de una manera segura la administración innecesaria de antibióticos en los hospitales, a pesar de que la mayoría no usó una técnica de cambio de conductas de adopción amplia, que consiste en revisar y comentar el desempeño. La comunicación efectiva de los resultados de la revisión podría tener una repercusión considerable en las políticas y los servicios de salud.
¿Cuál es el grado de actualización de la revisión?
Se buscaron estudios publicados hasta enero de 2015.
Conclusiones de los autores
Summary of findings
| Patient or population: adults or children undergoing inpatient antibiotic prophylaxis or treatment Settings: mainly high‐income countries (North America or Western Europe) Intervention: any intervention targeting healthcare professionals that aimed to improve antibiotic prescribing to hospital inpatients Comparison: usual care (varied across studies) | |||||
| Effectiveness: prescribing outcomes from RCTs | |||||
| Outcomes | Absolute effect* | No of participants (No of studies) | Certainty of the evidence (GRADE) | Comments | |
| Without intervention | With intervention | ||||
| Proportion of participants who were treated according to antibiotic prescribing guidelines Follow‐up to end of study | 43 per 100 | 58 per 100 | 23,394 participants (29 RCTs) | ⊕⊕⊕⊕ | We have graded the certainty of evidence as high because heterogeneity was explained by prespecified effect modifiers (see below). The intervention effect varied between the studies, but the direction of effect was consistent. Restricting the analysis to studies at low risk of bias gave a similar result (RD 11%, 95% CI 10% to 12%). |
| Difference: 15 more participants per 100 (95% CI 15 to 23) received appropriate treatment following intervention. | |||||
| Duration of all antibiotic treatment | 11.0 days | 9.1 days | 3318 participants (14 RCTs) | ⊕⊕⊕⊕ | |
| Difference: 1.95 fewer days per participant (95% CI 2.22 to 1.67) | |||||
| Mortality Follow‐up to end of study | 11 per 100 | 11 per 100 | 15,827 participants 28 (RCTs) | ⊕⊕⊕⊝1 | Mortality and length of stay were measured to determine the impact of reduced antibiotic use on clinical outcomes. The results were similar for studies that targeted antibiotic choice or exposure. Only 1 of the interventions in the RCTs with mortality or length‐of‐stay outcomes had a restrictive component (Singh 2000). This evidence is therefore at high risk of indirectness because 7 studies in the next section of the table (see below) raise concerns about the safety of restrictive interventions. Moreover, the ITS studies showed that restrictive components were included in 42 (34%) of 123 hospital interventions. |
| Difference: 0 more deaths per 100 participants (95% CI 1 to 0 fewer) | |||||
| Mean length of hospital stay per participant | 12.9 days | 11.8 days | 3834 participants 15 (RCTs) | ⊕⊕⊕⊝1 | |
| Difference: 1.1 fewer days per participant (95% CI 1.5 to 0.7 fewer) | |||||
| Delay in treatment | Restrictive interventions increased the risk of delay in all 3 studies. The risk to patients resulted in termination of the RCT by the Trial Monitoring Committee. | 1 RCT, 2 cohort | ⊕⊕⊝⊝2 | The evidence from these 7 studies of unintended consequences raises concerns about the directness of the evidence of safety from the 29 RCTs in the previous section of the table (see above). | |
| Negative professional culture | Loss of trust in infection specialists because of failure to record approvals for restricted drugs or provide warning about stopping treatment Misleading or inaccurate information from prescribers in order to meet criteria for restricted drugs. In 1 hospital, misdiagnosis of hospital‐acquired infection was large enough to trigger an outbreak investigation. | 1 case control, 2 cohort, 1 qualitative | ⊕⊕⊖⊖3 | ||
| Effect modifiers (heterogeneity) for immediate effect of intervention on prescribing outcomes: | |||||
| Effect modifier | Adjusted effect in meta‐regression | Number of studies | Certainty of the evidence (GRADE) | Comments | |
| Enablement | 15.12 (8.45 to 21.8) | 29 RCTs | ⊕⊕⊕⊕ | The effect of enablement and restriction is similar in the RCTs and ITS studies. Of the 29 RCTs, only 8 (31%) of interventions were hospital‐wide, the majority being in single units. In contrast, 64 (70%) of the interventions in ITS studies were hospital‐wide. | |
| 12.86 (4.11 to 21.6) | 91 ITS | ||||
| Restriction | 34.91 (13.52 to 56.29) | 29 RCTs | ⊕⊕⊕⊕ | ||
| 24.69 (13.74 to 35.64) | 91 ITS | ||||
| Addition of feedback to enablement | 10.88 (7.16 to 19.32) | 23 RCTs | ⊕⊕⊕⊝2 | Feedback was included in 4 (17%) of 23 RCTs and 20 (47%) of 43 ITS studies with interventions that included enablement. There were not enough interventions with goal setting and action planning to analyse as effect modifiers. | |
| 15.63 (0.56 to 30.70) | 43 ITS | ||||
| Addition of enablement to restriction | 38.36 (18.94 to 57.78) | 29 ITS | ⊕⊕⊖⊖3 | Enablement was included in 13 (45%) of 29 ITS studies with restrictive interventions. | |
| *The risk WITHOUT the intervention is based on the median control group risk across studies. The corresponding risk WITH the intervention (and the 95% confidence interval for the difference) is based on the overall relative effect (and its 95% confidence interval). | |||||
| GRADE Working Group grades of evidence | |||||
| Details of five GRADE criteria for all outcomes from RCTs are in Appendix 2. 1We downgraded the evidence to moderate because of indirectness. | |||||
Antecedentes
Descripción de la afección
La resistencia a los antibióticos es un problema significativo para la salud pública. En comparación con las infecciones causadas por bacterias sensibles, las causadas por bacterias con farmacorresistencia múltiple se asocian con incidencias mayores de mortalidad y una estancia hospitalaria prolongada (de Kraker 2011). La infección por Clostridium difficile (CDI) es otra manifestación del daño secundario causado por la prescripción de antimicrobianos (Davey 2010). Dichas infecciones también se asocian con mayores costos como resultado de la necesidad de utilizar antibióticos más costosos, la estancia hospitalaria prolongada (el principal contribuyente) y los gastos relacionados con la detección y el control, los regímenes de erradicación y los bienes fungibles (guantes, batas y delantales utilizados para prevenir la infección cruzada) (de Kraker 2011). La 5 Year Antimicrobial Resistance Strategy 2013 to 2018 de Reino Unido reconoce la importancia de reducir la prescripción inadecuada de antibióticos (Department of Health 2013), ya que se insinúa que la resistencia a los antibióticos, en gran parte, es consecuencia de las presiones selectivas para su uso y que reducir estas presiones mediante el uso criterioso facilitará el regreso de las bacterias susceptibles o, al menos, impedirá o retrasará el ritmo de aparición de cepas resistentes.
Al mismo tiempo, la sepsis es una causa principal de mortalidad evitable en los hospitales; se calcula que sólo en el Reino Unido hay 100 000 casos por año (NCEPOD 2015).
Descripción de la intervención
Se incluyó cualquier intervención para mejorar la prescripción de antibióticos a los pacientes hospitalizados. El control de los antibióticos tiene dos objetivos: primero, asegurar el tratamiento efectivo de los pacientes con infección, y segundo, disminuir el daño secundario causado por la administración de los antimicrobianos (Davey 2010). En consecuencia el Department of Health's Guidance on Antimicrobial Stewardship del Reino Unido recalca la necesidad del tratamiento urgente de las infecciones graves además de la disminución del uso innecesario de antibióticos (Department of Health 2013). Se compararon intervenciones para cambiar la conducta profesional versus la práctica estándar (ninguna intervención). Las intervenciones se clasificaron de acuerdo a su función de intervención (Michie 2011). La versión anterior de esta revisión indicó que las intervenciones restrictivas presentaron un efecto inmediato mayor sobre la prescripción que las intervenciones que utilizaron educación o persuasión (Davey 2013). Para esta actualización, se identificaron las intervenciones que estaban diseñadas para aumentar la facilitación, definida como “el aumento de los medios y la reducción de las barreras para aumentar la capacidad o la oportunidad” (Michie 2011).
De qué manera podría funcionar la intervención
En esta actualización de la revisión se utilizaron nuevas hojas de extracción de datos para clasificar las funciones de la intervención y para identificar las funciones del cambio de conducta que se utilizan en las intervenciones de la administración cuidadosa de antimicrobianos (Michie 2013). En particular, se evaluó la efectividad relativa de las intervenciones de acuerdo a cómo utilizaron la facilitación y la restricción para cambiar la conducta (Michie 2011). Las intervenciones se dividieron en cuatro grupos: facilitación sin restricción; restricción sin facilitación; tanto facilitación como restricción; y ni facilitación ni restricción.
Por qué es importante realizar esta revisión
Esta revisión es una actualización de Davey 2005 y Davey 2013. Complementa una revisión de las intervenciones para mejorar la prescripción de antibióticos en pacientes ambulatorios (Arnold 2005).
Objetivos
Calcular la efectividad y la seguridad de las intervenciones para mejorar la prescripción de antibióticos en pacientes hospitalizados e investigar el efecto de dos funciones de las intervenciones: la restricción y la facilitación.
Métodos
Criterios de inclusión de estudios para esta revisión
Tipos de estudios
Se incluyeron ensayos controlados aleatorios (ECA) y estudios no aleatorios (ENA). Se incluyeron tres diseños de estudio no aleatorios de ENA para medir los resultados conductuales y clínicos y analizar la variación en los efectos: ensayos no aleatorios (ENA), estudios controlados de antes y después (ECAD) y estudios de series de tiempo interrumpido (STI). Se utilizó la guía de elegibilidad del Grupo Cochrane para una Práctica y Organización Sanitaria Efectiva (EPOC) para los ECAD y los ENA (EPOC 2016). Además, para la evaluación de las consecuencias imprevistas, se incluyeron tres diseños adicionales de ENA (estudios de control de casos, de cohortes y cualitativos) para identificar pruebas adicionales acerca de los efectos y los daños a largo plazo de las intervenciones con objeto de mejorar la posibilidad de generalización de las pruebas de los ECA (Schünemann 2013).
Tipos de participantes
Profesionales de la asistencia sanitaria que prescriben antibióticos a los pacientes hospitalizados que reciben cuidados agudos (incluida la cirugía hospitalaria electiva). Se excluyeron las intervenciones orientadas a residentes de hogares de ancianos u otros ámbitos de atención sanitaria a largo plazo.
Tipos de intervenciones
Se incluyeron intervenciones relevantes a la mejoría de la prescripción de antibióticos según lo descrito en la taxonomía del EPOC (EPOC 2015).
-
Auditoría e informe definidos como cualquier resumen del desempeño clínico en la asistencia sanitaria durante un período de tiempo específico.
-
Educación a través de reuniones o de la distribución de material didáctico.
-
Extensión educacional a través de visitas académicas o la revisión de los pacientes individuales con recomendación para el cambio.
-
Recordatorios proporcionados de forma verbal, en papel, en el ambiente de trabajo (p.ej. carteles o mensajes impresos en el equipo) o en la computadora.
-
Estructural: la influencia en la prescripción de antibióticos del cambio de los registros en papel a los registros computadorizados y de la introducción de nueva tecnología para las pruebas rápidas de microbiología o la medición de los marcadores inflamatorios.
Además, se incluyeron las siguientes intervenciones restrictivas: informe selectivo de las sensibilidades del laboratorio; restricción de formularios; sustitución terapéutica con necesidad de autorización previa (aprobación de expertos); y órdenes con interrupción automática.
Las intervenciones de facilitación fueron: auditoría e informe; extensión educacional a través de la revisión de los pacientes individuales con recomendación para el cambio; y recordatorios circunstanciales dirigidos a los médicos que estaban tratando a pacientes específicos (Tabla 1). Los recordatorios en forma de carteles o tarjetas de bolsillo que resumían las políticas sobre el antibiótico se clasificaron como reestructuración ambiental pero no como facilitador (Tabla 1). Los términos usados para describir las intervenciones se describen de forma más detallada en la sección de Extracción y manejo de los datos.
No se consideraron los estudios que comparaban la efectividad de los tratamientos con antibióticos (p.ej. administración de antibióticos intravenosa versus oral) como aptos para esta revisión.
Tipos de medida de resultado
Resultados primarios
El efecto de las intervenciones sobre la prescripción de antibióticos medido como cumplimiento de las guías o las políticas relacionadas con el antibiótico, la duración del tratamiento con antibióticos, la decisión de realizar el tratamiento, o la duración total del tratamiento. Se incluyeron estudios sin información fidedigna o suficiente que consideraban la medida de resultado primaria, aunque no se utilizaron estos estudios en la síntesis de datos.
Resultados secundarios
Mortalidad, estancia hospitalaria, u otros resultados clínicos (p.ej. infección del sitio quirúrgico o insuficiencia renal aguda), resultados microbianos (CDI, colonización o infección con bacterias resistentes a los antimicrobianos), medidas de las consecuencias imprevistas (p.ej. retraso en el comienzo del tratamiento con antibióticos, un cambio en el umbral para el diagnóstico de infección intrahospitalaria para justificar la práctica de prescripción existente). Debe observarse que los resultados clínicos podrían ser indicadores de una mejoría en los resultados clínicos asociados con las intervenciones para aumentar el tratamiento con antibióticos efectivo, o las consecuencias imprevistas (p.ej. para aportar pruebas acerca de la seguridad de las intervenciones para reducir el tratamiento innecesario con antibióticos).
Results
Description of studies
Results of the search
The combined results of all literature searches are described in the study flow diagram (Figure 1).

Figure 1 Study flow diagram.
Included studies
The Characteristics of included studies table lists 221 studies, of which 211 used the following designs to evaluate the intended effect of interventions: 138 ITS studies, 58 RCTs (14 cluster RCTs), 6 CBAs, and 8 NRTs. The remaining 11 studies were designed to identify unintended consequences of interventions and used the following designs: 8 cohort (Connor 2007; Duvoisin 2014; Friedberg 2009; Kanwar 2007; LaRosa 2007; Linkin 2007; Welker 2008; Winters 2010), 1 case control (Calfee 2003), and 1 qualitative (semi‐structured interviews) (Baysari 2013) and 1 ITS (Bell 2014).
Geographical location of study
Ninety‐six studies were from North America. The remaining 125 were from Europe (87, includes Israel), Asia (19), South America (8), Australia (8), and East Asia (3). The number of studies by country (including the countries in four multinational studies) is: Argentina, 1; Australia, 9; Austria, 2; Belgium, 4; Brazil, 4; Canada, 8; China, 6; Colombia, 2; Croatia, 1; Denmark, 3; France, 11; Germany, 12; Greece, 1; Hong Kong, 1; Hungary, 1; India, 1; Indonesia, 1; Israel, 1; Italy, 3; Japan, 1; Korea, 3; Lebanon, 1; Mexico, 1; Netherlands, 11; Norway, 1; Serbia, 1; Singapore, 1; Spain, 5; Sweden, 2; Switzerland, 11; Taiwan, 3; Thailand, 4; Turkey, 1; UK, 22; USA, 89.
Number of hospitals
A total of 178 (79%) studies were conducted in one hospital, 9 studies in 2 hospitals, 18 studies in 3 to 9 hospitals, and 16 studies in 10 or more hospitals.
Deliverer of intervention
Of the 221 interventions, 112 (51%) were designed and delivered by a multidisciplinary team, 54 (24%) by specialist physicians (infectious diseases or microbiology), 35 (16%) by department physicians (e.g. emergency department or critical care), and 20 (9%) by pharmacists.
Funding
Five studies received some funding from manufacturers of drugs or laboratory tests. The remaining 216 studies were funded by government agencies or the participating hospitals. Details are provided in the Characteristics of included studies table.
Power calculations
Details of power calculations are provided in Appendix 3
Excluded studies
We excluded 32 unique studies from the review because they did not contain relevant or interpretable data (Selection of studies). For details of each study, see Characteristics of excluded studies.
Risk of bias in included studies
All 14 CBAs and NRTs were at high risk of bias (Figure 2). High risk of bias was more common in RCTs (36/58, 62%) than in ITS studies (20/138, 14%) (Figure 2). All 51 studies at low risk of bias were ITS studies (Figure 2). Among RCTs, high risk of bias was much more likely in studies with two or fewer hospitals (31/36, 86%) versus three or more hospitals (11/22, 50%). Of the 11 RCTs with two or fewer hospitals with medium risk of bias, nine interventions were circumstantial reminders targeted at doctors who were managing specific patients (Christ‐Crain 2004; Christ‐Crain 2006; Esposito 2011; Kerremans 2009; Lacroix 2014; Lesprit 2013; Long 2014; Senn 2004; Stocker 2010; Strom 2010), so the risks of allocation or contamination bias were relatively low compared with the other RCTs of interventions in one or two hospitals. However, the remaining two RCTs at low risk of bias show that these risks can be minimised for RCTs of review and recommend change interventions in single hospitals (Lesprit 2013; Palmay 2014).
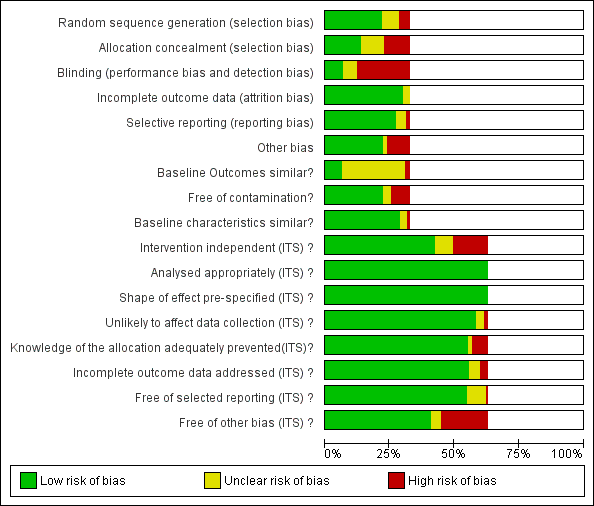
Risk of bias graph: review authors' judgements about each risk of bias item presented as percentages across all included studies.
Blank sections in this graph are due to use of different ROB criteria for CBA, NRT and RCT versus ITS studies
We have presented 'Risk of bias' criteria for the case control and cohort studies of unintended consequences in the Notes section in Characteristics of included studies.. For the nine studies, we assessed the risk of bias as high in two (Calfee 2003; Friedberg 2009), medium in two (Linkin 2007; Welker 2008), and low in five (Connor 2007; Duvoisin 2014; Kanwar 2007; LaRosa 2007; Winters 2010).
Allocation
Most of the RCTs had high risk of selection bias because of problems with concealment of allocation (Figure 2). The RCTs with low risk of selection bias were either cluster RCTs or interventions with circumstantial reminders, for which concealment of allocation is relatively straightforward.
Blinding
Most of the RCTs also had high risk of performance and detection bias because RCTs in single hospitals were often single‐blind and it was difficult to conceal the allocation of participants in these trials (Figure 2).
Incomplete outcome data
The RCTs used data collected specifically for the trial, and all provided convincing evidence about lack of attrition bias. Most of the ITS studies used data from routine systems for prescribing (pharmacy) and microbial (microbiology) outcomes; we assessed these sources as having low risk of attrition bias (Figure 2). Examples of high risk of attrition bias in routine data are changes in the number of participants who did not have serum creatinine measure preoperatively during the study period, which may have biased ascertainment of postoperative kidney injury (Bell 2014), and use of surveillance data about surgical‐site infection that did not include information about infections arising after discharge from hospital (Dua 2014).
Selective reporting
We also assessed routine data systems as being at low risk of reporting bias (Figure 2). Most of the ITS studies used computerised pharmacy systems to measure drug consumption.
Other potential sources of bias
Less than 25% of RCTs provided clear information about baseline outcome; most of these were cluster RCTs (Figure 2). The most common single risk of bias for ITS studies was that the intervention was not independent of other changes (Figure 2). For ITS studies, the main risks of bias were that there were insufficient data to account for seasonal variation or that one or more of the microbial 'Risk of bias' criteria were present (Figure 2).
Effects of interventions
Studies included in evidence synthesis and 'Summary of findings' tables
Outcomes from 49 (84%) of the 58 RCTs and110 (80%) of the 138 ITS studies were used in at least one meta‐analysis or meta‐regression or are summarised in text or Additional tables. The contribution that each RCT made can be found in Appendix 4. One ITS study contributed data about unintended consequences (Bell 2014). The contribution of 109 ITS studies to meta‐regression of prescribing outcomes is summarised in Appendix 5. Reasons for exclusion of 10 RCTs and 28 ITS studies from evidence synthesis can be found in Appendix 6.
The 10 case control, cohort, or qualitative studies of unintended consequences all contributed evidence about adverse effects.
None of the 6 CBAs or 8 NRTs included evidence about adverse effects of interventions, and there were not enough studies for evidence synthesis.
Intended prescribing outcomes for RCTs and ITS studies included in evidence synthesis
Interventions were targeted at antibiotic treatment for 46 (94%) of 49 RCTs and 101 (92%) of 110 ITS studies. The remaining 11 studies targeted surgical antibiotic prophylaxis (Bell 2014; Dull 2008; Gulmezoglu 2007; Kritchevsky 2008; Meyer 2010; Perez 2003; Schwann 2011; Sun 2011; Van Kasteren 2005; Wax 2007; Weinberg 2001).
For the 148 interventions targeted at antibiotic treatment, the intended outcome of 137 (93%) interventions was to decrease excessive use of antibiotics: 45/46 (98%) RCTs and 93/102 (91%) ITS studies. The only RCT that was primarily intended to increase effective treatment targeted dosing of gentamicin (Burton 1991). Two RCTs with antibiotic choice as the primary outcome did include time to first antibiotic dose for participants with community‐acquired pneumonia as a secondary outcome (Schouten 2007; Yealy 2005). The only other evidence about increasing effective treatment of sepsis came from six ITS studies that aimed to reduce time to first antibiotic dose (Barlow 2007; Hitti 2012; Jobson 2015; Marwick 2013; Volpe 2012; Weiner 2009).
In contrast, reduction in excessive use of antibiotics was the intended outcome of only 3 (25%) of the 12 interventions targeted at surgical antibiotic prophylaxis (Bell 2014; Sun 2011; Van Kasteren 2005). The remaining nine interventions were all intended to increase effective use of antibiotics by increasing the number of participants who received prophylaxis or reducing the time to first antibiotic dose.
Effectiveness and adverse effects of interventions
Effectiveness of interventions in RCTs
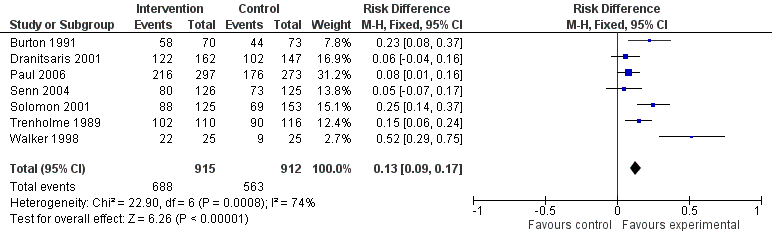
Interventions were associated with an increase in compliance with desired practice by 15% (95% confidence interval (CI) 14% to 16%) in 29 RCTs (Analysis 1.1; Figure 3). We obtained similar results in sensitivity analyses for unit of analysis errors (Analysis 1.2) or risk of bias (Analysis 1.3). Interventions were associated with a reduction in duration of total antibiotic treatment by ‐1.95 days (95% CI ‐2.22 to ‐1.67) in 14 RCTs (Analysis 1.4; Figure 4). We obtained similar results in sensitivity analyses for unit of analysis errors (Analysis 1.5) or risk of bias (Analysis 1.6).

Forest plot of comparison: 1 Prescribing: RCTs of all interventions to reduce unnecessary prescribing, outcome: 1.1 Dichotomous outcomes, increase in desired practice.

Forest plot of comparison: 1 Effectiveness: Prescribing outcomes from RCTs of interventions to reduce unnecessary antibiotic use, outcome: 1.4 Continuous outcomes, duration of all antibiotic treatment (days).
In four RCTs the prescribing outcome was the consumption of targeted antibiotics measured in different units (cost, days, or defined daily dose), so results were expressed as standardised mean reduction (Analysis 1.7.).
Adverse effects of interventions
Evidence from RCTs
Interventions were not associated with any increase in mortality (95% CI 1 to 0 fewer deaths per 100 participants) in 28 RCTs (Analysis 2.1; Figure 5). We obtained similar results in sensitivity analyses for unit of analysis errors (Analysis 2.2) or risk of bias (Analysis 2.3). Interventions were associated with reduction in length of stay by ‐1.12 days (95% CI ‐1.54 to ‐0.70) in 15 RCTs Analysis 2.4; Figure 6). We obtained similar results in sensitivity analyses for unit of analysis errors (Analysis 2.5) or risk of bias (Analysis 2.6). We found no evidence of a difference in results for interventions that targeted antibiotic exposure (decision to treat or duration of all antibiotic treatment) versus the choice of antibiotic prescribed (Analysis 3.1; Analysis 3.2; Analysis 4.1; Analysis 4.2).

Forest plot of comparison: 2 Adverse effects: Clinical outcomes from RCTs of interventions to reduce unnecessary antibiotic use, outcome: 2.1 Mortality, all RCTs.

Forest plot of comparison: 2 Adverse effects: Clinical outcomes from RCTs of interventions to reduce unnecessary antibiotic use, outcome: 2.4 Length of stay, all RCTs.
One RCT measured clinical outcome as potentially harmful delay in essential treatment (Strom 2010). The outcome was ascertained by the Trial Monitoring Committee, who stopped the trial prematurely when four participants were found to have potentially harmful delay in treatment with trimethoprim‐sulphamethoxazole or warfarin. This was a restrictive intervention intended to prevent interactions between these drugs.
Evidence from NRS
ITS studies
Clinical outcome data were measured as mortality in four ITS studies (Table 2) and length of stay in one ITS study (Table 3). However, we could only calculate 95% CI for three of these studies (Lee 2014; Popovski 2015; Skaer 1993), and the outcome data came from all participants in the hospital rather than just the participants who were the targets of the interventions.
| Study | Prescribing target | Restriction | Design of analysis | Effect estimate | 95% CI |
| Choice of drug | No | Cohort | Incidence rate ratio 1.1 | 0.9 to 1.5 | |
| Choice of drug | No | Cohort | Increase by 1.4% | ‐1.2% to 4.1% | |
| Choice of drug | Yes | ITS, segmented regression | Change in slope ‐0.0172 | No data | |
| Choice of drug | Yes | Cohort | +0.43 per 1000 OBD | No data |
*Mortality was measured in all patients in the hospital rather than just those patients who were the targets of the interventions.
CI: confidence interval
ITS: interrupted time series
OBD: occupied bed day
| Study | Prescribing target | Restrictive | Design of analysis | Effect estimate | 95% CI |
| Exposure, % treated | No | Cohort | ‐0.5 days | No data | |
| Choice of drug | No | Cohort | ‐0.1 days | ‐0.49 to +0.29 |
*Length of stay was measured in all patients in the hospital rather than just those patients who were the targets of the interventions.
CI: confidence interval
ITS: interrupted time series
Three ITS studies reported other clinical outcomes that provided more direct evidence about unintended consequences of the interventions (Table 4). An intervention to promote gentamicin for prophylaxis was intended to reduce risk of CDI but was associated with a large increase in acute kidney injury in the participants undergoing target operations, and as a consequence the antibiotic policy change was reversed (Bell 2014). An intervention designed to shorten time to first antibiotic dose for people with sepsis was not associated with any increase in the time left without being seen for all other participants in the emergency department (Volpe 2012). An intervention to reduce the duration of surgical antibiotic prophylaxis was not associated with increased surgical‐site infection (Van Kasteren 2005).
| Study | Prescribing target | Design of analysis | Effect measure | Effect estimate | 95% CI |
| Antibiotic choice | ITS, segmented regression | Risk of postoperative acute kidney injury | Increase 98% | 93.8% to 94.2% | |
| Exposure, duration | Cohort | Surgical‐site infection | Decrease 0.8% | ‐2.2% to 0.6% | |
| Time to first antibiotic dose | Cohort | Left without being seen rate | Decrease 0.4% | No data |
CI: confidence interval
ITS: interrupted time series
Case control, cohort and qualitative studies
Ten studies investigated unintended consequences of interventions to change antibiotic choice with cohort (n = 8), case control (n = 1), or qualitative case study (n = 1) designs (Table 5).
| Study | Design | Patients | Intended target | Unintended consequence | Effect estimate | 95% CI |
| Interventions with a restrictive component | ||||||
| Qualitative | 36 physicians | Reduce unnecessary use of restricted antibiotics | Inaccurate feedback | Not quantified; qualitative study | ||
| Case control | Not clear | Increase in physician‐based diagnosis of nosocomial infection | No denominator data | |||
| Cohort | 120 | Failure to warn prescribers about discontinuation | — | — | ||
| Cohort | 222 | Reduce unnecessary laboratory tests | Delay in TFAD (HR > 1 shows delay less likely in intervention period) | Multivariate HR 1.56 | 1.17 to 2.07 | |
| Cross‐sectional | 15,440 | Reduce unnecessary use of restricted antibiotics | Orders for restricted antibiotics (% all orders) from 10 to 11 pm vs all other hours | — | — | |
| Cohort | 360 | % appropriate orders 10 to 11 pm vs 9 to 10 pm | ‐23.7% | ‐31.8% to ‐15.5% | ||
| Cohort | 200 | Risk of inaccurate information in orders judged inappropriate vs appropriate | OR 2.2 | 1.0 to 4.4 | ||
| Cohort | 3251 | Risk of 1‐hour delay in TFAD | OR 1.5 | 1.2 to 1.8 | ||
| Risk of 2‐hour delay in TFAD | OR 1.8 | 1.4 to 2.2 | ||||
| Interventions with no restrictive component | ||||||
| Cohort | 13,042 | Reduce time to first antibiotic dose for patients with community‐acquired pneumonia | % CAP diagnoses | 1% increase | No denominator data | |
| Cohort | 518 | % correct CAP diagnoses | ‐7.9% decrease | ‐15.4% to ‐0.4% | ||
| Cohort | 548 | % correct CAP diagnoses | ‐16.0% decrease | ‐7.6% to ‐24.4% | ||
CAP: community‐acquired pneumonia
CI: confidence interval
HR: hazard ratio
OR: odds ratio
TFAD: time to the first antibiotic dose
There was a restrictive component to the intervention in seven studies. One study showed that restriction of laboratory tests of inflammation (C‐reactive protein and white blood cell count) was not associated with an increase in time to first antibiotic dose (Duvoisin 2014). The remaining six studies all revealed unintended consequences of interventions that restricted antibiotic choice by requiring prior approval, as follows.
-
Negative professional culture through breakdown in trust and communication (Baysari 2013; Calfee 2003; Connor 2007; Linkin 2007).
-
Delay in time to first antibiotic dose (LaRosa 2007; Winters 2010). Evidence of delay in essential treatment was also seen in one RCT (Strom 2010).
In three studies (Friedberg 2009; Kanwar 2007; Welker 2008), the intervention was a national financial incentive in the USA that was intended to reduce time to first antibiotic dose for people admitted to hospital with community‐acquired pneumonia (CAP). In all three studies, the unintended consequence was misdiagnosis of pneumonia, which could lead to an increase in unnecessary antibiotic treatment. In two single‐centre studies, there was a decrease in the percentage of participants with correct diagnosis of CAP based on prespecified criteria (Kanwar 2007; Welker 2008). In contrast, a large, multicentre study reported no evidence of an overall increase in the diagnosis of CAP (Friedberg 2009); however, this study was at high risk of bias.
Explaining heterogeneity in the intended effect of interventions
Meta‐regresson of RCTs
We performed meta‐regression on 29 RCTs with dichotomous prescribing outcomes (Analysis 1.1; Figure 3). Outcomes for all of these trials could be expressed as number of participants where treatment was compliant with policy divided by total participants. We did not perform meta‐regression on 15 RCTs with continuous prescribing outcomes because the outcomes were heterogeneous (Analysis 1.4; Analysis 1.7) and because none of the interventions included restriction or feedback, and only two did not include enablement (Danaher 2009; Kerremans 2008).
Meta‐regression results for 29 RCTs with dichotomous outcomes
In the meta‐regression, enablement, restriction, targeting antibiotic choice versus exposure and high risk of bias were significantly associated with greater intervention effect in univariate analysis, and they all remained significant in multivariate analysis (Figure 7).

Meta‐regression by effect modifier for 29 RCTs. A positive value for Beta indicates enhanced intervention effect. One RCT had both enabling and restrictive components in the intervention (Strom 2010).
Of the 23 RCTs of enabling interventions, four also included feedback (Camins 2009; Schnoor 2010; Schouten 2007; Yealy 2005). All four of these RCTs targeted antibiotic choice, so we have compared their effects with seven RCTs of enabling interventions without feedback that also targeted antibiotic choice. The mean risk difference for interventions with feedback was 19% (95% CI 16% to 22%) (Figure 8) compared with 13% (95% CI 9% to 17%) (Figure 9) for interventions with no feedback. Only two of the feedback RCTs also included action planning (Schouten 2007; Yealy 2005).

Forest plot of comparison 5: RCTs of enablement with and without feedback, outcome: 5.1 Enablement plus feedback.
Forest plot of comparison 5: RCTs of enablement with and without feedback, outcome: 5.2 Enablement without feedback.
Meta‐regression of ITS studies
Do interventions that involve enablement have greater initial effect?
There were 107 ITS studies with data that could be used for meta‐regression of prescribing outcomes at one, six, or 12 months' postintervention. We used multivariable meta‐regression to identify effect modifiers in 91 ITS studies including data about prescribing at six months' postintervention. As with the RCTs (Figure 7), both enablement and restriction were independently associated with increased effect in ITS studies (Figure 10). Of 29 ITS studies with restrictive interventions, 13 (45%) also had enablement, and this independently enhanced intervention effect (Figure 11). In comparison with interventions targeting antibiotic exposure, those targeting choice were associated with greater effect in RCTs (Figure 7), but not in ITS studies (Figure 10). The number of studies in each category only allowed analysis of the effects of setting in ITS studies (Figure 10), and intention could only be included in meta‐regression of ITS studies of enabling intervention (Figure 12). The limited evidence suggests that intention and setting were not effect modifiers (Figure 7; Figure 10).

Meta‐regression by effect modifiers of intervention for 91 ITS studies. Outcome is effect on prescribing six months' postintervention. There are 16 studies with both enabling and restricting intervention components (Figure 11).

Meta‐regression of prescribing outcome by effect modifiers for 29 ITS studies of interventions that included restriction.

Meta‐regression by effect modifier for 43 ITS studies of interventions that included enablement but not restriction. Outcome is effect on prescribing six months' postintervention. Note that four studies with feedback were not included in this analysis because they also included restriction.
Are interventions that include feedback more effective than those that do not?
Feedback was included in 4 (17%) of 23 RCTs (Figure 8) and 20 (47%) of 43 ITS studies (Figure 12) of enabling interventions that did not include restriction. The intervention was audit and feedback alone in three RCTs and 10 ITS studies. In one RCT and 11 ITS studies, audit and feedback was combined with review and recommend change or circumstantial reminders. Interventions that included feedback were more effective than those that did not. However, there were too few studies with goal setting or action planning to assess their effect in addition to feedback.
There were only two ITS studies with enough data to analyse the effect of adding an additional component to an effective intervention. However, the second intervention component did not include goal setting, feedback, or action planning in either study (Mol 2005; Po 2012)
Summary of interventions for the studies included in meta‐regression
In comparison with RCTs, the ITS studies were more likely to have multiple intervention components: 35 (38%) of 91 ITS studies versus 5 (17%) of 29 RCTs, odds ratio 3.00 (95% CI 1.05 to 8.59) (Table 6). There were also differences in the components for enabling interventions (review and recommend change was included in 53% of ITS studies versus 25% of RCTs) and restrictive interventions (removal of target drugs from clinical areas was included in 34% of ITS studies but in no RCTs) (Table 6). Educational meetings or distribution of educational materials was the most common intervention in studies that did include enablement or restriction (75% of RCTs and 89% of ITS studies) (Table 6).
| Intervention function and components | RCT | ITS |
| Enablement | 24 studies | 59 studies |
| Number of enabling or restrictive intervention components | 27 | 76 |
| Studies with > 1 Enabling intervention component | 2 8%* | 19 32%* |
| Audit and feedback | 4 17% | 24 41% |
| Computerised decision support | 1 4% | 3 5% |
| Circumstantial reminders | 16 67% | 18 31% |
| Review and recommend change | 6 25% | 31 53% |
| Restriction | 2 studies | 29 studies |
| Number of Restrictive intervention components | 3 | 41 |
| Studies with > 1 Restrictive intervention component | 1 50% | 10 34% |
| Expert approval | 1 50% | 18 62% |
| Compulsory order form | 1 50% | 7 24% |
| Removal | 0 | 10 34% |
| Review and make change | 1 50% | 6 21% |
| No Enablement or Restriction | 4 studies | 18 studies |
| Number of intervention components | 6 | 25 |
| Studies with > 1 intervention component | 2 50% | 6 33% |
| Educational materials or meetings | 3 75% | 16 89% |
| Educational outreach (academic detailing) | 1 25% | 6 33% |
| Physical reminders | 1 25% | 2 11% |
| Structural intervention | 1 25% | 1 6% |
*The denominator for all percentages is the number of studies for each intervention function. One RCT, Strom 2010, and 16 ITS studies (Figure 11) included both enabling and restrictive intervention components.
ITS: interrupted time series
RCT: randomised controlled trial
Sustainability of intervention effect
Sustainability was assessed in 64 of 91 ITS studies, with prescribing outcome data at both 6 and 12 months' postintervention. Intervention effect was sustained at 12 months' postintervention in 55 (86%) of these studies (95% CI 77% to 94%). There were 13 interventions with neither enablement nor restriction; intervention effect was sustained in 11 (85%) (95% CI 65% to 100%). Consequently, it was unlikely that either enablement or restriction would be associated with greater sustainability. However, the results suggest that restrictive interventions were less likely to have sustained effect if they did not include enablement: 5/8 (62%) versus 12/13 (92%) with enablement, risk difference 30% (95% CI ‐7% to 66%).
Five ITS studies with data about removal of interventions provided additional information about sustainability of interventions (Table 7). Three of these studies also provided data about the effect of the intervention. The intended effect of all interventions was decrease in the use of target antibiotics. Removal of the intervention was associated with increase in the use of target antibiotics in all five studies and, with one exception (Kim 2008), the 95% CI for effect size did not include decrease in use of target antibiotics. Kim 2008 was the only one of these five interventions including enablement by audit and feedback.
| Study | Intervention function | Intervention effect (95% CI) | Time intervention was in place | Effect of removal (95% CI) |
| Restriction | ‐87.5% ‐115.4 to ‐59.7 | 6 months | 398.9% 238.2 to 559.5 | |
| Restriction | ‐23.1% ‐53.7 to +7.4 | 9 months | 6.0% ‐23.4 to 35.4 | |
| Enablement | ‐28.6% ‐46.5 to ‐10.6 | 7 years | 31.0% 6.8 to 55.3 | |
| Restriction | No data | “long‐standing” | 301.2% 230.9 to 371.5 | |
| Restriction | 2 years | 255.8% 194.7 to 316.9 |
CI: confidence interval
Microbial outcomes (antibiotic resistance and CDI)
There were 1 CBA and 5 RCTs with microbial outcome data, and these were too heterogeneous for data synthesis (Table 8).
| Study | Design | Microbial outcome | Reason not in meta‐analysis |
| RCT | Colonisation with MRSA (nasal swab) and GNRB (rectal swabs) | Not comparable with any other RCT | |
| RCT | Number of cases of Clostridium difficile | Not in prescribing meta‐analysis | |
| RCT | Secondary infection and/or colonisation with multidrug‐resistant bacteria in the 6 months following randomisation | Not in prescribing meta‐analysis. It is impossible to assess the impact of the intervention on colonisation or infection with bacteria resistant to specific antibiotics. | |
| RCT | CDI and infection with antibiotic resistant organisms cases/1000 OBD | Not in prescribing meta‐analysis | |
| RCT | Number of participants with "antimicrobial resistance and/or superinfections" from randomisation until discharge from hospital | It is impossible to assess the impact of the intervention on colonisation or infection with bacteria resistant to specific antibiotics. |
CDI: Clostridium difficile infection
GNRB: gram‐negative resistant bacteria
MRSA: methicillin‐resistant Staphylococcus aureus
OBD: occupied bed day
RCT: randomised controlled trial
We performed meta‐regression on 26 ITS studies including reliable data about prescribing outcomes at 6 months and microbial outcomes at 12 months after the intervention (Table 9). Six unplanned interventions (in response to outbreaks) were associated with markedly greater effect on microbial outcomes (Figure 13). When studies were ranked in descending order of effect size for microbial outcome at 12 months, the top five studies were all unplanned interventions (Kim 2008; May 2000; McNulty 1997; Tangdén 2011; Valiquette 2007), with the remaining unplanned intervention ranking 9th (Lautenbach 2003).

Meta‐regression by effect modifiers for 34 microbial outcomes 12 months' postintervention from 26 ITS studies. The bars show the results for unadjusted versus adjusted analyses, the comparison for unplanned interventions is with planned interventions in both the unadjusted and adjusted analysis.
CDI: Clostridium difficile infection
GPC: infection with antibiotic‐resistant gram‐positive cocci
GNB: infection with antibiotic‐resistant gram‐negative bacteria
Other infection control: 'Yes' means there were changes to infection control processes during the study period.
| Prescribing target | Microbial outcome | N | Study ID |
| Cephalosporins | GNRB | 8 | Grohs 2014; Kim 2008; Knudsen 2014; Lee 2007; McNulty 1997; Meyer 2009; Petrikkos 2007; Tangdén 2011 |
| MRSA | 1 | ||
| Carbapenems | GNRB | 1 | |
| Fluoroquinolones | GNRB | 3 | |
| MRSA | 1 | ||
| High‐risk antibiotics | CDI | 6 | Aldeyab 2012; Chan 2011; Dancer 2013; Fowler 2007; Talpaert 2011; Valiquette 2007 |
| GNRB | 4 | ||
| MRSA | 6 | Aldeyab 2014; Ananda‐Rajah 2010; Chan 2011; Dancer 2013; Fowler 2007; Liebowitz 2008 | |
| Total antibiotic use | CDI | 2 | |
| MRSA | 1 | ||
| Vancomycin | VRE | 1 | |
| Total microbial | 34* |
*Some studies had more than one microbial outcome, so the total is 34 microbial outcomes from 26 studies.
CDI: Clostridium difficile infection
GNRB: gram‐negative resistant bacteria
ITS: interrupted time series
MRSA: methicillin‐resistant Staphylococcus aureus
VRE: vancomycin‐resistant enterococci
In the 20 studies of planned intervention, there were six studies with unclear information about other infection control interventions or changes during the study period (Chan 2011; Grohs 2014; Jump 2012; Liebowitz 2008; Meyer 2009; Petrikkos 2007). We performed meta‐regression on the remaining 14 studies from Table 9 (Figure 14). In contrast with the meta‐regression of all 27 studies (Figure 13), the effects of setting, other infection control interventions, and microbial outcome type were all reversed so that each of these variables was associated with increase in effect size in the 14 studies with planned interventions and details of other infection control interventions (Figure 14).

Meta‐regression by effect modifiers for 20 microbial outcomes 12 months' postintervention from 14 ITS studies of planned interventions that provided details about other infection control changes or interventions.
CDI: Clostridium difficile infection
GPC: infection with antibiotic‐resistant gram‐positive cocci
GNB: infection with antibiotic‐resistant gram‐negative bacteria
Other infection control: 'Yes' means there were changes to infection control processes during the study period.
The antibiotic targets for the 20 studies of planned interventions were single antibiotic classes in nine studies (Cook 2011b; Grohs 2014; Knudsen 2014; Lafaurie 2012; Lee 2007; Meyer 2009; Petrikkos 2007; Willemsen 2010; Yoon 2014), high‐risk antibiotics in nine studies (Aldeyab 2012; Aldeyab 2014; Ananda‐Rajah 2010; Buising 2008a; Chan 2011; Dancer 2013; Fowler 2007; Liebowitz 2008; Talpaert 2011), and all antibiotics in the remaining two studies (Cook 2011a; Jump 2012). High‐risk antibiotics were a combination of drugs from more than one class of antibiotic, which were all considered to be high risk for the microbial outcome. The prescribing outcome data reported in these nine studies varied from just one of the high‐risk antibiotics, in Dancer 2013, through individual results for all of the high‐risk antibiotics, in Buising 2008a, Chan 2011, Fowler 2007, and Talpaert 2011, to combined results for all of the high‐risk antibiotics (Aldeyab 2012; Aldeyab 2014; Ananda‐Rajah 2010; Liebowitz 2008).
One study can be used to demonstrate the technical challenges of estimation of intervention effect on microbial outcomes (Dancer 2013). The intervention was addition of complete restriction of ceftriaxone and ciprofloxacin to a pre‐existing multifaceted intervention introduced seven months before restriction and remaining in place throughout the restrictive period (Dancer 2013). We could not analyse the effect of the initial multifaceted intervention because there were no pre‐intervention data about prescribing or microbial outcomes. However, the available data showed CDI was lower by ‐0.143 cases per 1000 occupied bed days per month in the nine months prior to the addition of the restrictive intervention. At the start of the restrictive intervention, CDI rates were already low (1.5 cases per 1000 occupied bed days). After the introduction of restriction, CDI rates continued to decline for five months, and then stabilised at around 0.5 cases per 1000 occupied bed days. These data suggest that the restrictive intervention had no additional effect on the rate of CDI. However, the segmented regression analysis estimated that there was a relative increase of 35.8% in CDI rate 12 months after the restrictive intervention with very wide confidence intervals (from 81.0% decrease to 152.7% increase).
Our review did include one multicentre controlled ITS study comparing CDI rates in six hospitals with antimicrobial stewardship programmes versus four control hospitals (Ostrowsky 2014). We did not include this study in evidence synthesis because neither the interventions nor the prescribing outcomes were standardised across the six hospitals with stewardship programmes. Baseline rates of CDI were only 0.8 cases per 1000 occupied bed days in the intervention and control hospitals before the intervention, and the authors did not report a decrease in aggregate CDI rates either between intervention and non‐intervention groups or within the intervention groups over time (Ostrowsky 2014).
We have not attempted to synthesise microbial outcome data because of the small number of studies, the heterogeneity of intervention targets and prescribing outcomes, and the wide confidence intervals for estimated relative effect. We have focused on the 20 ITS studies of planned interventions and separated the results by microbial outcome type. Interventions were associated with consistent reduction in CDI (median ‐48.6%, interquartile range ‐80.7% to ‐19.2%) but inconsistent effect on resistant gram‐negative bacteria (median ‐12.9%, interquartile range ‐35.3% to 25.2%) and resistant gram‐positive bacteria (median ‐19.3%, interquartile range ‐50.1% to 23.1%). There were too few studies with too much variance in microbial outcomes to reliably assess the relationship between change in antibiotic use and each of the microbial outcomes.
Discusión
Resumen de los resultados principales
Los ECA aportan pruebas de confiabilidad alta de que las intervenciones son efectivas para aumentar el cumplimiento de las políticas relacionadas con los antibióticos y para reducir la duración del tratamiento con antibióticos de forma segura, sin un aumento de la mortalidad. Además, las intervenciones se asociaron con una reducción en la duración de la estancia. El mecanismo no está claro, y se requiere más investigación. Sin embargo, la reducción de la estancia hospitalaria es un objetivo institucional clave para la mayoría de los hospitales, por lo que estas pruebas deben usarse para priorizar la administración cuidadosa de los antimicrobianos en los hospitales.
El análisis de los modificadores del efecto en los ECA y los estudios de STI apoyó de forma consistente la teoría de que la inclusión de la facilitación aumenta el efecto de la intervención, incluidas las de componentes restrictivos. Sin embargo, la información sólo se usó en una minoría de las intervenciones de facilitación, y muy pocas incluyeron la fijación de metas o la planificación de las acciones.
Compleción y aplicabilidad general de las pruebas
Los ECA indican que las intervenciones aumentan el cumplimiento de las políticas o las guías en un 15%, que es un tamaño del efecto clínicamente importante. Sin embargo, el resultado es menos notable cuando se considera que el cumplimiento de los profesionales de salud de las recomendaciones de prescripción aumentó de un 43% a un 58%, debido a que un cumplimiento del 58% probablemente todavía es demasiado bajo. Tres estudios lograron un cumplimiento del 90% de las guías al incluir lo anterior como una meta explícita para la intervención y al utilizar la planificación de las acciones para revisar las intervenciones hasta el logro del objetivo (Jobson 2015; Volpe 2012; Weinberg 2001).
Los estudios de STI proporcionaron pruebas adicionales importantes de que los resultados de los ECA con respecto a la efectividad de las intervenciones pueden reproducirse en la práctica habitual: 70% de los estudios de STI informaron sobre las intervenciones con alcance a los hospitales en comparación con sólo un 31% de los ECA.
Sólo dos estudios de STI incluyeron datos que permitieron la evaluación del efecto del agregado de un componente de intervención a una intervención existente (Mol 2005; Po 2012). El anterior es un diseño de estudio fuerte que debe usarse más ampliamente para evaluar estos tipos de intervenciones.
Seguridad y consecuencias imprevistas de las intervenciones
La limitación principal de las pruebas de los ECA con respecto a la seguridad de la reducción del uso innecesario fue que sólo dos intervenciones incluían la restricción, y uno se interrumpió de forma temprana debido al retraso en el comienzo del tratamiento (Strom 2010). Dos ENA también plantearon inquietudes en cuanto al retraso en el tiempo hasta la primera dosis de antibiótico asociado con las intervenciones restrictivas (LaRosa 2007; Winters 2010). Además, cuatro ENA describieron los efectos negativos de las intervenciones restrictivas sobre la cultura profesional a través del deterioro en la confianza y la comunicación (Baysari 2013; Calfee 2003; Connor 2007; Linkin 2007). Estos ENA usaron diseños de control de casos, de cohortes o cualitativos debido a que requerían la recopilación de los datos que no estaban disponibles en los sistemas clínicos habituales (Tabla 5).
Los estudios de STI proporcionaron muy pocas pruebas acerca de la seguridad de las intervenciones debido a que dependen de los sistemas clínicos habituales para las medidas de resultado, que actualmente en su mayoría son incapaces de proporcionar información acerca de pacientes específicos, por ejemplo los que presentan infección. Además, el rango de medidas clínicas debe extenderse más allá de los resultados de la infección para incluir indicadores de seguridad como la insuficiencia renal aguda (IRA). (Bell 2014). La Infection Intelligence Platform de Escocia se estableció para mejorar el enlace y la disponibilidad de los datos habituales (ISD 2016), aunque se necesita investigación para mejorar el momento oportuno, la calidad y la relevancia de las medidas de resultados clínicos y para proporcionar una comprensión más profunda de las consecuencias imprevistas de las intervenciones para la mejoría (SISCC 2016). Se encontró sólo un ejemplo de un estudio cualitativo de las consecuencias imprevistas (Baysari 2013). El mismo es un diseño de estudio importante para la investigación de las consecuencias no previstas de las intervenciones y debe utilizarse más ampliamente (Rogers 1995).
El estudio del efecto de la eliminación de una intervención puede usarse para aportar las pruebas adicionales acerca de los resultados de la intervención original (Walker 2016). Este estudio provino del mismo grupo que informó que una intervención que estaba orientada a reducir el riesgo de CDI en los pacientes sometidos a cirugía ortopédica se asoció con un mayor riesgo de IRA posoperatoria (Bell 2014) (Tabla 4). El aumento de la IRA se atribuyó al cambio en la política de profilaxis quirúrgica con antibióticos de cefuroxima a flucloxacilina y gentamicina. Este segundo estudio reveló una reducción en la IRA posoperatoria asociada con un cambio alejado de la flucloxacilina y la gentamicina, que aporta pruebas persuasivas adicionales de que la gentamicina fue responsable del aumento original en la IRA posoperatoria (Walker 2016).
Las intervenciones se asociaron de forma consistente con una reducción en la estancia hospitalaria (Análisis 2.4), y los resultados fueron similares cuando el análisis se restringió a los ECA en riesgo bajo o medio de sesgo (Análisis 2.6). La medición de la estancia hospitalaria estaba orientada a proporcionar la reafirmación acerca de la seguridad de la intervención por lo cual la reducción de la estancia hospitalaria es un ejemplo de un resultado beneficioso no previsto (Ash 2007; Rogers 1995). Se encontraron resultados similares para las intervenciones orientadas a la elección de los antibióticos (Análisis 3.2) o a la exposición a los antibióticos (Análisis 4.2). Un mecanismo posible para la reducción de la estancia hospitalaria es que las intervenciones redujeron la duración del tratamiento con antibióticos intravenosos (Carratala 2012). Sin embargo, se requiere más investigación.
Resultados microbianos
Las intervenciones se asociaron de forma consistente con una reducción del CDI, aunque se asociaron de forma menos consistente con una reducción de la infección por bacterias resistentes. Sin embargo, los efectos de la intervención sobre los resultados microbianos sólo pudieron analizarse de forma confiable en las intervenciones planificadas (Figura 13), y los metanálisis estuvieron limitados por cuatro retos técnicos.
-
Cada estudio presentó una varianza considerable debido al número pequeño de eventos microbianos en cada punto temporal.
-
Los estudios rara vez presentaron datos estables preintervención, por lo cual la extrapolación de la tendencia preintervención a través de toda la fase posintervención probablemente fue poco confiable.
-
Se analizó un único resultado de prescripción para cada estudio (incluso cuando se informaban más). Los criterios para la selección del resultado de prescripción fueron determinados por el plan de análisis para el efecto de las intervenciones sobre la conducta de prescripción. Sin embargo, estos criterios pueden no haber sido correctos para el análisis de la relación entre los cambios en la prescripción y los resultados microbianos.
-
Sólo fue posible analizar la relación entre la prescripción y los resultados microbianos en puntos temporales fijos. Se eligieron seis y 12 meses, respectivamente, lo cual impuso un lapso de seis meses para todas las intervenciones. Sin embargo, el lapso de tiempo probablemente variará según la prescripción y los resultados microbianos, y según el contexto de intervención (Vernaz 2008).
Calidad de la evidencia
Se encontraron pruebas de confiabilidad alta de que las intervenciones aumentan el uso apropiado de los antibióticos, reducen la duración del tratamiento con antibióticos y acortan la estancia hospitalaria sin aumentar el riesgo de mortalidad. Hubo pruebas de confiabilidad baja de que estas intervenciones pueden retrasar el tratamiento y crear una cultura profesional negativa (Resumen de los hallazgos para la comparación principal). El alto riesgo de sesgo se asoció con un mayor efecto de la intervención en los ECA (Figura 7) para el resultado del cumplimiento de la práctica deseada. Sin embargo, se ha presentado un análisis por separado de los efectos para los ECA en riesgo bajo o medio de sesgo (Análisis 1.3; Análisis 1.6; Análisis 2.3; Análisis 2.6). Estos análisis aportan pruebas que apoyan la decisión de no disminuir la calidad a causa del riesgo de sesgo, debido a que la exclusión de los estudios en alto riesgo de sesgo no cambió sustantivamente la dirección del efecto. No se disminuyó la calidad a causa de la inconsistencia debido a que la dirección del efecto entre los estudios fue consistente y la metarregresión proporciona alguna explicación de los niveles altos de heterogeneidad estadística entre los resultados de los estudios. La confiabilidad de las pruebas acerca de los efectos adversos fue más variable, con cuestiones especiales acerca de las consecuencias imprevistas de las intervenciones restrictivas, a saber, los retrasos en el tratamiento y la cultura profesional negativa, sobre los cuales hay pruebas de confiabilidad baja.
La calidad de la información de las intervenciones fue deficiente, lo cual dificulta la implementación confiable de las intervenciones que han mostrado ser útiles por parte de los profesionales y los equipos clínicos y la repetición y el desarrollo de los hallazgos de investigación por parte de otros investigadores (Hoffmann 2014). Se encontraron pruebas de confiabilidad alta de que tanto la facilitación como la restricción mejoraron la efectividad de las intervenciones. Sin embargo, sólo se encontraron pruebas de confiabilidad moderada sobre la efectividad de la información y hubo muy pocos estudios con planificación de las acciones y fijación de metas para proporcionar información fidedigna acerca de los efectos combinados de estas técnicas de cambio de conducta.
En el análisis del riesgo de sesgo se proporciona el mismo peso a todos los criterios (Figura 2). Los hallazgos para los resultados microbianos mostraron claramente que el riesgo de sesgo de las intervenciones no planificadas es mucho mayor que el riesgo de otras intervenciones de control de las infecciones (Figura 13; Figura 14).
Se encontró que algunos diseños de estudios de ENA aportaron pruebas adicionales importantes acerca de los efectos de la intervención y la sostenibilidad en la práctica clínica habitual (estudios STI) y acerca de las consecuencias imprevistas (estudios de control de casos, de cohortes y cualitativos). Sin embargo, no se hallaron pruebas útiles de ECAD ni ENA y se sugiere que estos diseños del estudio no deben estar incluidos en las actualizaciones de esta revisión.
Heterogeneidad del efecto de intervención
Se encontró que dos funciones de la intervención, facilitación y restricción, explicaron algo de la variación en la conducta de prescripción estudiada. Sin embargo, se encontraron pocas pruebas del uso de la teoría de cambio de conducta para diseñar las intervenciones (Charani 2011). Hubo muy pocas intervenciones con metas explícitas o planificación de las acciones para incluir estas variables en la metarregresión.
No hubo pruebas consistentes de que el contexto ni la meta de la intervención explicara la variación en el efecto de las intervenciones (Figura 7; Figura 10)
Sesgos potenciales en el proceso de revisión
Podría discutirse la decisión no de usar los datos ajustados para los ECA con asignación al azar grupal para el análisis primario. Las consecuencias del uso de los datos no ajustados sería la asignación de demasiado peso a los estudios grupales en el análisis, lo cual podría sesgar potencialmente el efecto de los análisis a sus resultados (Higgins 2011). Se cree que es poco probable que el hecho de tener en cuenta el agrupamiento repercuta en la solidez de los resultados de una forma que cambie las conclusiones de la revisión. Los análisis de sensibilidad proporcionan algún apoyo indirecto al enfoque implementado. En comparación con los resultados no ajustados, los análisis basados en los tamaños de la muestra efectiva calculados de los supuestos ICC proporcionaron sistemáticamente un efecto promedio más grande de la intervención (Análisis 1.1 versus Análisis 1.2; Análisis 2.1 versus Análisis 2.2; Análisis 2.4 versus Análisis 2.5). El tamaño mayor del efecto podría explicarse a través del peso inferior asignado a los estudios grupales, que tendieron a presentar efectos más pequeños que los estudios aleatorios con asignación individual.
La búsqueda bibliográfica electrónica no identificó 42 (19%) de los 221 estudios incluidos, lo cual destaca algunos de los retos al elaborar los términos sensibles de búsqueda de las revisiones de las intervenciones conductuales y la identificación de los estudios no aleatorios. Es posible que los estudios elegibles adicionales no hayan sido recuperados por el proceso de búsqueda que se realizó para esta revisión.
No se encontraron pruebas del sesgo de publicación en los ECA, sin embargo el sesgo de publicación es más probable en los estudios de STI debido a que la decisión de publicar puede haberse tomado después del análisis del efecto de la intervención.
Acuerdos y desacuerdos con otros estudios o revisiones
Acuerdos
Ivers 2012 incluyó y analizó 140 ECA que comparaban cualquier intervención en la cual la auditoría y la información fuesen un componente central esencial de la atención habitual y que evaluaran los efectos sobre la práctica profesional. La revisión concluyó que las intervenciones fueron más efectivas cuando también incluían la fijación de metas y la planificación de las acciones. No fue posible reproducir el análisis debido a que sólo cuatro de los ECA incluían información (Figura 8). Aunque 20 estudios de STI incluyeron información (figura 12), no hubo suficientes estudios con fijación de metas ni planificación de las acciones para realizar un análisis fiable.
Los hallazgos son similares a una revisión anterior que halló que no se consideraron debidamente los determinantes conductuales ni las normas sociales en el diseño y la evaluación de las intervenciones para el cambio de prescripción de antibióticos (Charani 2011).
Sostenibilidad del efecto de la intervención
Se encontraron pruebas de que la eliminación de la restricción, en Himmelberg 1991; Kallen 2009; Kim 2008 y Skrlin 2011; o de la revisión y la recomendación del cambio (facilitación, Standiford 2012) se asociaron con la inversión del efecto de la intervención (Tabla 7). Tres estudios anteriores han revelado que la eliminación de los incentivos económicos se asocia con la inversión de los efectos de la intervención en la atención primaria (Avery 2012; Dreischulte 2016; Lester 2010). Este es un tema importante debido a que la fuerza atractiva de las intervenciones se reducirá si los recursos para la mejoría no pueden trasladarse a nuevas prioridades. La restricción es una intervención de costo relativamente bajo, aunque es preocupante que una intervención de facilitación (revisar y recomendar cambios) aparentemente no tenga un efecto mantenido sobre los equipos clínicos después de ser implementada por siete años (Standiford 2012). La posibilidad de revisar y recomendar el cambio es un proceso prolongado que estuvo incluido en 36 (54%) de 67 de las intervenciones de facilitación en los estudios de STI.
Desacuerdos
Una revisión sistemática sobre las pruebas actuales acerca de los objetivos de la administración cuidadosa de antimicrobianos informó que la "el tratamiento empírico adherido a las guías se asoció con una reducción de la mortalidad (odds ratio 0,65; IC del 95%: 0,54 a 0,80)" (Schuts 2016). Sólo dos de los 39 estudios de esta revisión informaron una intervención: uno fue inválido debido a que era un estudio no controlado de antes y después (Garcia 2007), y el otro fue un ECAD (Dean 2006). Los 27 estudios restantes usaron diseños de estudio de casos y controles o de cohortes para comparar los resultados de los participantes con y sin tratamiento con antibióticos adherido a las guías, y no incluyeron una intervención para cambiar la práctica profesional. Los resultados de esta revisión presentan un contraste marcado con los análisis de la mortalidad de 11 ECA dirigidos a la elección de los antibióticos (Análisis 3.1). La explicación más probable de la discrepancia entre los resultados y Schuts 2016 son los factores de confusión relacionados con la indicación. Es probable que los participantes con enfermedades menos complejas o menos graves tuvieran una mayor probabilidad de recibir tratamiento con antibióticos adherido a las guías y que hubiese factores de confusión residuales después del ajuste para la información clínica disponible.
Una revisión sistemática sobre el efecto de los programas de administración cuidadosa de antibióticos sobre el CDI informó que las intervenciones se asociaron con un efecto protector consistente y considerable (cociente de riesgos agrupado para el CDI 0,48; IC del 95%: 0,38 a 0,62) (Feazel 2014). De los 16 estudios incluidos en esta revisión sistemática, cuatro eran estudios de STI que también estaban incluidos en la revisión (Elligsen 2012; Fowler 2007; Price 2010; Talpaert 2011), y los 12 estudios restantes fueron estudios no controlados de antes y después o estudios de STI inadecuados. El análisis estadístico de esta revisión no fue apropiado (Feazel 2014). El cálculo de los cocientes de riesgos para los períodos pos ‐ versus preintervención es un análisis no controlado de antes y después, que no proporciona un cálculo fiable del efecto de la intervención.
Se pueden encontrar más detalles sobre los desacuerdos con Feazel 2014 y Schuts 2016 en el Apéndice 7.
Limitaciones
Hay cinco debilidades en las pruebas actuales.
-
Las pruebas de los efectos previstos están desequilibradas hacia la reducción del tratamiento innecesario (cumplimiento de las guías que están concebidas para reducir el uso de antibióticos de amplio espectro o para acortar la duración del tratamiento). Se necesitan más pruebas acerca de la posibilidad de elaborar con astucia un tratamiento efectivo de la sepsis sin causar también un uso excesivo de los antibióticos.
-
Las pruebas limitadas con respecto a los efectos adversos de las intervenciones restrictivas indican que pueden asociarse con un retraso en el tratamiento esencial. Se necesitan mejores medidas de resultado de la seguridad del paciente que puedan usarse en los estudios de las intervenciones en la práctica clínica.
-
La mayoría de las intervenciones no utiliza técnicas efectivas para el cambio de conducta como la planificación de las acciones o la información.
-
Debido a la función crucial de los médicos auxiliares en la administración cuidadosa de antimicrobianos en los hospitales, es sorprendente que haya sólo un único ejemplo de una intervención que involucraba a médicos auxiliares en la automonitorización y la reflexión sobre la información acerca de la prescripción (Price 2010).
-
El análisis de la repercusión de las intervenciones en los resultados microbianos requiere ECA grandes en hospitales múltiples.

Figure 1 Study flow diagram.

Risk of bias graph: review authors' judgements about each risk of bias item presented as percentages across all included studies.
Blank sections in this graph are due to use of different ROB criteria for CBA, NRT and RCT versus ITS studies

Forest plot of comparison: 1 Prescribing: RCTs of all interventions to reduce unnecessary prescribing, outcome: 1.1 Dichotomous outcomes, increase in desired practice.

Forest plot of comparison: 1 Effectiveness: Prescribing outcomes from RCTs of interventions to reduce unnecessary antibiotic use, outcome: 1.4 Continuous outcomes, duration of all antibiotic treatment (days).
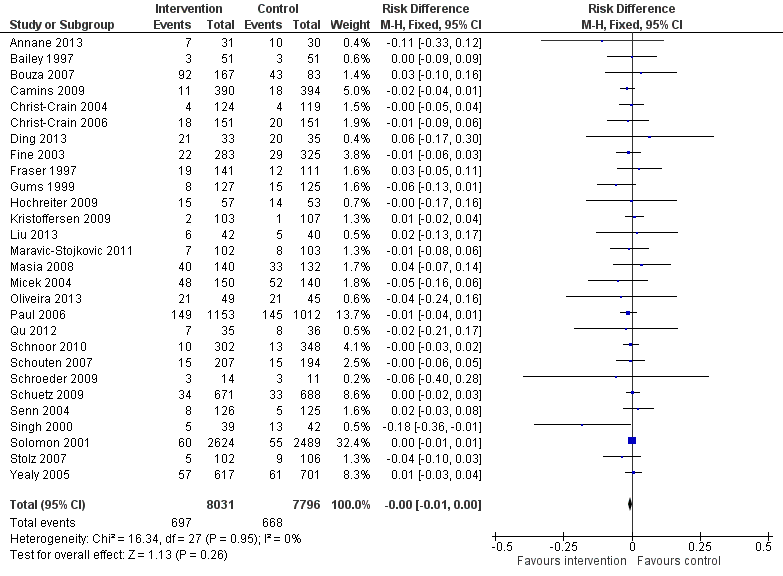
Forest plot of comparison: 2 Adverse effects: Clinical outcomes from RCTs of interventions to reduce unnecessary antibiotic use, outcome: 2.1 Mortality, all RCTs.
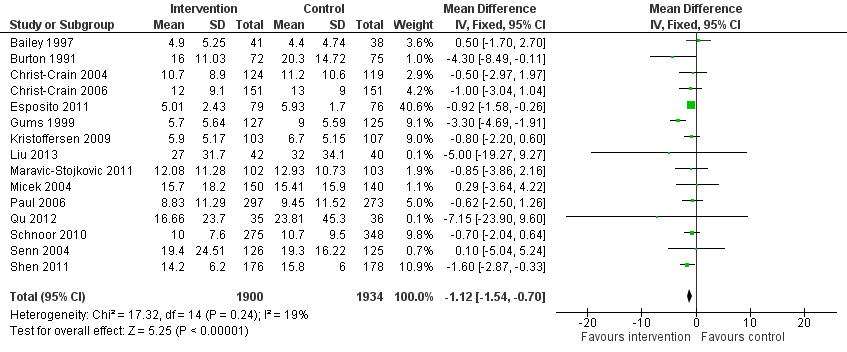
Forest plot of comparison: 2 Adverse effects: Clinical outcomes from RCTs of interventions to reduce unnecessary antibiotic use, outcome: 2.4 Length of stay, all RCTs.
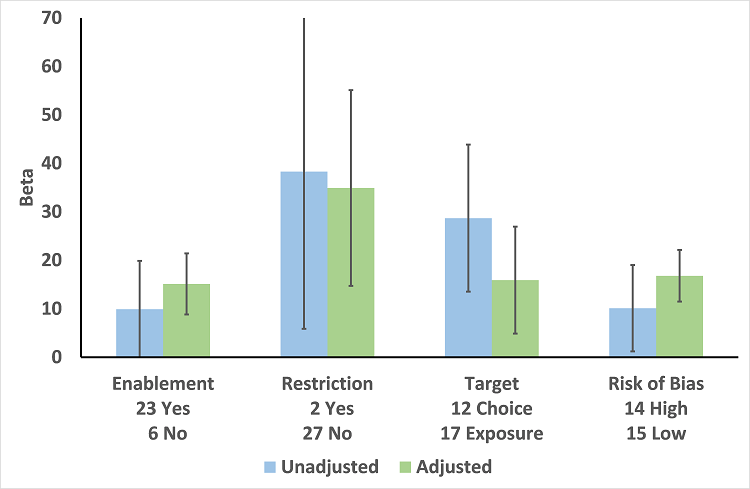
Meta‐regression by effect modifier for 29 RCTs. A positive value for Beta indicates enhanced intervention effect. One RCT had both enabling and restrictive components in the intervention (Strom 2010).

Forest plot of comparison 5: RCTs of enablement with and without feedback, outcome: 5.1 Enablement plus feedback.

Forest plot of comparison 5: RCTs of enablement with and without feedback, outcome: 5.2 Enablement without feedback.
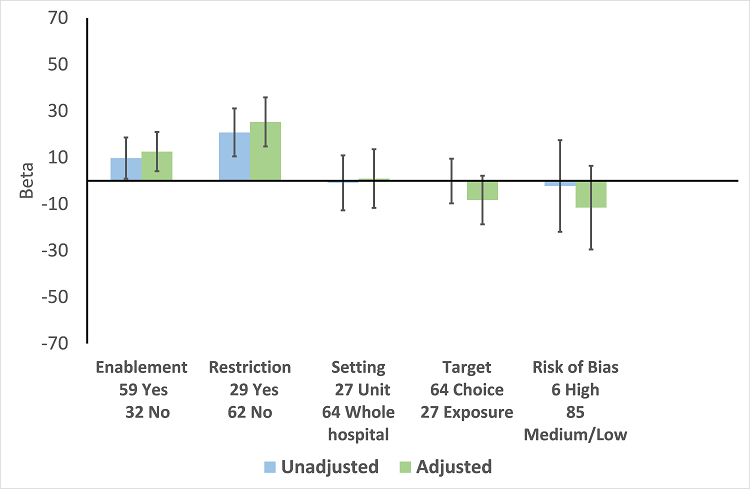
Meta‐regression by effect modifiers of intervention for 91 ITS studies. Outcome is effect on prescribing six months' postintervention. There are 16 studies with both enabling and restricting intervention components (Figure 11).

Meta‐regression of prescribing outcome by effect modifiers for 29 ITS studies of interventions that included restriction.
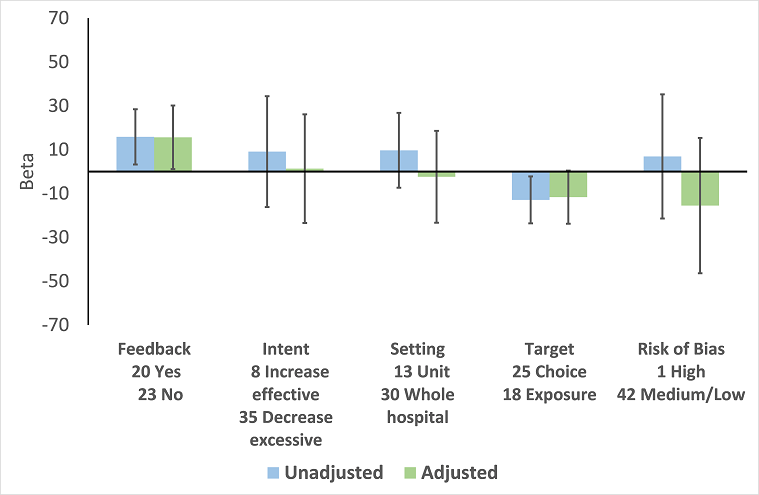
Meta‐regression by effect modifier for 43 ITS studies of interventions that included enablement but not restriction. Outcome is effect on prescribing six months' postintervention. Note that four studies with feedback were not included in this analysis because they also included restriction.
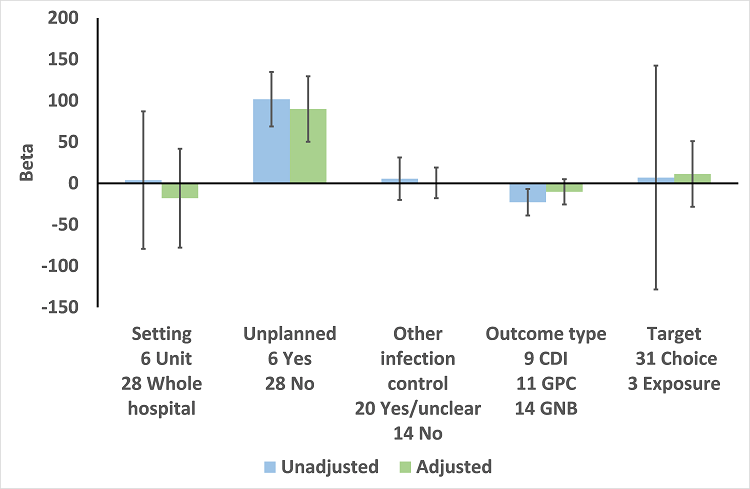
Meta‐regression by effect modifiers for 34 microbial outcomes 12 months' postintervention from 26 ITS studies. The bars show the results for unadjusted versus adjusted analyses, the comparison for unplanned interventions is with planned interventions in both the unadjusted and adjusted analysis.
CDI: Clostridium difficile infection
GPC: infection with antibiotic‐resistant gram‐positive cocci
GNB: infection with antibiotic‐resistant gram‐negative bacteria
Other infection control: 'Yes' means there were changes to infection control processes during the study period.
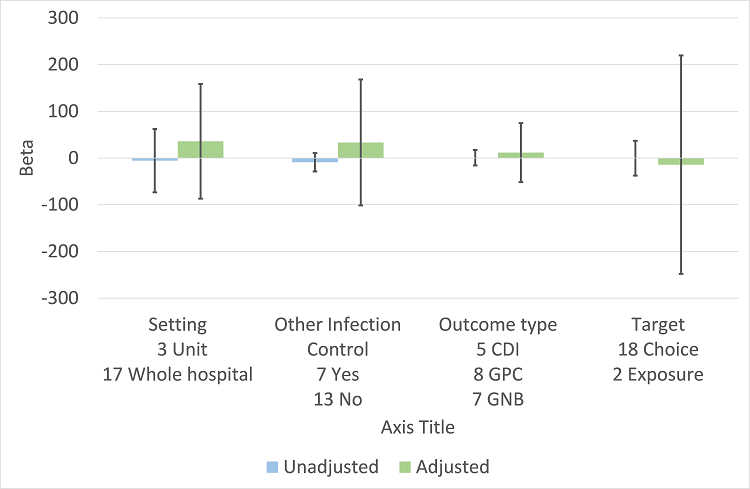
Meta‐regression by effect modifiers for 20 microbial outcomes 12 months' postintervention from 14 ITS studies of planned interventions that provided details about other infection control changes or interventions.
CDI: Clostridium difficile infection
GPC: infection with antibiotic‐resistant gram‐positive cocci
GNB: infection with antibiotic‐resistant gram‐negative bacteria
Other infection control: 'Yes' means there were changes to infection control processes during the study period.

Comparison 1 Effectiveness: Prescribing outcomes from RCTs of interventions to reduce unnecessary antibiotic use, Outcome 1 Dichotomous outcomes, increase in desired practice.
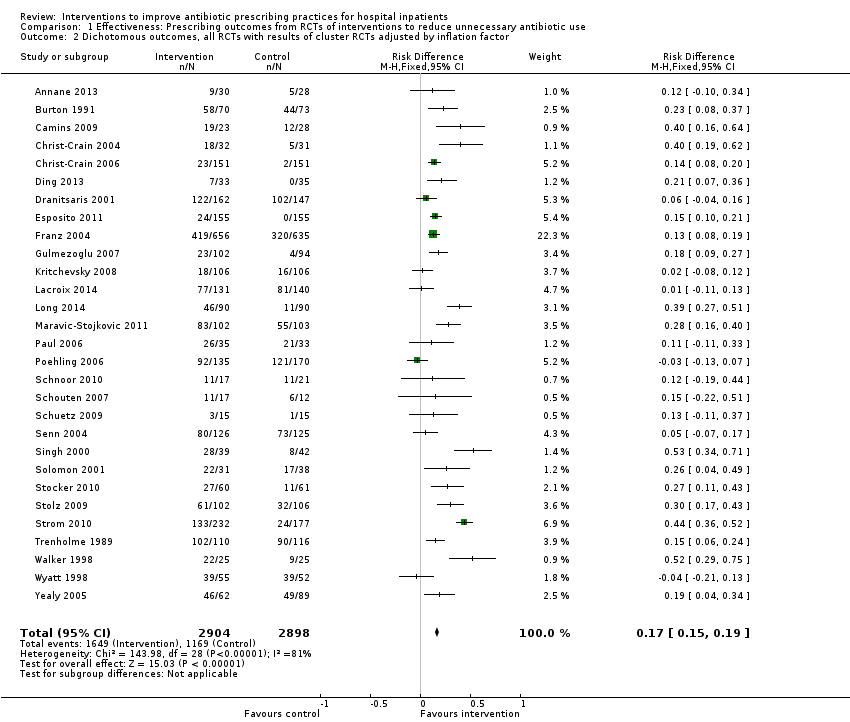
Comparison 1 Effectiveness: Prescribing outcomes from RCTs of interventions to reduce unnecessary antibiotic use, Outcome 2 Dichotomous outcomes, all RCTs with results of cluster RCTs adjusted by inflation factor.

Comparison 1 Effectiveness: Prescribing outcomes from RCTs of interventions to reduce unnecessary antibiotic use, Outcome 3 Dichotomous outcomes, low or medium 'Risk of bias' studies only.
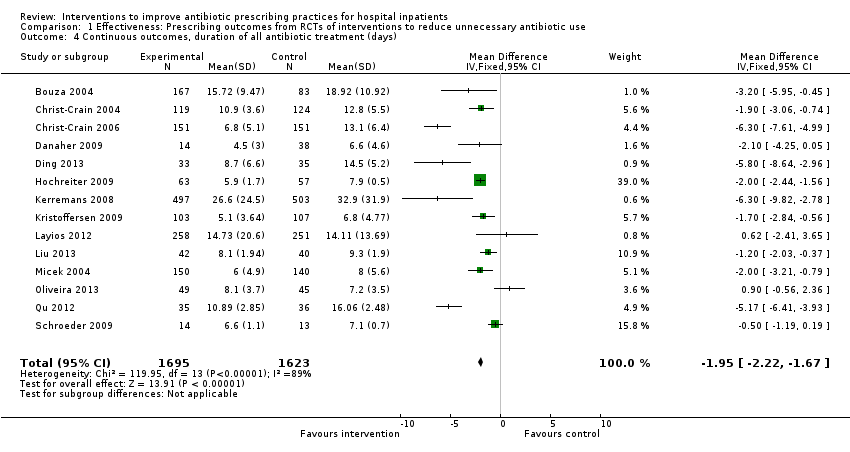
Comparison 1 Effectiveness: Prescribing outcomes from RCTs of interventions to reduce unnecessary antibiotic use, Outcome 4 Continuous outcomes, duration of all antibiotic treatment (days).

Comparison 1 Effectiveness: Prescribing outcomes from RCTs of interventions to reduce unnecessary antibiotic use, Outcome 5 Continuous outcomes, duration of all antibiotic treatment with results of cluster RCTs adjusted by inflation factor.

Comparison 1 Effectiveness: Prescribing outcomes from RCTs of interventions to reduce unnecessary antibiotic use, Outcome 6 Continuous outcomes, low or medium 'Risk of bias' studies only.

Comparison 1 Effectiveness: Prescribing outcomes from RCTs of interventions to reduce unnecessary antibiotic use, Outcome 7 Continuous outcome, consumption of targeted antibiotic only, standardised mean reduction (original outcome cost, days or DDD).
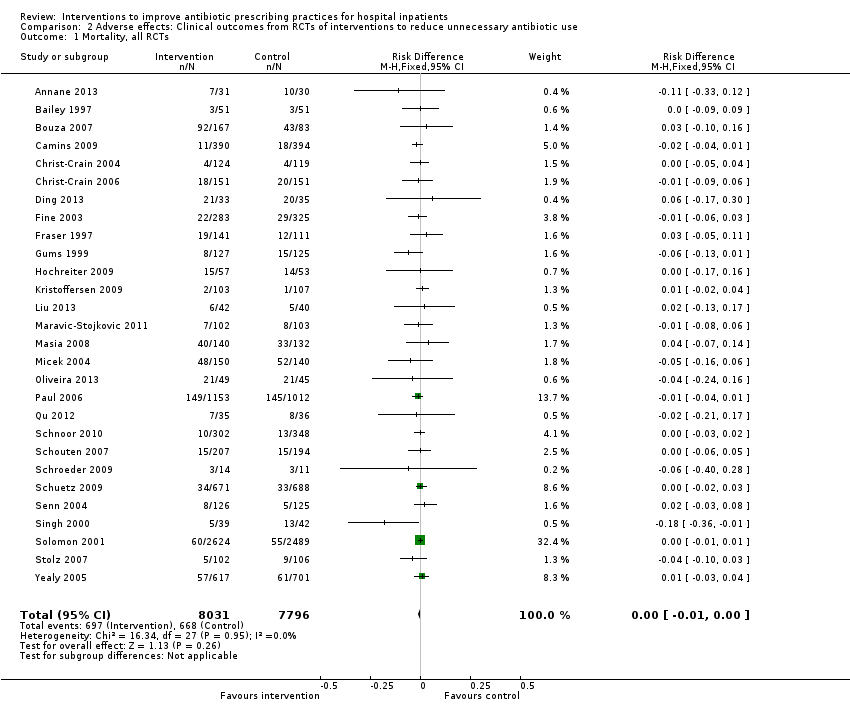
Comparison 2 Adverse effects: Clinical outcomes from RCTs of interventions to reduce unnecessary antibiotic use, Outcome 1 Mortality, all RCTs.

Comparison 2 Adverse effects: Clinical outcomes from RCTs of interventions to reduce unnecessary antibiotic use, Outcome 2 Mortality, all RCTs with results of cluster RCTs adjusted by inflation factor.
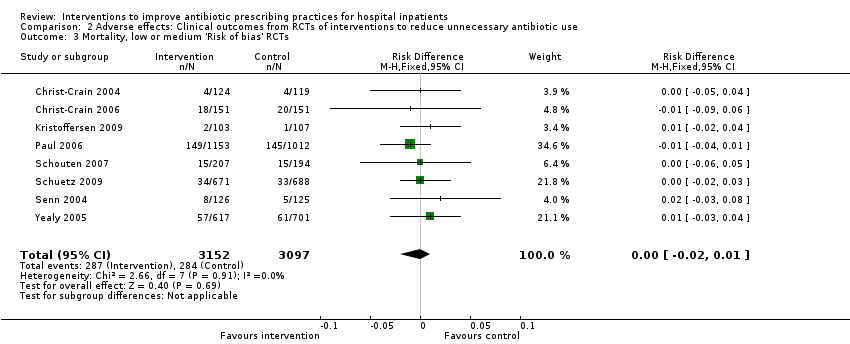
Comparison 2 Adverse effects: Clinical outcomes from RCTs of interventions to reduce unnecessary antibiotic use, Outcome 3 Mortality, low or medium 'Risk of bias' RCTs.

Comparison 2 Adverse effects: Clinical outcomes from RCTs of interventions to reduce unnecessary antibiotic use, Outcome 4 Length of stay, all RCTs.
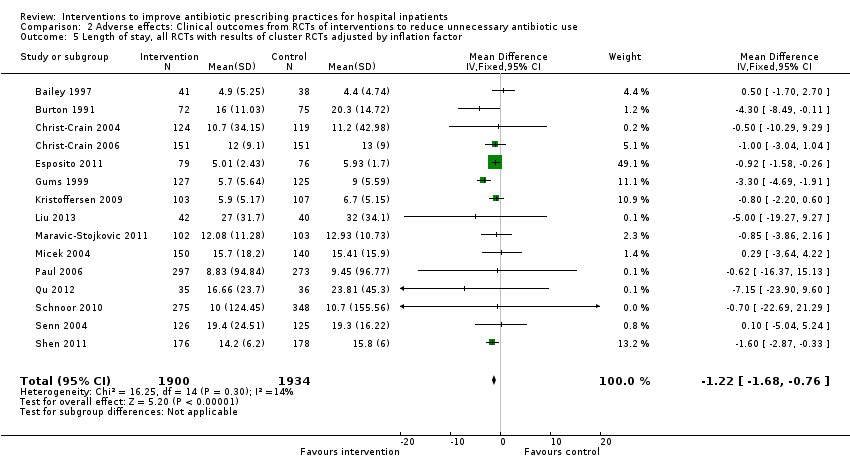
Comparison 2 Adverse effects: Clinical outcomes from RCTs of interventions to reduce unnecessary antibiotic use, Outcome 5 Length of stay, all RCTs with results of cluster RCTs adjusted by inflation factor.
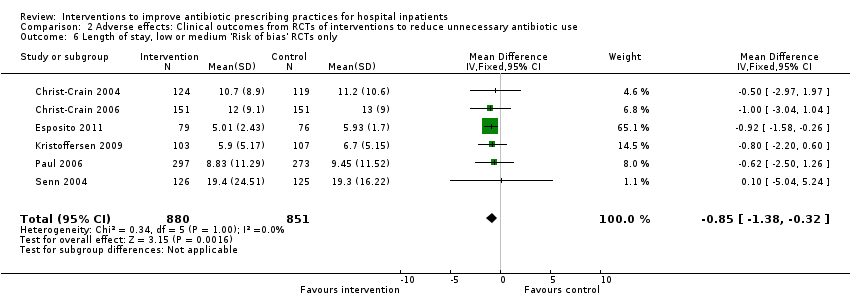
Comparison 2 Adverse effects: Clinical outcomes from RCTs of interventions to reduce unnecessary antibiotic use, Outcome 6 Length of stay, low or medium 'Risk of bias' RCTs only.
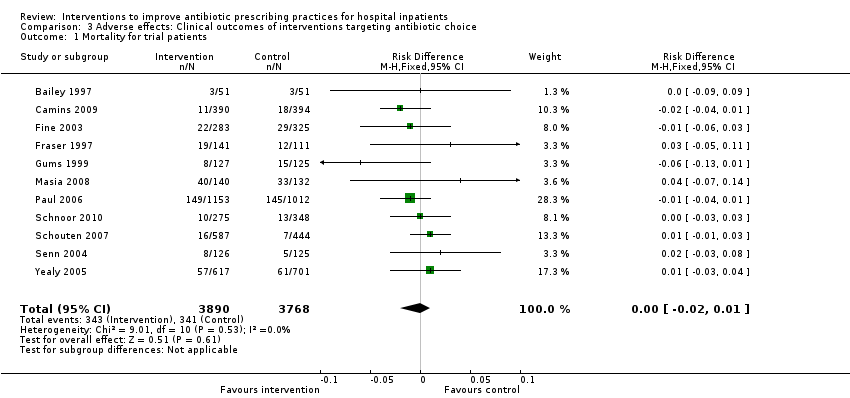
Comparison 3 Adverse effects: Clinical outcomes of interventions targeting antibiotic choice, Outcome 1 Mortality for trial patients.

Comparison 3 Adverse effects: Clinical outcomes of interventions targeting antibiotic choice, Outcome 2 Length of stay for trial patients.

Comparison 4 Adverse effects: Clinical outcomes of interventions targeting antibiotic exposure, Outcome 1 Mortality for trial patients.

Comparison 4 Adverse effects: Clinical outcomes of interventions targeting antibiotic exposure, Outcome 2 Length of stay for trial patients.

Comparison 5 Modifiers of intended effect: Comparison of enabling interventions with and without feedback, Outcome 1 Enablement with feedback.

Comparison 5 Modifiers of intended effect: Comparison of enabling interventions with and without feedback, Outcome 2 Enablement without feedback.
| Patient or population: adults or children undergoing inpatient antibiotic prophylaxis or treatment Settings: mainly high‐income countries (North America or Western Europe) Intervention: any intervention targeting healthcare professionals that aimed to improve antibiotic prescribing to hospital inpatients Comparison: usual care (varied across studies) | |||||
| Effectiveness: prescribing outcomes from RCTs | |||||
| Outcomes | Absolute effect* | No of participants (No of studies) | Certainty of the evidence (GRADE) | Comments | |
| Without intervention | With intervention | ||||
| Proportion of participants who were treated according to antibiotic prescribing guidelines Follow‐up to end of study | 43 per 100 | 58 per 100 | 23,394 participants (29 RCTs) | ⊕⊕⊕⊕ | We have graded the certainty of evidence as high because heterogeneity was explained by prespecified effect modifiers (see below). The intervention effect varied between the studies, but the direction of effect was consistent. Restricting the analysis to studies at low risk of bias gave a similar result (RD 11%, 95% CI 10% to 12%). |
| Difference: 15 more participants per 100 (95% CI 15 to 23) received appropriate treatment following intervention. | |||||
| Duration of all antibiotic treatment | 11.0 days | 9.1 days | 3318 participants (14 RCTs) | ⊕⊕⊕⊕ | |
| Difference: 1.95 fewer days per participant (95% CI 2.22 to 1.67) | |||||
| Mortality Follow‐up to end of study | 11 per 100 | 11 per 100 | 15,827 participants 28 (RCTs) | ⊕⊕⊕⊝1 | Mortality and length of stay were measured to determine the impact of reduced antibiotic use on clinical outcomes. The results were similar for studies that targeted antibiotic choice or exposure. Only 1 of the interventions in the RCTs with mortality or length‐of‐stay outcomes had a restrictive component (Singh 2000). This evidence is therefore at high risk of indirectness because 7 studies in the next section of the table (see below) raise concerns about the safety of restrictive interventions. Moreover, the ITS studies showed that restrictive components were included in 42 (34%) of 123 hospital interventions. |
| Difference: 0 more deaths per 100 participants (95% CI 1 to 0 fewer) | |||||
| Mean length of hospital stay per participant | 12.9 days | 11.8 days | 3834 participants 15 (RCTs) | ⊕⊕⊕⊝1 | |
| Difference: 1.1 fewer days per participant (95% CI 1.5 to 0.7 fewer) | |||||
| Delay in treatment | Restrictive interventions increased the risk of delay in all 3 studies. The risk to patients resulted in termination of the RCT by the Trial Monitoring Committee. | 1 RCT, 2 cohort | ⊕⊕⊝⊝2 | The evidence from these 7 studies of unintended consequences raises concerns about the directness of the evidence of safety from the 29 RCTs in the previous section of the table (see above). | |
| Negative professional culture | Loss of trust in infection specialists because of failure to record approvals for restricted drugs or provide warning about stopping treatment Misleading or inaccurate information from prescribers in order to meet criteria for restricted drugs. In 1 hospital, misdiagnosis of hospital‐acquired infection was large enough to trigger an outbreak investigation. | 1 case control, 2 cohort, 1 qualitative | ⊕⊕⊖⊖3 | ||
| Effect modifiers (heterogeneity) for immediate effect of intervention on prescribing outcomes: | |||||
| Effect modifier | Adjusted effect in meta‐regression | Number of studies | Certainty of the evidence (GRADE) | Comments | |
| Enablement | 15.12 (8.45 to 21.8) | 29 RCTs | ⊕⊕⊕⊕ | The effect of enablement and restriction is similar in the RCTs and ITS studies. Of the 29 RCTs, only 8 (31%) of interventions were hospital‐wide, the majority being in single units. In contrast, 64 (70%) of the interventions in ITS studies were hospital‐wide. | |
| 12.86 (4.11 to 21.6) | 91 ITS | ||||
| Restriction | 34.91 (13.52 to 56.29) | 29 RCTs | ⊕⊕⊕⊕ | ||
| 24.69 (13.74 to 35.64) | 91 ITS | ||||
| Addition of feedback to enablement | 10.88 (7.16 to 19.32) | 23 RCTs | ⊕⊕⊕⊝2 | Feedback was included in 4 (17%) of 23 RCTs and 20 (47%) of 43 ITS studies with interventions that included enablement. There were not enough interventions with goal setting and action planning to analyse as effect modifiers. | |
| 15.63 (0.56 to 30.70) | 43 ITS | ||||
| Addition of enablement to restriction | 38.36 (18.94 to 57.78) | 29 ITS | ⊕⊕⊖⊖3 | Enablement was included in 13 (45%) of 29 ITS studies with restrictive interventions. | |
| *The risk WITHOUT the intervention is based on the median control group risk across studies. The corresponding risk WITH the intervention (and the 95% confidence interval for the difference) is based on the overall relative effect (and its 95% confidence interval). | |||||
| GRADE Working Group grades of evidence | |||||
| Details of five GRADE criteria for all outcomes from RCTs are in Appendix 2. 1We downgraded the evidence to moderate because of indirectness. | |||||
| Intervention Function | Definition | Intervention components |
| Education | Increasing knowledge or understanding | Educational meetings; Dissemination of educational materials; Educational outreach |
| Persuasion | Using communication to induce positive or negative feelings or to stimulate action | Educational outreach by academic detailing or review and recommend change |
| Restriction | Using rules to reduce the opportunity to engage in the target behaviour (or increase the target behaviour by reducing the opportunity to engage in competing behaviours) | Restrictive |
| Environmental restructuring | Changing the physical context | Reminders (physical) such as posters, pocket‐size or credit card‐size summaries or on laboratory test reports; Structural (e.g. new laboratory tests or rapid reporting of results) |
| Enablement | Increasing means/reducing barriers to increase capability or opportunity | Audit and feedback; Decision support through computerised systems or through circumstantial reminders that were triggered by actions or events related to the targeted behaviour; Educational outreach by review and recommend change |
| Study | Prescribing target | Restriction | Design of analysis | Effect estimate | 95% CI |
| Choice of drug | No | Cohort | Incidence rate ratio 1.1 | 0.9 to 1.5 | |
| Choice of drug | No | Cohort | Increase by 1.4% | ‐1.2% to 4.1% | |
| Choice of drug | Yes | ITS, segmented regression | Change in slope ‐0.0172 | No data | |
| Choice of drug | Yes | Cohort | +0.43 per 1000 OBD | No data | |
| *Mortality was measured in all patients in the hospital rather than just those patients who were the targets of the interventions. CI: confidence interval | |||||
| Study | Prescribing target | Restrictive | Design of analysis | Effect estimate | 95% CI |
| Exposure, % treated | No | Cohort | ‐0.5 days | No data | |
| Choice of drug | No | Cohort | ‐0.1 days | ‐0.49 to +0.29 | |
| *Length of stay was measured in all patients in the hospital rather than just those patients who were the targets of the interventions. CI: confidence interval | |||||
| Study | Prescribing target | Design of analysis | Effect measure | Effect estimate | 95% CI |
| Antibiotic choice | ITS, segmented regression | Risk of postoperative acute kidney injury | Increase 98% | 93.8% to 94.2% | |
| Exposure, duration | Cohort | Surgical‐site infection | Decrease 0.8% | ‐2.2% to 0.6% | |
| Time to first antibiotic dose | Cohort | Left without being seen rate | Decrease 0.4% | No data | |
| CI: confidence interval | |||||
| Study | Design | Patients | Intended target | Unintended consequence | Effect estimate | 95% CI |
| Interventions with a restrictive component | ||||||
| Qualitative | 36 physicians | Reduce unnecessary use of restricted antibiotics | Inaccurate feedback | Not quantified; qualitative study | ||
| Case control | Not clear | Increase in physician‐based diagnosis of nosocomial infection | No denominator data | |||
| Cohort | 120 | Failure to warn prescribers about discontinuation | — | — | ||
| Cohort | 222 | Reduce unnecessary laboratory tests | Delay in TFAD (HR > 1 shows delay less likely in intervention period) | Multivariate HR 1.56 | 1.17 to 2.07 | |
| Cross‐sectional | 15,440 | Reduce unnecessary use of restricted antibiotics | Orders for restricted antibiotics (% all orders) from 10 to 11 pm vs all other hours | — | — | |
| Cohort | 360 | % appropriate orders 10 to 11 pm vs 9 to 10 pm | ‐23.7% | ‐31.8% to ‐15.5% | ||
| Cohort | 200 | Risk of inaccurate information in orders judged inappropriate vs appropriate | OR 2.2 | 1.0 to 4.4 | ||
| Cohort | 3251 | Risk of 1‐hour delay in TFAD | OR 1.5 | 1.2 to 1.8 | ||
| Risk of 2‐hour delay in TFAD | OR 1.8 | 1.4 to 2.2 | ||||
| Interventions with no restrictive component | ||||||
| Cohort | 13,042 | Reduce time to first antibiotic dose for patients with community‐acquired pneumonia | % CAP diagnoses | 1% increase | No denominator data | |
| Cohort | 518 | % correct CAP diagnoses | ‐7.9% decrease | ‐15.4% to ‐0.4% | ||
| Cohort | 548 | % correct CAP diagnoses | ‐16.0% decrease | ‐7.6% to ‐24.4% | ||
| CAP: community‐acquired pneumonia | ||||||
| Intervention function and components | RCT | ITS |
| Enablement | 24 studies | 59 studies |
| Number of enabling or restrictive intervention components | 27 | 76 |
| Studies with > 1 Enabling intervention component | 2 8%* | 19 32%* |
| Audit and feedback | 4 17% | 24 41% |
| Computerised decision support | 1 4% | 3 5% |
| Circumstantial reminders | 16 67% | 18 31% |
| Review and recommend change | 6 25% | 31 53% |
| Restriction | 2 studies | 29 studies |
| Number of Restrictive intervention components | 3 | 41 |
| Studies with > 1 Restrictive intervention component | 1 50% | 10 34% |
| Expert approval | 1 50% | 18 62% |
| Compulsory order form | 1 50% | 7 24% |
| Removal | 0 | 10 34% |
| Review and make change | 1 50% | 6 21% |
| No Enablement or Restriction | 4 studies | 18 studies |
| Number of intervention components | 6 | 25 |
| Studies with > 1 intervention component | 2 50% | 6 33% |
| Educational materials or meetings | 3 75% | 16 89% |
| Educational outreach (academic detailing) | 1 25% | 6 33% |
| Physical reminders | 1 25% | 2 11% |
| Structural intervention | 1 25% | 1 6% |
| *The denominator for all percentages is the number of studies for each intervention function. One RCT, Strom 2010, and 16 ITS studies (Figure 11) included both enabling and restrictive intervention components. ITS: interrupted time series | ||
| Study | Intervention function | Intervention effect (95% CI) | Time intervention was in place | Effect of removal (95% CI) |
| Restriction | ‐87.5% ‐115.4 to ‐59.7 | 6 months | 398.9% 238.2 to 559.5 | |
| Restriction | ‐23.1% ‐53.7 to +7.4 | 9 months | 6.0% ‐23.4 to 35.4 | |
| Enablement | ‐28.6% ‐46.5 to ‐10.6 | 7 years | 31.0% 6.8 to 55.3 | |
| Restriction | No data | “long‐standing” | 301.2% 230.9 to 371.5 | |
| Restriction | 2 years | 255.8% 194.7 to 316.9 | ||
| CI: confidence interval | ||||
| Study | Design | Microbial outcome | Reason not in meta‐analysis |
| RCT | Colonisation with MRSA (nasal swab) and GNRB (rectal swabs) | Not comparable with any other RCT | |
| RCT | Number of cases of Clostridium difficile | Not in prescribing meta‐analysis | |
| RCT | Secondary infection and/or colonisation with multidrug‐resistant bacteria in the 6 months following randomisation | Not in prescribing meta‐analysis. It is impossible to assess the impact of the intervention on colonisation or infection with bacteria resistant to specific antibiotics. | |
| RCT | CDI and infection with antibiotic resistant organisms cases/1000 OBD | Not in prescribing meta‐analysis | |
| RCT | Number of participants with "antimicrobial resistance and/or superinfections" from randomisation until discharge from hospital | It is impossible to assess the impact of the intervention on colonisation or infection with bacteria resistant to specific antibiotics. | |
| CDI: Clostridium difficile infection | |||
| Prescribing target | Microbial outcome | N | Study ID |
| Cephalosporins | GNRB | 8 | Grohs 2014; Kim 2008; Knudsen 2014; Lee 2007; McNulty 1997; Meyer 2009; Petrikkos 2007; Tangdén 2011 |
| MRSA | 1 | ||
| Carbapenems | GNRB | 1 | |
| Fluoroquinolones | GNRB | 3 | |
| MRSA | 1 | ||
| High‐risk antibiotics | CDI | 6 | Aldeyab 2012; Chan 2011; Dancer 2013; Fowler 2007; Talpaert 2011; Valiquette 2007 |
| GNRB | 4 | ||
| MRSA | 6 | Aldeyab 2014; Ananda‐Rajah 2010; Chan 2011; Dancer 2013; Fowler 2007; Liebowitz 2008 | |
| Total antibiotic use | CDI | 2 | |
| MRSA | 1 | ||
| Vancomycin | VRE | 1 | |
| Total microbial | 34* | ||
| *Some studies had more than one microbial outcome, so the total is 34 microbial outcomes from 26 studies. CDI: Clostridium difficile infection | |||
| Outcome or subgroup title | No. of studies | No. of participants | Statistical method | Effect size |
| 1 Dichotomous outcomes, increase in desired practice Show forest plot | 29 | 23394 | Risk Difference (M‐H, Fixed, 95% CI) | 0.15 [0.14, 0.16] |
| 2 Dichotomous outcomes, all RCTs with results of cluster RCTs adjusted by inflation factor Show forest plot | 29 | 5802 | Risk Difference (M‐H, Fixed, 95% CI) | 0.17 [0.15, 0.19] |
| 3 Dichotomous outcomes, low or medium 'Risk of bias' studies only Show forest plot | 15 | 13086 | Risk Difference (M‐H, Fixed, 95% CI) | 0.11 [0.10, 0.12] |
| 4 Continuous outcomes, duration of all antibiotic treatment (days) Show forest plot | 14 | 3318 | Mean Difference (IV, Fixed, 95% CI) | ‐1.95 [‐2.22, ‐1.67] |
| 5 Continuous outcomes, duration of all antibiotic treatment with results of cluster RCTs adjusted by inflation factor Show forest plot | 14 | 3318 | Mean Difference (IV, Fixed, 95% CI) | ‐1.95 [‐2.23, ‐1.67] |
| 6 Continuous outcomes, low or medium 'Risk of bias' studies only Show forest plot | 3 | 755 | Mean Difference (IV, Fixed, 95% CI) | ‐3.06 [‐3.76, ‐2.37] |
| 7 Continuous outcome, consumption of targeted antibiotic only, standardised mean reduction (original outcome cost, days or DDD) Show forest plot | 4 | 1053 | Std. Mean Difference (IV, Fixed, 95% CI) | ‐0.25 [‐0.37, ‐0.13] |
| Outcome or subgroup title | No. of studies | No. of participants | Statistical method | Effect size |
| 1 Mortality, all RCTs Show forest plot | 28 | 15827 | Risk Difference (M‐H, Fixed, 95% CI) | ‐0.00 [‐0.01, 0.00] |
| 2 Mortality, all RCTs with results of cluster RCTs adjusted by inflation factor Show forest plot | 28 | 8332 | Risk Difference (M‐H, Fixed, 95% CI) | ‐0.01 [‐0.02, 0.01] |
| 3 Mortality, low or medium 'Risk of bias' RCTs Show forest plot | 8 | 6249 | Risk Difference (M‐H, Fixed, 95% CI) | ‐0.00 [‐0.02, 0.01] |
| 4 Length of stay, all RCTs Show forest plot | 15 | 3834 | Mean Difference (IV, Fixed, 95% CI) | ‐1.12 [‐1.54, ‐0.70] |
| 5 Length of stay, all RCTs with results of cluster RCTs adjusted by inflation factor Show forest plot | 15 | 3834 | Mean Difference (IV, Fixed, 95% CI) | ‐1.22 [‐1.68, ‐0.76] |
| 6 Length of stay, low or medium 'Risk of bias' RCTs only Show forest plot | 6 | 1731 | Mean Difference (IV, Fixed, 95% CI) | ‐0.85 [‐1.38, ‐0.32] |
| Outcome or subgroup title | No. of studies | No. of participants | Statistical method | Effect size |
| 1 Mortality for trial patients Show forest plot | 11 | 7658 | Risk Difference (M‐H, Fixed, 95% CI) | ‐0.00 [‐0.02, 0.01] |
| 2 Length of stay for trial patients Show forest plot | 7 | 2276 | Mean Difference (IV, Fixed, 95% CI) | ‐1.50 [‐2.16, ‐0.83] |
| Outcome or subgroup title | No. of studies | No. of participants | Statistical method | Effect size |
| 1 Mortality for trial patients Show forest plot | 18 | 9173 | Risk Difference (M‐H, Fixed, 95% CI) | ‐0.00 [‐0.01, 0.01] |
| 2 Length of stay for trial patients Show forest plot | 8 | 1558 | Mean Difference (IV, Fixed, 95% CI) | ‐0.87 [‐1.42, ‐0.33] |
| Outcome or subgroup title | No. of studies | No. of participants | Statistical method | Effect size |
| 1 Enablement with feedback Show forest plot | 4 | 3747 | Risk Difference (M‐H, Fixed, 95% CI) | 0.19 [0.16, 0.22] |
| 2 Enablement without feedback Show forest plot | 7 | 1827 | Risk Difference (M‐H, Fixed, 95% CI) | 0.13 [0.09, 0.17] |