| Patient or population: adults or children undergoing inpatient antibiotic prophylaxis or treatment Settings: mainly high‐income countries (North America or Western Europe) Intervention: any intervention targeting healthcare professionals that aimed to improve antibiotic prescribing to hospital inpatients Comparison: usual care (varied across studies) |
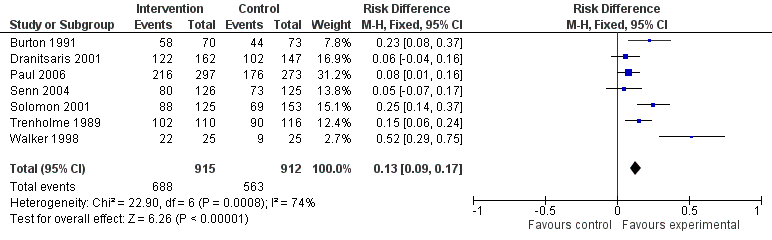
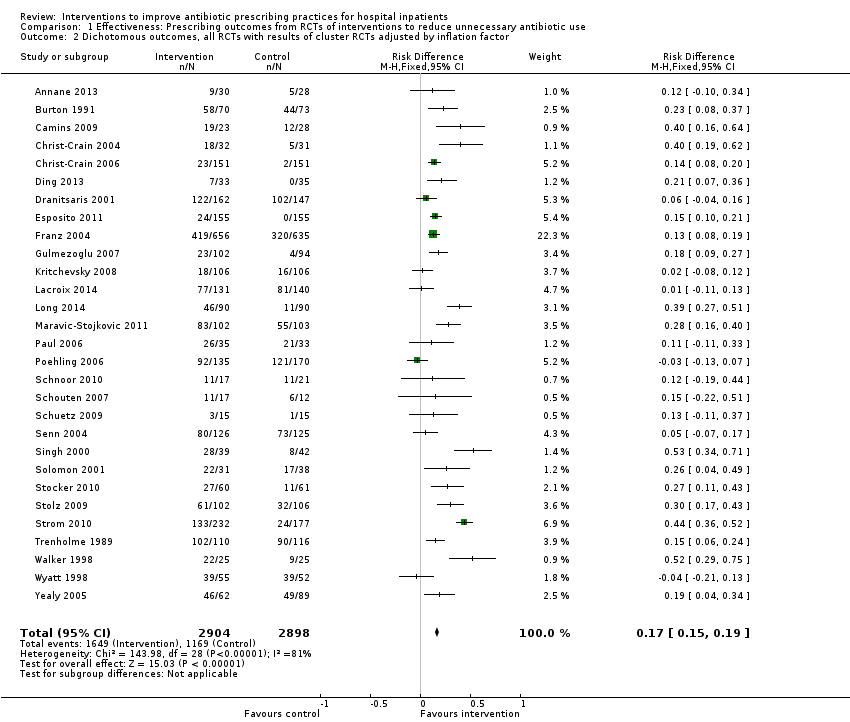
| Proportion of participants who were treated according to antibiotic prescribing guidelines Follow‐up to end of study | 43 per 100 | 58 per 100 | 23,394 participants (29 RCTs) | ⊕⊕⊕⊕
High | We have graded the certainty of evidence as high because heterogeneity was explained by prespecified effect modifiers (see below). The intervention effect varied between the studies, but the direction of effect was consistent. Restricting the analysis to studies at low risk of bias gave a similar result (RD 11%, 95% CI 10% to 12%). |
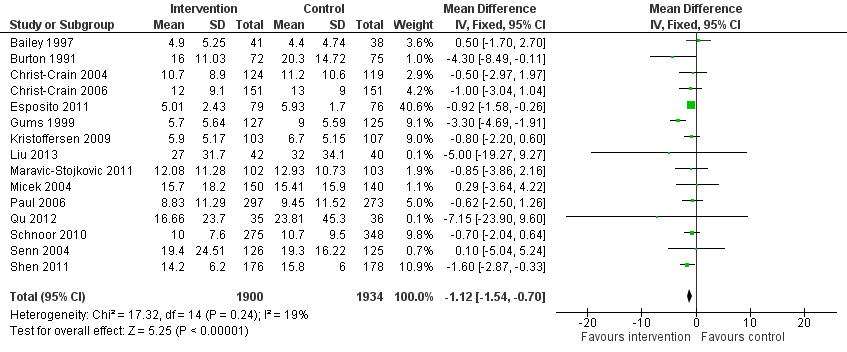
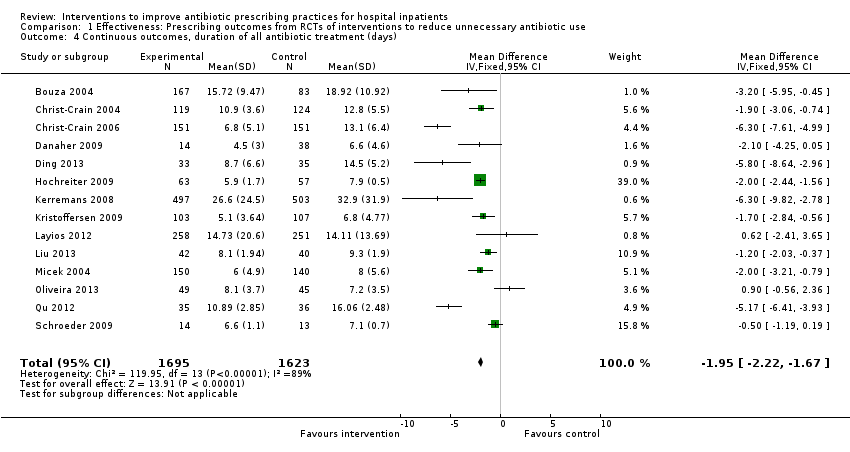
| Duration of all antibiotic treatment | 11.0 days | 9.1 days | 3318 participants (14 RCTs) | ⊕⊕⊕⊕
High | |
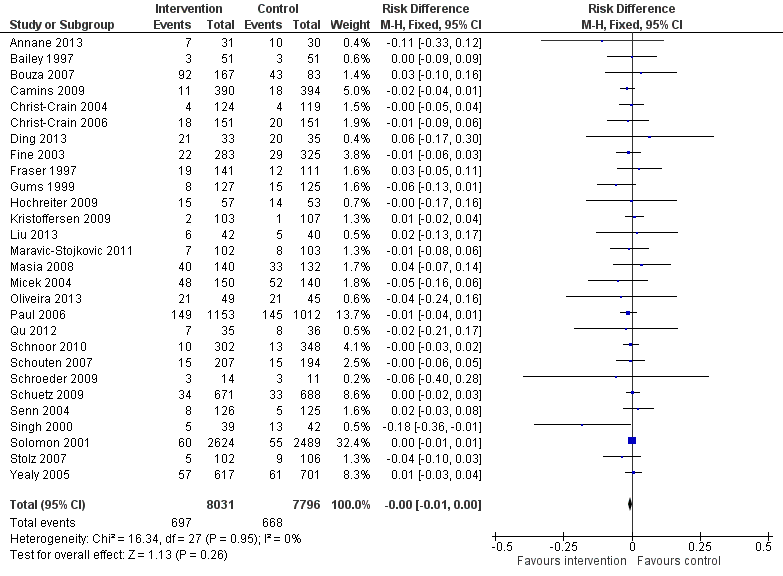
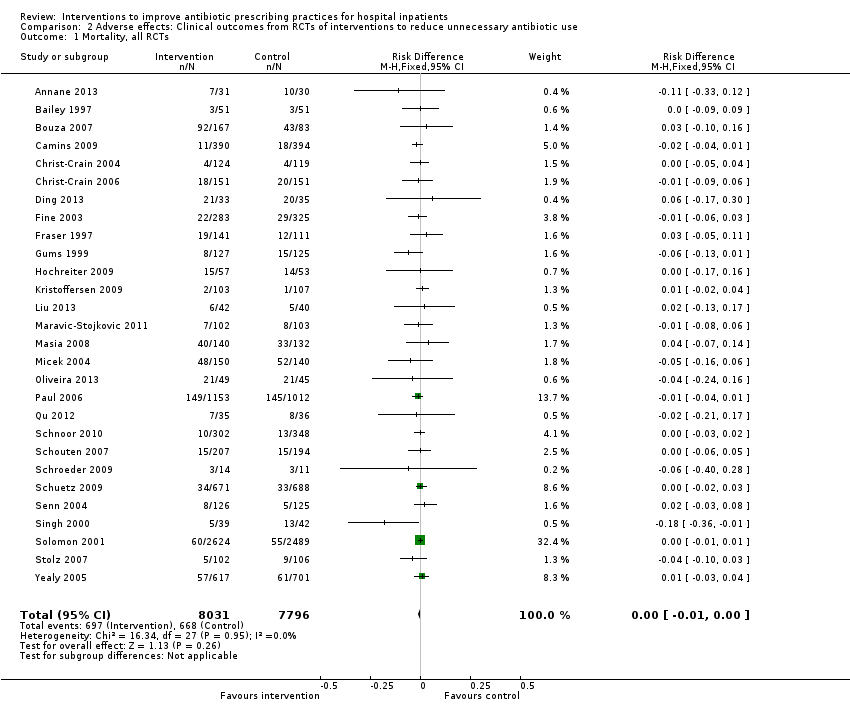
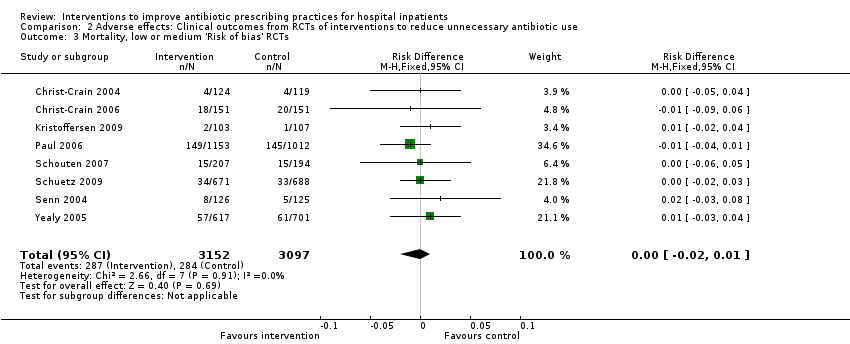
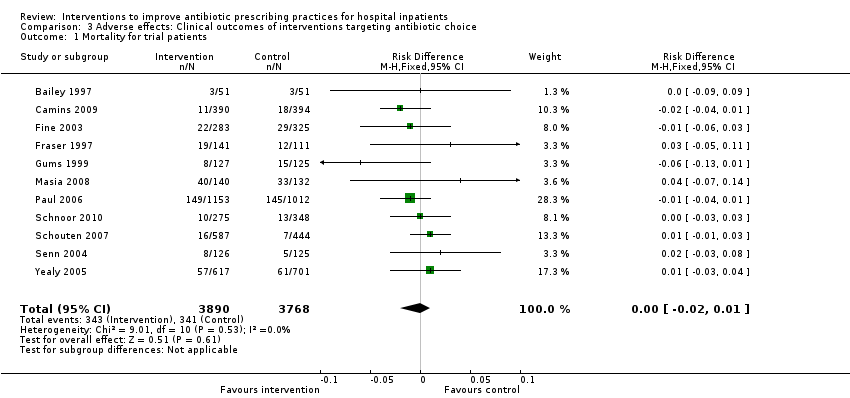
| Mortality Follow‐up to end of study | 11 per 100 | 11 per 100 | 15,827 participants 28 (RCTs) | ⊕⊕⊕⊝1
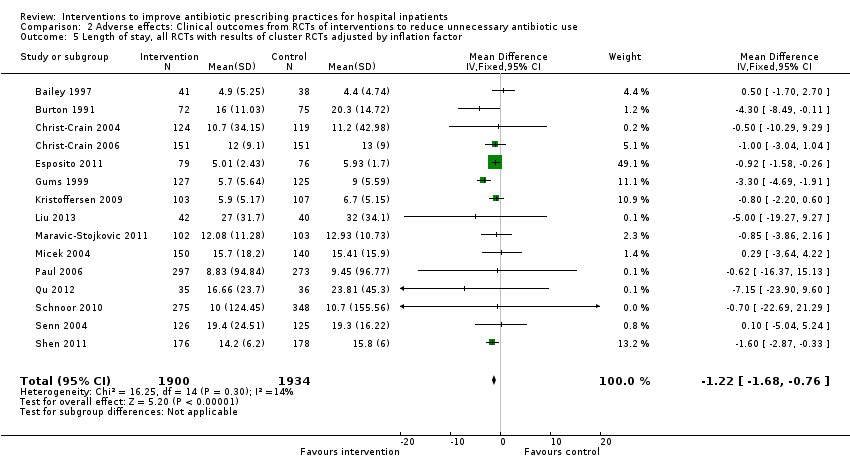
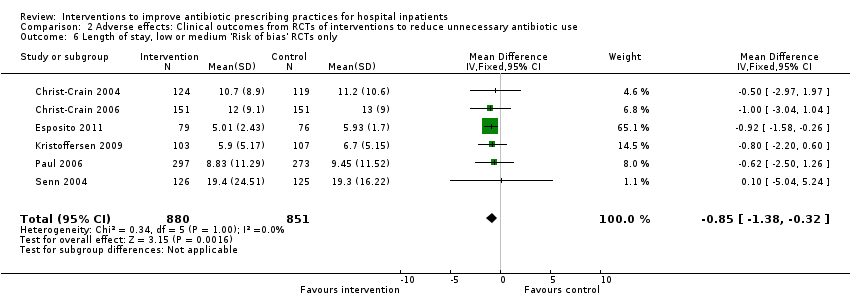
Moderate | Mortality and length of stay were measured to determine the impact of reduced antibiotic use on clinical outcomes. The results were similar for studies that targeted antibiotic choice or exposure. Only 1 of the interventions in the RCTs with mortality or length‐of‐stay outcomes had a restrictive component (Singh 2000). This evidence is therefore at high risk of indirectness because 7 studies in the next section of the table (see below) raise concerns about the safety of restrictive interventions. Moreover, the ITS studies showed that restrictive components were included in 42 (34%) of 123 hospital interventions. |
| Mean length of hospital stay per participant | 12.9 days | 11.8 days | 3834 participants 15 (RCTs) | ⊕⊕⊕⊝1
Moderate |
| Delay in treatment | Restrictive interventions increased the risk of delay in all 3 studies. The risk to patients resulted in termination of the RCT by the Trial Monitoring Committee. | 1 RCT, 2 cohort | ⊕⊕⊝⊝2
Low | The evidence from these 7 studies of unintended consequences raises concerns about the directness of the evidence of safety from the 29 RCTs in the previous section of the table (see above). |
| Negative professional culture | Loss of trust in infection specialists because of failure to record approvals for restricted drugs or provide warning about stopping treatment Misleading or inaccurate information from prescribers in order to meet criteria for restricted drugs. In 1 hospital, misdiagnosis of hospital‐acquired infection was large enough to trigger an outbreak investigation. | 1 case control, 2 cohort, 1 qualitative | ⊕⊕⊖⊖3
Low |
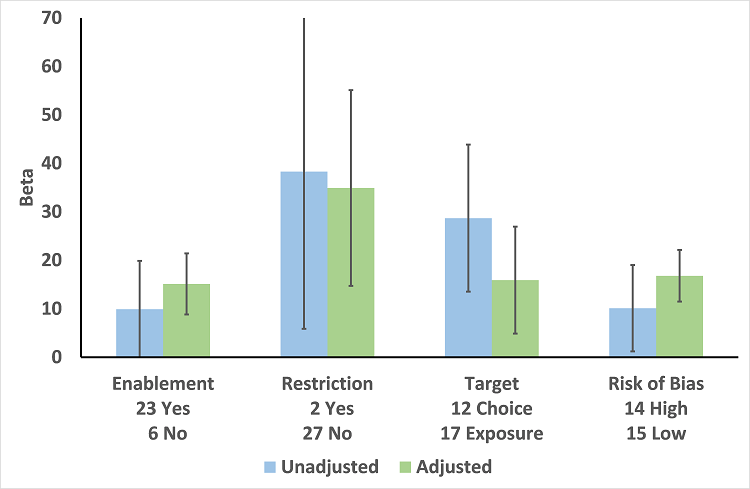
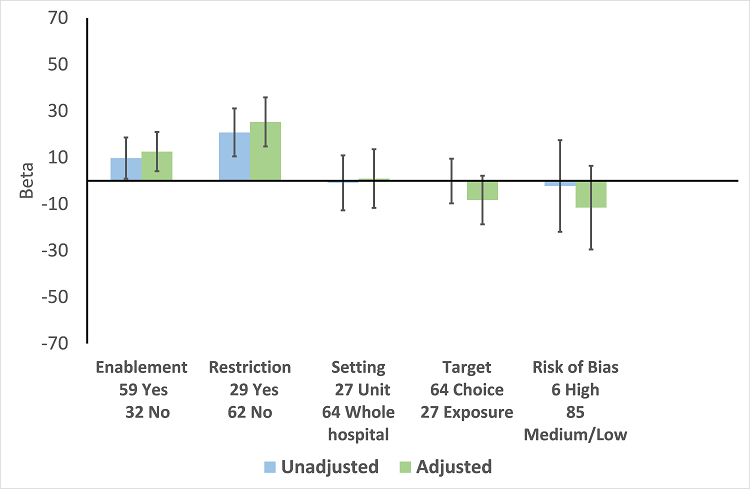
| Enablement | 15.12 (8.45 to 21.8) | 29 RCTs | ⊕⊕⊕⊕
High | The effect of enablement and restriction is similar in the RCTs and ITS studies. Of the 29 RCTs, only 8 (31%) of interventions were hospital‐wide, the majority being in single units. In contrast, 64 (70%) of the interventions in ITS studies were hospital‐wide. |
| 12.86 (4.11 to 21.6) | 91 ITS |
| Restriction | 34.91 (13.52 to 56.29) | 29 RCTs | ⊕⊕⊕⊕
High |
| 24.69 (13.74 to 35.64) | 91 ITS |
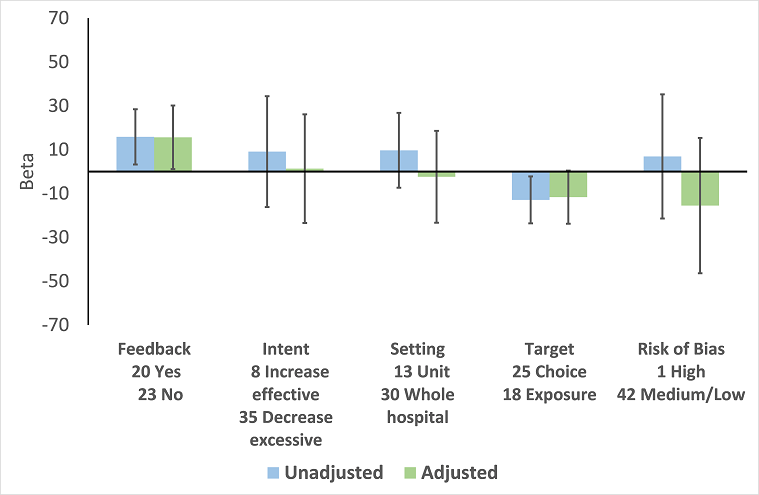
| Addition of feedback to enablement | 10.88 (7.16 to 19.32) | 23 RCTs | ⊕⊕⊕⊝2
Moderate | Feedback was included in 4 (17%) of 23 RCTs and 20 (47%) of 43 ITS studies with interventions that included enablement. There were not enough interventions with goal setting and action planning to analyse as effect modifiers. |
| 15.63 (0.56 to 30.70) | 43 ITS |
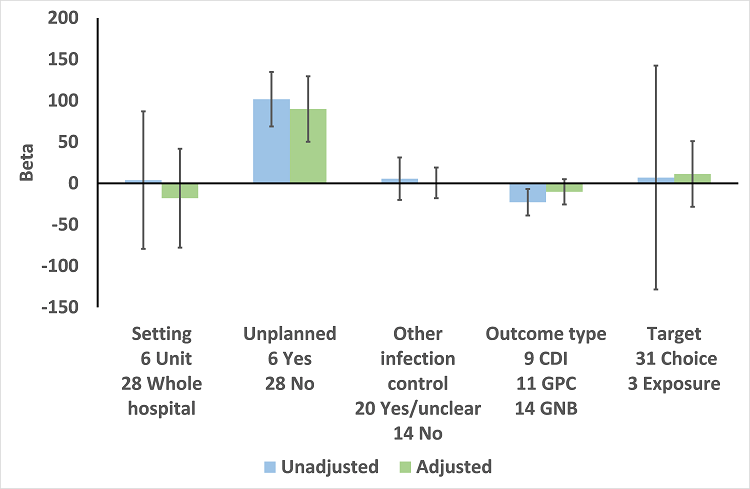
| Addition of enablement to restriction | 38.36 (18.94 to 57.78) | 29 ITS | ⊕⊕⊖⊖3
Low | Enablement was included in 13 (45%) of 29 ITS studies with restrictive interventions. |
| *The risk WITHOUT the intervention is based on the median control group risk across studies. The corresponding risk WITH the intervention (and the 95% confidence interval for the difference) is based on the overall relative effect (and its 95% confidence interval).
CI: confidence interval; ITS: interrupted time series; RCT: randomised controlled trial; RD: risk difference |
| GRADE Working Group grades of evidence
High certainty: Further research is very unlikely to change our confidence in the estimate of effect.
Moderate certainty: Further research is likely to have an important impact on our confidence in the estimate of effect and may change the estimate.
Low certainty: Further research is very likely to have an important impact on our confidence in the estimate of effect and is likely to change the estimate.
Very low certainty: We are very uncertain about the estimate. |