| 1 Mean pain at rest (100 point scale) Show forest plot | 3 | | Mean Difference (IV, Random, 95% CI) | Subtotals only |
|
| 1.1 4‐6 weeks | 3 | 446 | Mean Difference (IV, Random, 95% CI) | ‐9.42 [‐20.70, 1.86] |
| 1.2 12 weeks | 1 | 271 | Mean Difference (IV, Random, 95% CI) | 1.0 [‐5.43, 7.43] |
| 1.3 24 weeks | 1 | 100 | Mean Difference (IV, Random, 95% CI) | ‐25.2 [‐30.59, ‐19.81] |
| 1.4 12 months | 1 | 271 | Mean Difference (IV, Random, 95% CI) | 7.0 [2.83, 11.17] |
| 2 Mean pain with resisted wrist extension (Thomsen test)(100 point scale) Show forest plot | 4 | | Mean Difference (IV, Random, 95% CI) | Subtotals only |
|
| 2.1 1 week | 1 | 114 | Mean Difference (IV, Random, 95% CI) | ‐8.42 [‐17.31, 0.47] |
| 2.2 4 weeks | 1 | 114 | Mean Difference (IV, Random, 95% CI) | ‐11.48 [‐21.08, ‐1.88] |
| 2.3 6 weeks | 2 | 371 | Mean Difference (IV, Random, 95% CI) | ‐16.20 [‐47.75, 15.36] |
| 2.4 8 weeks | 1 | 114 | Mean Difference (IV, Random, 95% CI) | ‐14.04 [‐23.95, ‐4.13] |
| 2.5 12 weeks | 3 | 455 | Mean Difference (IV, Random, 95% CI) | ‐9.04 [‐19.37, 1.28] |
| 2.6 24 weeks | 1 | 100 | Mean Difference (IV, Random, 95% CI) | ‐29.3 [‐35.83, ‐22.77] |
| 2.7 12 months | 1 | 271 | Mean Difference (IV, Random, 95% CI) | ‐1.0 [‐7.08, 5.08] |
| 3 Mean pain with typical daily activities Show forest plot | 2 | | Mean Difference (IV, Fixed, 95% CI) | Subtotals only |
|
| 3.1 4‐6 weeks | 2 | 435 | Mean Difference (IV, Fixed, 95% CI) | ‐1.78 [‐6.70, 3.14] |
| 3.2 8 weeks | 1 | 165 | Mean Difference (IV, Fixed, 95% CI) | ‐8.40 [‐16.20, ‐0.60] |
| 3.3 12 weeks | 1 | 271 | Mean Difference (IV, Fixed, 95% CI) | 0.0 [‐7.14, 7.14] |
| 3.4 12 months | 1 | 271 | Mean Difference (IV, Fixed, 95% CI) | ‐3.0 [‐8.48, 2.48] |
| 4 Mean pain with resisted middle finger extension (100 point scale) Show forest plot | 2 | | Mean Difference (IV, Random, 95% CI) | Subtotals only |
|
| 4.1 6 weeks | 2 | 371 | Mean Difference (IV, Random, 95% CI) | ‐20.51 [‐56.57, 15.56] |
| 4.2 12 weeks | 1 | 271 | Mean Difference (IV, Random, 95% CI) | ‐2.0 [‐9.62, 5.62] |
| 4.3 24 weeks | 1 | 100 | Mean Difference (IV, Random, 95% CI) | ‐40.0 [‐45.52, ‐34.48] |
| 4.4 12 months | 1 | 271 | Mean Difference (IV, Random, 95% CI) | ‐1.0 [‐6.48, 4.48] |
| 5 Mean pain with resisted supination of the wrist (Mills test)(100 point scale) Show forest plot | 1 | | Mean Difference (IV, Fixed, 95% CI) | Totals not selected |
|
| 5.1 6 weeks | 1 | | Mean Difference (IV, Fixed, 95% CI) | 0.0 [0.0, 0.0] |
| 5.2 12 weeks | 1 | | Mean Difference (IV, Fixed, 95% CI) | 0.0 [0.0, 0.0] |
| 5.3 12 months | 1 | | Mean Difference (IV, Fixed, 95% CI) | 0.0 [0.0, 0.0] |
| 6 Number of patients with significant improvement Show forest plot | 7 | | Risk Ratio (M‐H, Fixed, 95% CI) | Subtotals only |
|
| 6.1 50% improvement in overall pain at 1 month (4 weeks) | 1 | 75 | Risk Ratio (M‐H, Fixed, 95% CI) | 1.02 [0.55, 1.90] |
| 6.2 50% improvement in night pain at 1 month (4 weeks) | 1 | 75 | Risk Ratio (M‐H, Fixed, 95% CI) | 0.75 [0.40, 1.40] |
| 6.3 Success (at least 50% improved overall pain AND pain>4cm AND no pain meds for 2/52) (5 weeks) | 1 | 60 | Risk Ratio (M‐H, Fixed, 95% CI) | 1.25 [0.62, 2.51] |
| 6.4 Success (defined as no pain/occasional discomfort and no additional Rx at 3 months) (12 weeks) | 1 | 246 | Risk Ratio (M‐H, Fixed, 95% CI) | 1.02 [0.66, 1.56] |
| 6.5 Success (defined as at least 50% improvement in pain elicited by Thomsen test ) (12 weeks) | 2 | 192 | Risk Ratio (M‐H, Fixed, 95% CI) | 2.20 [1.55, 3.12] |
| 6.6 significant improvement in pain of 3 or more points (on 10‐point VAS) (6 months) | 1 | 26 | Risk Ratio (M‐H, Fixed, 95% CI) | 10.0 [1.49, 67.29] |
| 6.7 Number with at least 50% improvement in investigator‐assessed pain and 4 or less on 10cm VAS (8 weeks) | 1 | 183 | Risk Ratio (M‐H, Fixed, 95% CI) | 1.60 [1.08, 2.37] |
| 6.8 Number with at least 50% improvement in pain with activities and 4 or less on 10 cm VAS (8 weeks) | 1 | 183 | Risk Ratio (M‐H, Fixed, 95% CI) | 1.29 [0.94, 1.78] |
| 6.9 Number with no or rare use of pain medications (8 weeks) | 1 | 183 | Risk Ratio (M‐H, Fixed, 95% CI) | 1.13 [0.94, 1.35] |
| 6.10 Success (at least 50% improvement in investigator and participant ‐assessed pain and rare pain meds)(8 weeks) | 1 | 183 | Risk Ratio (M‐H, Fixed, 95% CI) | 1.60 [0.99, 2.56] |
| 7 Failure of treatment defined by Roles and Maudsley score of 4 Show forest plot | 3 | | Risk Ratio (M‐H, Random, 95% CI) | Subtotals only |
|
| 7.1 3 weeks | 1 | 100 | Risk Ratio (M‐H, Random, 95% CI) | 0.21 [0.09, 0.50] |
| 7.2 6 weeks | 2 | 371 | Risk Ratio (M‐H, Random, 95% CI) | 0.40 [0.08, 1.91] |
| 7.3 12 weeks | 2 | 349 | Risk Ratio (M‐H, Random, 95% CI) | 0.61 [0.32, 1.16] |
| 7.4 24 weeks | 1 | 100 | Risk Ratio (M‐H, Random, 95% CI) | 0.14 [0.06, 0.33] |
| 7.5 12 months | 2 | 371 | Risk Ratio (M‐H, Random, 95% CI) | 0.44 [0.09, 2.17] |
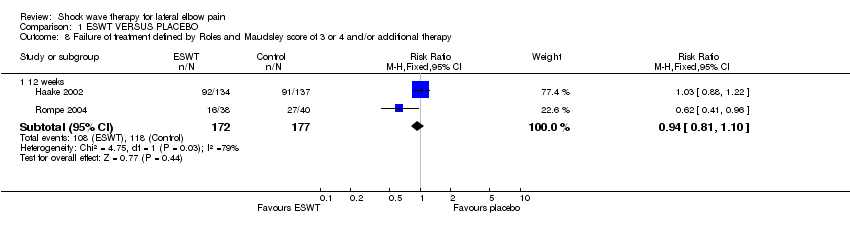
| 8 Failure of treatment defined by Roles and Maudsley score of 3 or 4 and/or additional therapy Show forest plot | 2 | | Risk Ratio (M‐H, Fixed, 95% CI) | Subtotals only |
|
| 8.1 12 weeks | 2 | 349 | Risk Ratio (M‐H, Fixed, 95% CI) | 0.94 [0.81, 1.10] |
| 9 Number of patients who eventually underwent surgical release of common extensor origin Show forest plot | 1 | | Risk Ratio (M‐H, Fixed, 95% CI) | Subtotals only |
|
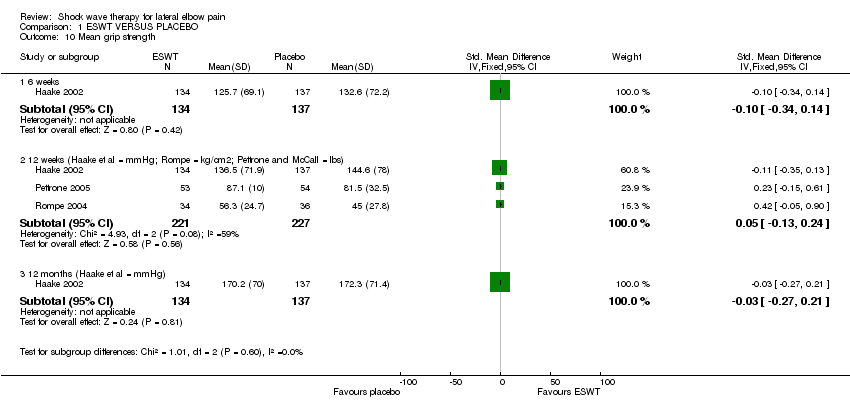
| 10 Mean grip strength Show forest plot | 3 | | Std. Mean Difference (IV, Fixed, 95% CI) | Subtotals only |
|
| 10.1 6 weeks | 1 | 271 | Std. Mean Difference (IV, Fixed, 95% CI) | ‐0.10 [‐0.34, 0.14] |
| 10.2 12 weeks (Haake et al = mmHg; Rompe = kg/cm2; Pettrone and McCall = lbs) | 3 | 448 | Std. Mean Difference (IV, Fixed, 95% CI) | 0.05 [‐0.13, 0.24] |
| 10.3 12 months (Haake et al = mmHg) | 1 | 271 | Std. Mean Difference (IV, Fixed, 95% CI) | ‐0.03 [‐0.27, 0.21] |
| 11 Mean Upper Extremity Function Scale (range 8‐80) Show forest plot | 2 | | Mean Difference (IV, Fixed, 95% CI) | Subtotals only |
|
| 11.1 1 week | 1 | 110 | Mean Difference (IV, Fixed, 95% CI) | ‐3.84 [‐9.32, 1.64] |
| 11.2 4 weeks | 1 | 108 | Mean Difference (IV, Fixed, 95% CI) | ‐7.92 [‐13.47, ‐2.37] |
| 11.3 8 weeks | 1 | 107 | Mean Difference (IV, Fixed, 95% CI) | ‐8.0 [‐13.57, ‐2.43] |
| 11.4 12 weeks | 2 | 177 | Mean Difference (IV, Fixed, 95% CI) | ‐9.20 [‐13.56, ‐4.84] |
| 12 Mean patient‐specific activity score Show forest plot | 1 | | Mean Difference (IV, Fixed, 95% CI) | Totals not selected |
|
| 12.1 12 weeks | 1 | | Mean Difference (IV, Fixed, 95% CI) | 0.0 [0.0, 0.0] |
| 13 Mean patient evaluation of their disease status (100mm VAS) Show forest plot | 1 | | Mean Difference (IV, Fixed, 95% CI) | Totals not selected |
|
| 13.1 12 weeks | 1 | | Mean Difference (IV, Fixed, 95% CI) | 0.0 [0.0, 0.0] |
| 14 Mean pain with palpation over the lateral epicondyle (100 point scale) Show forest plot | 1 | | Mean Difference (IV, Fixed, 95% CI) | Totals not selected |
|
| 14.1 3 weeks | 1 | | Mean Difference (IV, Fixed, 95% CI) | 0.0 [0.0, 0.0] |
| 14.2 6 weeks | 1 | | Mean Difference (IV, Fixed, 95% CI) | 0.0 [0.0, 0.0] |
| 14.3 24 weeks | 1 | | Mean Difference (IV, Fixed, 95% CI) | 0.0 [0.0, 0.0] |
| 15 Mean pain with Chair test (100 point scale) Show forest plot | 1 | | Mean Difference (IV, Fixed, 95% CI) | Totals not selected |
|
| 15.1 3 weeks | 1 | | Mean Difference (IV, Fixed, 95% CI) | 0.0 [0.0, 0.0] |
| 15.2 6 weeks | 1 | | Mean Difference (IV, Fixed, 95% CI) | 0.0 [0.0, 0.0] |
| 15.3 24 weeks | 1 | | Mean Difference (IV, Fixed, 95% CI) | 0.0 [0.0, 0.0] |
| 16 Mean pain at night (100 point scale) Show forest plot | 2 | | Mean Difference (IV, Random, 95% CI) | Subtotals only |
|
| 16.1 3‐4 weeks | 2 | 175 | Mean Difference (IV, Random, 95% CI) | ‐10.01 [‐34.23, 14.21] |
| 16.2 6 weeks | 1 | 100 | Mean Difference (IV, Random, 95% CI) | ‐27.40 [‐32.98, ‐21.82] |
| 16.3 24 weeks | 1 | 100 | Mean Difference (IV, Random, 95% CI) | ‐25.2 [‐30.59, ‐19.81] |
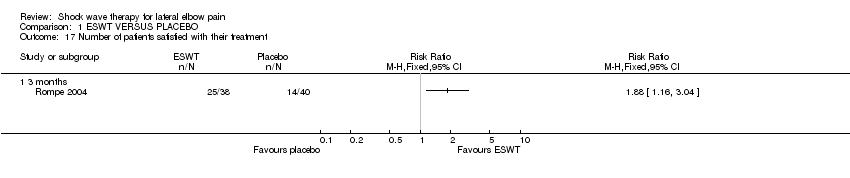
| 17 Number of patients satisfied with their treatment Show forest plot | 1 | | Risk Ratio (M‐H, Fixed, 95% CI) | Totals not selected |
|
| 17.1 3 months | 1 | | Risk Ratio (M‐H, Fixed, 95% CI) | 0.0 [0.0, 0.0] |
| 18 Mean investigator assessment of pain to pressure over lateral epicondyle (10 cm VAS) Show forest plot | 1 | | Mean Difference (IV, Fixed, 95% CI) | Totals not selected |
|
| 18.1 4 weeks | 1 | | Mean Difference (IV, Fixed, 95% CI) | 0.0 [0.0, 0.0] |
| 18.2 8 weeks | 1 | | Mean Difference (IV, Fixed, 95% CI) | 0.0 [0.0, 0.0] |
| 19 Number of patients reported pain during treatment Show forest plot | 2 | 192 | Risk Ratio (M‐H, Fixed, 95% CI) | 1.97 [1.48, 2.62] |
|
| 20 Number of patients reported nausea during treatment Show forest plot | 2 | 192 | Risk Ratio (M‐H, Fixed, 95% CI) | 12.89 [2.50, 66.47] |
|