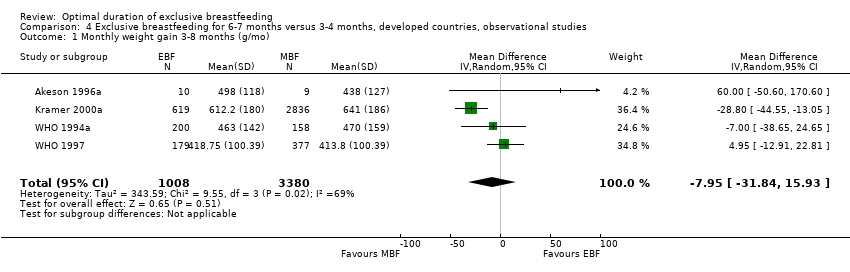
| 1 Monthly weight gain 3‐8 months (g/mo) Show forest plot | 4 | 4388 | Mean Difference (IV, Random, 95% CI) | ‐7.95 [‐31.84, 15.93] |
|
| 2 Monthly weight gain 6‐9 months (g/mo) Show forest plot | 2 | 3432 | Mean Difference (IV, Random, 95% CI) | 21.11 [‐44.70, 86.91] |
|
| 3 Monthly weight gain 8‐12 months (g/mo) Show forest plot | 3 | 3450 | Mean Difference (IV, Fixed, 95% CI) | ‐1.82 [‐16.72, 13.08] |
|
| 4 Monthly length gain 3‐8 months (cm/mo) Show forest plot | 4 | 4385 | Mean Difference (IV, Random, 95% CI) | ‐0.03 [‐0.11, 0.06] |
|
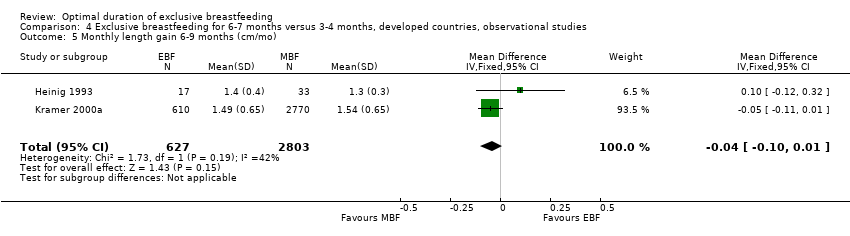
| 5 Monthly length gain 6‐9 months (cm/mo) Show forest plot | 2 | 3430 | Mean Difference (IV, Fixed, 95% CI) | ‐0.04 [‐0.10, 0.01] |
|
| 6 Monthly length gain 8‐12 months (cm/mo) Show forest plot | 3 | 3448 | Mean Difference (IV, Fixed, 95% CI) | 0.09 [0.03, 0.14] |
|
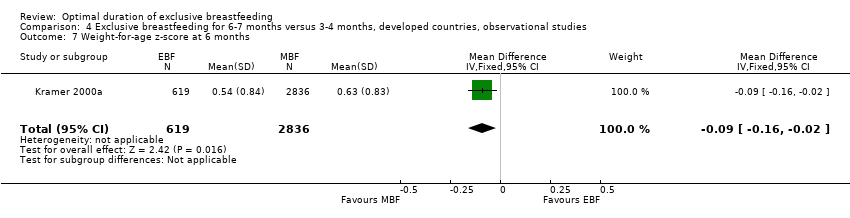
| 7 Weight‐for‐age z‐score at 6 months Show forest plot | 1 | 3455 | Mean Difference (IV, Fixed, 95% CI) | ‐0.09 [‐0.16, ‐0.02] |
|
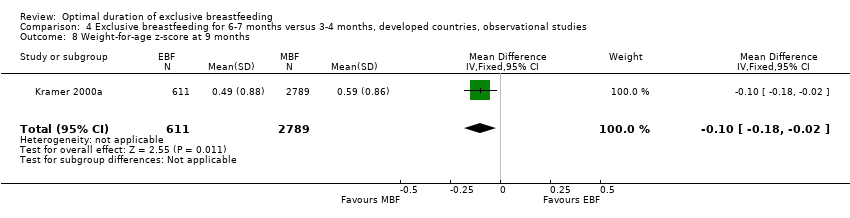
| 8 Weight‐for‐age z‐score at 9 months Show forest plot | 1 | 3400 | Mean Difference (IV, Fixed, 95% CI) | ‐0.10 [‐0.18, ‐0.02] |
|
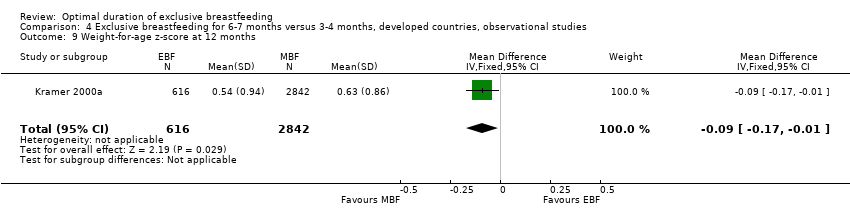
| 9 Weight‐for‐age z‐score at 12 months Show forest plot | 1 | 3458 | Mean Difference (IV, Fixed, 95% CI) | ‐0.09 [‐0.17, ‐0.01] |
|
| 10 Length‐for‐age z‐score at 6 months Show forest plot | 1 | 3454 | Mean Difference (IV, Fixed, 95% CI) | ‐0.12 [‐0.20, ‐0.04] |
|
| 11 Length‐for‐age z‐score at 9 months Show forest plot | 1 | 3398 | Mean Difference (IV, Fixed, 95% CI) | ‐0.14 [‐0.22, ‐0.06] |
|
| 12 Length‐for‐age z‐score at 12 months Show forest plot | 1 | 3458 | Mean Difference (IV, Fixed, 95% CI) | ‐0.02 [‐0.10, 0.06] |
|
| 13 Weight‐for‐length z‐score at 6 months Show forest plot | 1 | 3454 | Mean Difference (IV, Fixed, 95% CI) | 0.02 [‐0.07, 0.11] |
|
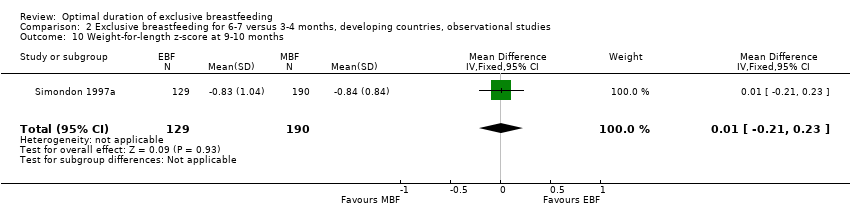
| 14 Weight‐for‐length z‐score at 9 months Show forest plot | 1 | 3398 | Mean Difference (IV, Fixed, 95% CI) | 0.03 [‐0.06, 0.12] |
|
| 15 Weight‐for‐length z‐score at 12 months Show forest plot | 1 | 3458 | Mean Difference (IV, Fixed, 95% CI) | ‐0.08 [‐0.17, 0.01] |
|
| 16 Weight‐for‐age z‐score < ‐2 at 6 months Show forest plot | 1 | 3461 | Risk Ratio (M‐H, Fixed, 95% CI) | 0.92 [0.04, 19.04] |
|
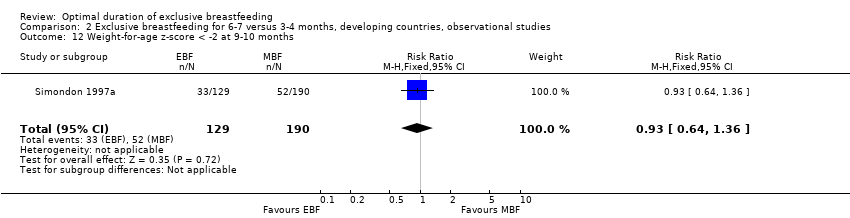
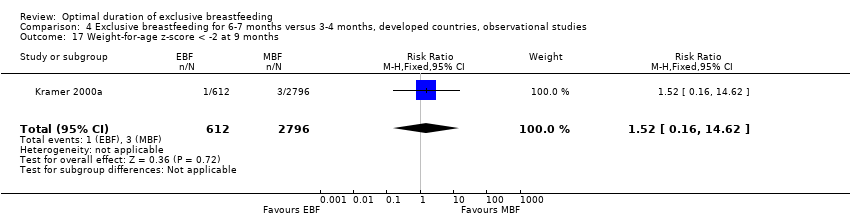
| 17 Weight‐for‐age z‐score < ‐2 at 9 months Show forest plot | 1 | 3408 | Risk Ratio (M‐H, Fixed, 95% CI) | 1.52 [0.16, 14.62] |
|
| 18 Weight‐for‐age z‐score < ‐2 at 12 months Show forest plot | 1 | 3466 | Risk Ratio (M‐H, Fixed, 95% CI) | 1.15 [0.13, 10.31] |
|
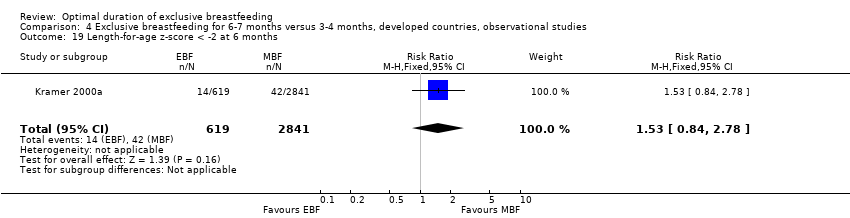
| 19 Length‐for‐age z‐score < ‐2 at 6 months Show forest plot | 1 | 3460 | Risk Ratio (M‐H, Fixed, 95% CI) | 1.53 [0.84, 2.78] |
|
| 20 Length‐for‐age z‐score < ‐2 at 9 months Show forest plot | 1 | 3406 | Risk Ratio (M‐H, Fixed, 95% CI) | 1.46 [0.80, 2.64] |
|
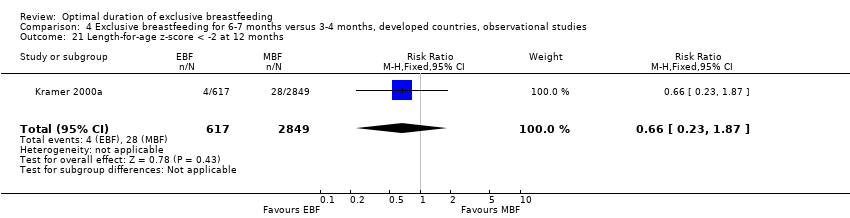
| 21 Length‐for‐age z‐score < ‐2 at 12 months Show forest plot | 1 | 3466 | Risk Ratio (M‐H, Fixed, 95% CI) | 0.66 [0.23, 1.87] |
|
| 22 Weight‐for‐length z‐score < ‐2 at 6 months Show forest plot | 1 | 3460 | Risk Ratio (M‐H, Fixed, 95% CI) | 0.31 [0.02, 5.34] |
|
| 23 Weight‐for‐length z‐score < ‐2 at 9 months Show forest plot | 1 | 3406 | Risk Ratio (M‐H, Fixed, 95% CI) | 1.14 [0.24, 5.37] |
|
| 24 Weight‐for‐length z‐score < ‐2 at 12 months Show forest plot | 1 | 3466 | Risk Ratio (M‐H, Fixed, 95% CI) | 1.15 [0.13, 10.31] |
|
| 25 Head circumference at 6 months (cm) Show forest plot | 1 | 3440 | Mean Difference (IV, Fixed, 95% CI) | ‐0.10 [‐0.23, 0.03] |
|
| 26 Head circumference at 9 months (cm) Show forest plot | 1 | 3389 | Mean Difference (IV, Fixed, 95% CI) | 0.07 [‐0.06, 0.20] |
|
| 27 Head circumference at 12 months (cm) Show forest plot | 1 | 3450 | Mean Difference (IV, Fixed, 95% CI) | 0.19 [0.06, 0.32] |
|
| 28 Sleeping time at 9 months (min/day) Show forest plot | 1 | 50 | Mean Difference (IV, Fixed, 95% CI) | 1.0 [‐36.65, 38.65] |
|
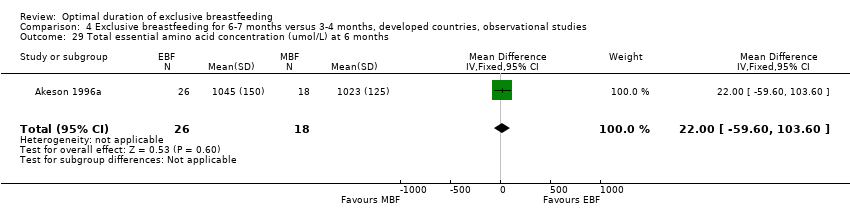
| 29 Total essential amino acid concentration (umol/L) at 6 months Show forest plot | 1 | 44 | Mean Difference (IV, Fixed, 95% CI) | 22.0 [‐59.60, 103.60] |
|
| 30 Total amino acid concentration (umol/L) at 6 months Show forest plot | 1 | 44 | Mean Difference (IV, Fixed, 95% CI) | 73.0 [‐118.22, 264.22] |
|
| 31 Atopic eczema in first 12 months Show forest plot | 2 | 3618 | Risk Ratio (M‐H, Random, 95% CI) | 0.65 [0.27, 1.59] |
|
| 32 Food allergy at 1 year (by history) Show forest plot | 1 | 135 | Risk Ratio (M‐H, Fixed, 95% CI) | 0.19 [0.08, 0.48] |
|
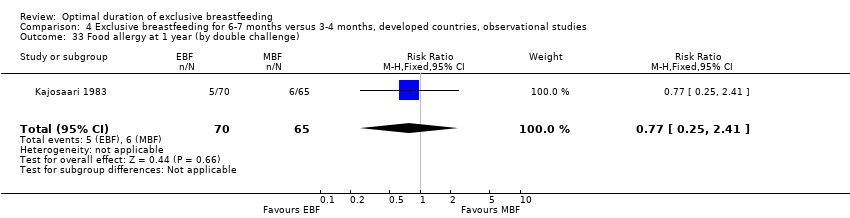
| 33 Food allergy at 1 year (by double challenge) Show forest plot | 1 | 135 | Risk Ratio (M‐H, Fixed, 95% CI) | 0.77 [0.25, 2.41] |
|
| 34 Two or more episodes of wheezing in first 12 months Show forest plot | 2 | 3993 | Risk Ratio (M‐H, Fixed, 95% CI) | 0.79 [0.49, 1.28] |
|
| 35 Hemoglobin concentration (g/L) at 12 months Show forest plot | 1 | 30 | Mean Difference (IV, Fixed, 95% CI) | 8.0 [4.03, 11.97] |
|
| 36 Hemoglobin concentration < 110 g/L at 12 months Show forest plot | 1 | 30 | Risk Ratio (M‐H, Fixed, 95% CI) | 0.12 [0.01, 1.80] |
|
| 37 Serum ferritin concentration (mcg/L) at 12 months Show forest plot | 1 | 30 | Mean Difference (IV, Fixed, 95% CI) | 4.70 [‐6.30, 15.70] |
|
| 38 Serum ferritin concentration < 10 mcg/L at 12 months Show forest plot | 1 | 30 | Risk Ratio (M‐H, Fixed, 95% CI) | 0.42 [0.12, 1.54] |
|
| 39 One or more episodes of gastrointestinal infection in first 12 months Show forest plot | 1 | 3483 | Risk Ratio (M‐H, Fixed, 95% CI) | 0.67 [0.46, 0.97] |
|
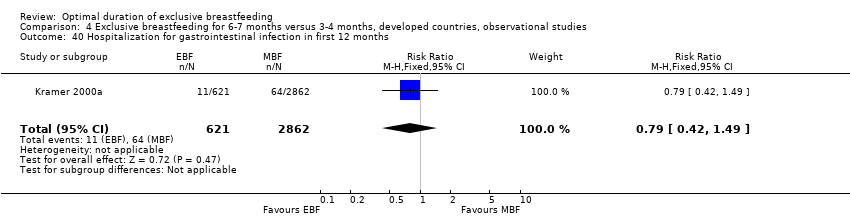
| 40 Hospitalization for gastrointestinal infection in first 12 months Show forest plot | 1 | 3483 | Risk Ratio (M‐H, Fixed, 95% CI) | 0.79 [0.42, 1.49] |
|
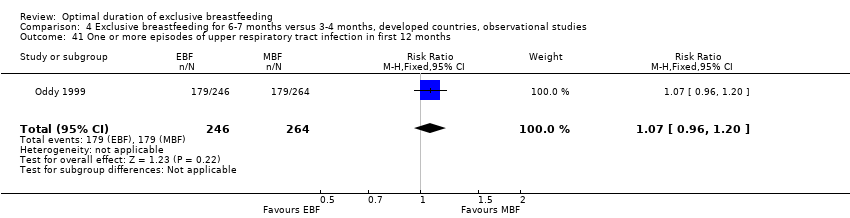
| 41 One or more episodes of upper respiratory tract infection in first 12 months Show forest plot | 1 | 510 | Risk Ratio (M‐H, Fixed, 95% CI) | 1.07 [0.96, 1.20] |
|
| 42 Two or more episodes of upper respiratory tract infection in first 12 months Show forest plot | 2 | 3993 | Risk Ratio (M‐H, Fixed, 95% CI) | 0.91 [0.82, 1.02] |
|
| 43 Four or more episodes of upper respiratory tract infection in first 12 months Show forest plot | 1 | 510 | Risk Ratio (M‐H, Fixed, 95% CI) | 0.82 [0.52, 1.29] |
|
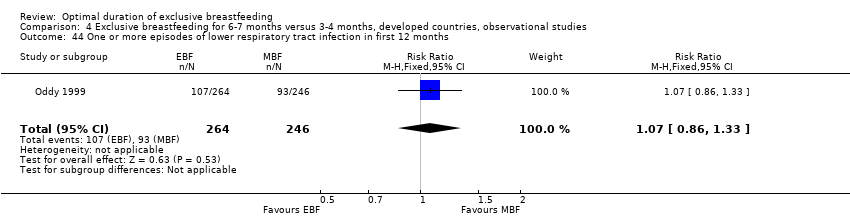
| 44 One or more episodes of lower respiratory tract infection in first 12 months Show forest plot | 1 | 510 | Risk Ratio (M‐H, Fixed, 95% CI) | 1.07 [0.86, 1.33] |
|
| 45 Two or more episodes of respiratory tract infection (upper or lower) in first 12 months Show forest plot | 1 | 3483 | Risk Ratio (M‐H, Fixed, 95% CI) | 0.90 [0.79, 1.03] |
|
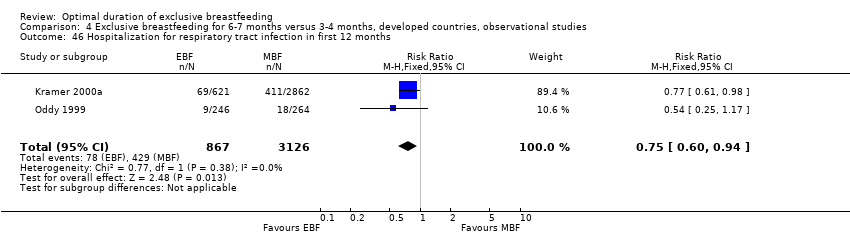
| 46 Hospitalization for respiratory tract infection in first 12 months Show forest plot | 2 | 3993 | Risk Ratio (M‐H, Fixed, 95% CI) | 0.75 [0.60, 0.94] |
|
| 47 Number of episodes of otitis media in first 12 months Show forest plot | 1 | 279 | Mean Difference (IV, Fixed, 95% CI) | ‐0.04 [‐0.49, 0.41] |
|
| 48 One or more episodes of otitis media in first 12 months Show forest plot | 2 | 3762 | Risk Ratio (M‐H, Fixed, 95% CI) | 1.28 [1.04, 1.57] |
|
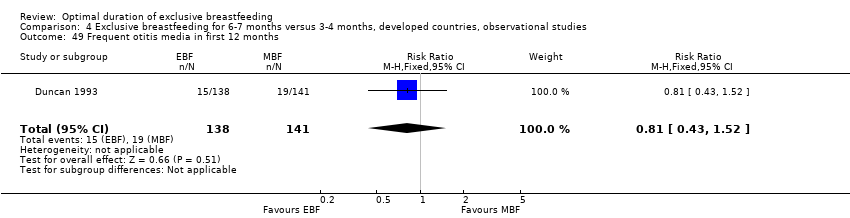
| 49 Frequent otitis media in first 12 months Show forest plot | 1 | 279 | Risk Ratio (M‐H, Fixed, 95% CI) | 0.81 [0.43, 1.52] |
|
| 50 Death in first 12 months Show forest plot | 1 | 3483 | Risk Ratio (M‐H, Fixed, 95% CI) | 2.30 [0.21, 25.37] |
|
| 51 Any dental caries (decayed, missing, or filled teeth) at 6 years Show forest plot | 1 | 2948 | Risk Ratio (M‐H, Fixed, 95% CI) | 0.98 [0.94, 1.03] |
|
| 52 Any incisor caries (decayed, missing, or filled teeth) at 6 years Show forest plot | 1 | 2948 | Odds Ratio (M‐H, Fixed, 95% CI) | 0.91 [0.72, 1.16] |
|
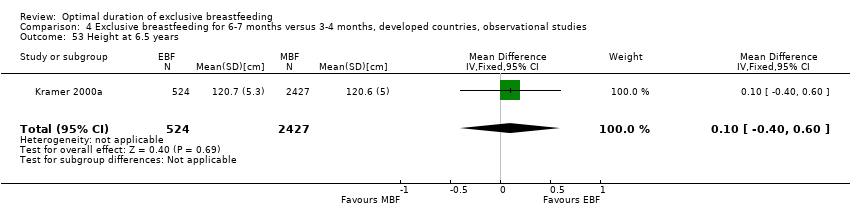
| 53 Height at 6.5 years Show forest plot | 1 | 2951 | Mean Difference (IV, Fixed, 95% CI) | 0.10 [‐0.40, 0.60] |
|
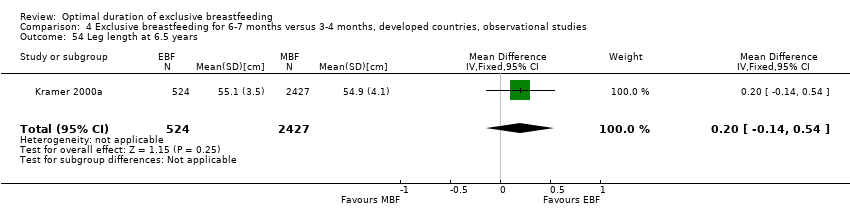
| 54 Leg length at 6.5 years Show forest plot | 1 | 2951 | Mean Difference (IV, Fixed, 95% CI) | 0.20 [‐0.14, 0.54] |
|
| 55 Head circumference at 6.5 years Show forest plot | 1 | 2951 | Mean Difference (IV, Fixed, 95% CI) | 0.10 [‐0.04, 0.24] |
|
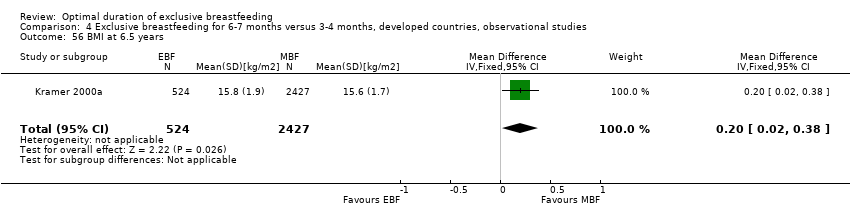
| 56 BMI at 6.5 years Show forest plot | 1 | 2951 | Mean Difference (IV, Fixed, 95% CI) | 0.20 [0.02, 0.38] |
|
| 57 Triceps skinfold thickness at 6.5 years Show forest plot | 1 | 2951 | Mean Difference (IV, Fixed, 95% CI) | 0.90 [0.51, 1.29] |
|
| 58 Subscapular skinfold thickness Show forest plot | 1 | 2951 | Mean Difference (IV, Fixed, 95% CI) | 0.5 [0.25, 0.75] |
|
| 59 Waist circumference at 6.5 years Show forest plot | 1 | 2951 | Mean Difference (IV, Fixed, 95% CI) | 0.0 [‐0.42, 0.42] |
|
| 60 Hip circumference at 6.5 years Show forest plot | 1 | 2951 | Mean Difference (IV, Fixed, 95% CI) | 0.5 [0.05, 0.95] |
|
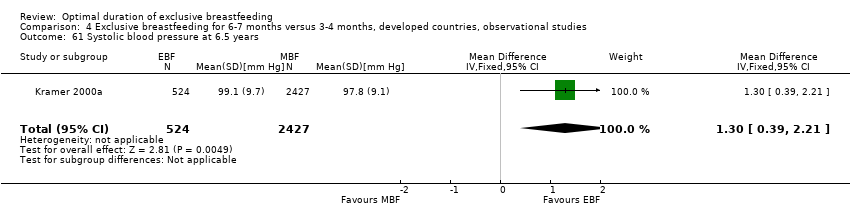
| 61 Systolic blood pressure at 6.5 years Show forest plot | 1 | 2951 | Mean Difference (IV, Fixed, 95% CI) | 1.30 [0.39, 2.21] |
|
| 62 Diastolic blood pressure at 6.5 years (mm Hg) Show forest plot | 1 | 2951 | Mean Difference (IV, Fixed, 95% CI) | 1.0 [0.29, 1.71] |
|
| 63 Atopic eczema at 5‐7 years Show forest plot | 2 | 3584 | Risk Ratio (M‐H, Fixed, 95% CI) | 0.86 [0.47, 1.58] |
|
| 64 Hay fever at 5‐7 years Show forest plot | 2 | 3584 | Risk Ratio (M‐H, Random, 95% CI) | 0.80 [0.39, 1.65] |
|
| 65 Asthma at 5‐7 years Show forest plot | 3 | 4023 | Risk Ratio (M‐H, Fixed, 95% CI) | 1.02 [0.72, 1.44] |
|
| 66 Food allergy at 5 years Show forest plot | 1 | 113 | Risk Ratio (M‐H, Fixed, 95% CI) | 0.61 [0.12, 3.19] |
|
| 67 Allergy to animal dander at 5 years Show forest plot | 1 | 113 | Risk Ratio (M‐H, Fixed, 95% CI) | 0.81 [0.24, 2.72] |
|
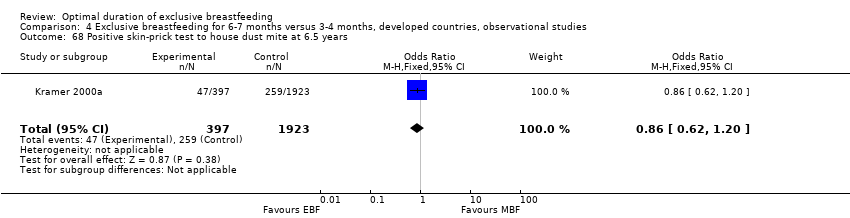
| 68 Positive skin‐prick test to house dust mite at 6.5 years Show forest plot | 1 | 2320 | Odds Ratio (M‐H, Fixed, 95% CI) | 0.86 [0.62, 1.20] |
|
| 69 Positive skin‐prick test to cat dander at 6.5 years Show forest plot | 1 | 2320 | Odds Ratio (M‐H, Fixed, 95% CI) | 0.86 [0.60, 1.24] |
|
| 70 Positive skin‐prick test to birch pollen at 6.5 years Show forest plot | 1 | 2320 | Odds Ratio (M‐H, Fixed, 95% CI) | 0.80 [0.55, 1.18] |
|
| 71 Positive skin‐prick test to mixed northern grasses at 6.5 years Show forest plot | 1 | 2320 | Odds Ratio (M‐H, Fixed, 95% CI) | 0.71 [0.50, 1.01] |
|
| 72 Positive skin‐prick test to Alternaria at 6.5 years Show forest plot | 1 | 2320 | Odds Ratio (M‐H, Fixed, 95% CI) | 0.74 [0.47, 1.17] |
|
| 73 Any positive skin‐prick test at 6‐7 years Show forest plot | 2 | 2651 | Risk Ratio (M‐H, Fixed, 95% CI) | 0.95 [0.81, 1.11] |
|
| 74 Wechsler cognitive ability test at 6.5 years: vocabulary Show forest plot | 1 | 2944 | Mean Difference (IV, Fixed, 95% CI) | 0.5 [‐0.57, 1.57] |
|
| 75 Wechsler cognitive ability test at 6.5 years: similarities Show forest plot | 1 | 2944 | Mean Difference (IV, Fixed, 95% CI) | 0.30 [‐0.56, 1.16] |
|
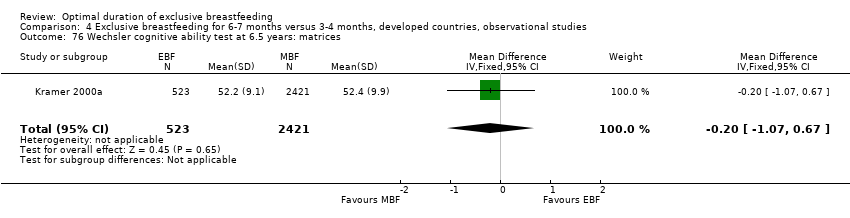
| 76 Wechsler cognitive ability test at 6.5 years: matrices Show forest plot | 1 | 2944 | Mean Difference (IV, Fixed, 95% CI) | ‐0.20 [‐1.07, 0.67] |
|
| 77 Wechsler cognitive ability test at 6.5 years: block designs Show forest plot | 1 | 2944 | Mean Difference (IV, Fixed, 95% CI) | 1.30 [0.40, 2.20] |
|
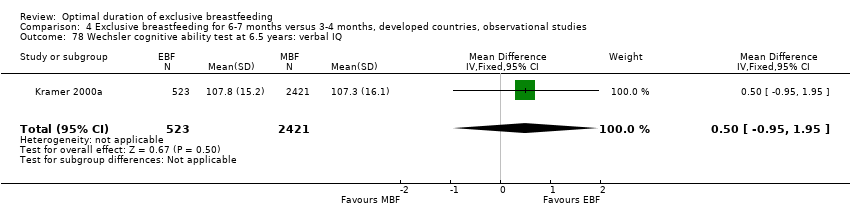
| 78 Wechsler cognitive ability test at 6.5 years: verbal IQ Show forest plot | 1 | 2944 | Mean Difference (IV, Fixed, 95% CI) | 0.5 [‐0.95, 1.95] |
|
| 79 Wechsler cognitive ability test at 6.5 years: performance IQ Show forest plot | 1 | 2944 | Mean Difference (IV, Fixed, 95% CI) | 0.80 [‐0.55, 2.15] |
|
| 80 Wechsler cognitive ability test at 6.5 years: full‐scale IQ Show forest plot | 1 | 2944 | Mean Difference (IV, Fixed, 95% CI) | 0.80 [‐0.58, 2.18] |
|
| 81 Teacher's academic rating at 6.5 years: reading Show forest plot | 1 | 2196 | Mean Difference (IV, Fixed, 95% CI) | ‐0.10 [‐0.19, ‐0.01] |
|
| 82 Teacher's academic rating at 6.5 years: writing Show forest plot | 1 | 2196 | Mean Difference (IV, Fixed, 95% CI) | ‐0.12 [‐0.20, ‐0.04] |
|
| 83 Teacher's academic rating at 6.5 years: mathematics Show forest plot | 1 | 2196 | Mean Difference (IV, Fixed, 95% CI) | ‐0.04 [‐0.12, 0.04] |
|
| 84 Teacher's academic rating at 6.5 years: other subjects Show forest plot | 1 | 2196 | Mean Difference (IV, Fixed, 95% CI) | ‐0.10 [‐0.17, ‐0.03] |
|
| 85 Parent's behavior rating at 6.5 years: total difficulties Show forest plot | 1 | 2941 | Mean Difference (IV, Fixed, 95% CI) | 0.30 [‐0.16, 0.76] |
|
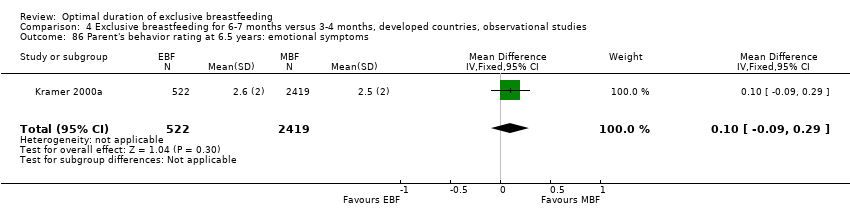
| 86 Parent's behavior rating at 6.5 years: emotional symptoms Show forest plot | 1 | 2941 | Mean Difference (IV, Fixed, 95% CI) | 0.10 [‐0.09, 0.29] |
|
| 87 Parent's behavior rating at 6.5 years: conduct problems Show forest plot | 1 | 2941 | Mean Difference (IV, Fixed, 95% CI) | 0.0 [‐0.13, 0.13] |
|
| 88 Parent's behavior rating at 6.5 years: hyperactivity/inattention Show forest plot | 1 | 2941 | Mean Difference (IV, Fixed, 95% CI) | 0.20 [‐0.01, 0.41] |
|
| 89 Parent's behavior rating at 6.5 years: peer problems Show forest plot | 1 | 2941 | Mean Difference (IV, Fixed, 95% CI) | 0.10 [‐0.05, 0.25] |
|
| 90 Parent's behavior rating at 6.5 years: prosocial behavior Show forest plot | 1 | 2941 | Mean Difference (IV, Fixed, 95% CI) | 0.10 [‐0.05, 0.25] |
|
| 91 Teacher's behavior rating at 6.5 years: total difficulties Show forest plot | 1 | 2525 | Mean Difference (IV, Fixed, 95% CI) | 0.10 [‐0.46, 0.66] |
|
| 92 Teacher's behavior rating at 6.5 years: emotional symptoms Show forest plot | 1 | 2525 | Mean Difference (IV, Fixed, 95% CI) | 0.0 [‐0.18, 0.18] |
|
| 93 Teacher's behavior rating at 6.5 years: conduct problems Show forest plot | 1 | 2525 | Mean Difference (IV, Fixed, 95% CI) | 0.0 [‐0.17, 0.17] |
|
| 94 Teacher's behavior rating at 6.5 years: hyperactivity/inattention Show forest plot | 1 | 2525 | Mean Difference (IV, Fixed, 95% CI) | ‐0.10 [‐0.37, 0.17] |
|
| 95 Teacher's behavior rating at 6.5 years: peer problems Show forest plot | 1 | 2525 | Mean Difference (IV, Fixed, 95% CI) | 0.10 [‐0.08, 0.28] |
|
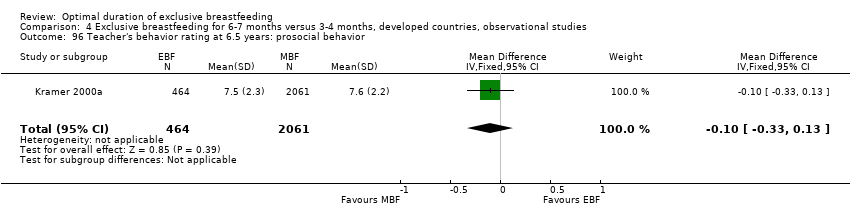
| 96 Teacher's behavior rating at 6.5 years: prosocial behavior Show forest plot | 1 | 2525 | Mean Difference (IV, Fixed, 95% CI) | ‐0.10 [‐0.33, 0.13] |
|