Duración óptima de la lactancia materna exclusiva
Referencias
References to studies included in this review
References to studies excluded from this review
Additional references
References to other published versions of this review
Characteristics of studies
Characteristics of included studies [ordered by study ID]
Ir a:
| Methods | Design: prospective cohort. | |
| Participants | 1204 Filipino infants. | |
| Interventions | EBF = little or no nutritive foods or fluids other than BF for 6 months (n = 370). | |
| Outcomes | Weight and length gain 4‐6 months. | |
| Notes | Multivariate analysis did not affect outcome comparison, but data not presented. | |
| Risk of bias | ||
| Bias | Authors' judgement | Support for judgement |
| Allocation concealment (selection bias) | Unclear risk | D ‐ Not used |
| Methods | Design: retrospective cohort. | |
| Participants | 96 healthy U.S. infants living in Baltimore‐Washington area who were EBF for at least 6 months. | |
| Interventions | EBF = BF with no solids or liquids other than human milk for > 6 months (n = 50). | |
| Outcomes | Weight and length gain in first 12 months. | |
| Notes | 1. No quantitative data provided. | |
| Risk of bias | ||
| Bias | Authors' judgement | Support for judgement |
| Allocation concealment (selection bias) | Unclear risk | D ‐ Not used |
| Methods | Design: prospective cohort. | |
| Participants | 44 healthy Swedish infants EBF for the first 3 months. | |
| Interventions | EBF = BF + < 125 ml/day of formula for >= 6 months (n = 26). | |
| Outcomes | Weight and length gain 4‐8 months, 6‐9, and 8‐12 months; total and essential amino acid concentrations at 6 months. | |
| Notes | 1. N's in tables not provided for weight and length. | |
| Risk of bias | ||
| Bias | Authors' judgement | Support for judgement |
| Allocation concealment (selection bias) | Unclear risk | D ‐ Not used |
| Methods | Design: prospective cohort. | |
| Participants | 36 poor, peri‐urban Peruvian infants. | |
| Interventions | EBF = little or no nutritive foods or fluids other than BF for 6 months (n = 15). | |
| Outcomes | Weight and length gain 4‐6 months. | |
| Notes | Multivariate analysis did not affect outcome comparison, but data not presented. | |
| Risk of bias | ||
| Bias | Authors' judgement | Support for judgement |
| Allocation concealment (selection bias) | Unclear risk | D ‐ Not used |
| Methods | Design: cross‐sectional. | |
| Participants | 1122 Chilean children 3.0‐5.9 months of age. | |
| Interventions | EBF = BF only (unclear if water, juices, or other liquids permitted) (n = 974). | |
| Outcomes | Low WAZ, LAZ, high WLZ. | |
| Notes | 1. Cannot use data quantitatively, because prevalences, confidence intervals, and SEs not provided. | |
| Risk of bias | ||
| Bias | Authors' judgement | Support for judgement |
| Allocation concealment (selection bias) | Unclear risk | D ‐ Not used |
| Methods | Design: controlled trial. | |
| Participants | 141 Honduran infants of low‐income families with poor sanitation. | |
| Interventions | EBF = BF with no other liquids or solids until 6 months (n = 50). | |
| Outcomes | Weight and length gain 4‐6 and 6‐12 months; WAZ, LAZ, and WLZ at 6 months; receipt of Fe supplements 6‐9 months; hemoglobin and ferritin at 6 months; % of days with fever, cough, nasal congestion, nasal discharge, hoarseness, and diarrhea; age first crawled, age first sat from lying position, walking by 12 months; maternal postpartum weight loss 4‐6 months; resumption of menses by 6 months. | |
| Notes | 1. Nonrandom allocation. | |
| Risk of bias | ||
| Bias | Authors' judgement | Support for judgement |
| Allocation concealment (selection bias) | High risk | C ‐ Inadequate |
| Methods | Design: controlled trial. | |
| Participants | 119 LBW Honduran term infants. | |
| Interventions | EBF = BF with no other liquids or solids until 6 months (n = 59). | |
| Outcomes | Weight and length gain 4‐6 and 6‐12 months; WAZ, LAZ, and WLZ at 6 months; plasma zinc concentration at 6 months; | |
| Notes | 1. Cluster‐randomized by week of birth, while analyses done at individual level. | |
| Risk of bias | ||
| Bias | Authors' judgement | Support for judgement |
| Allocation concealment (selection bias) | Low risk | A ‐ Adequate |
| Methods | Prospective, population‐based pregnancy/birth cohort study (Generation R Study from Rotterdam.) | |
| Participants | 1095 healthy Dutch singleton infants. | |
| Interventions | EBF = BF without other milk or solids until 6 months (n = 58). MBF = introduction of milk and/or solids between 4 and 6 months with continuation of partial BF until 6 months (n = 1037). | |
| Outcomes | 1 or more episodes of upper respiratory tract, lower respiratory tract, and gastrointestinal tract infection in first 6 months and from 7‐12 months. | |
| Notes | 1. Outcomes based on mailed questionnaires (maternal report) sent at 6 and 12 months postpartum. 2. Of 7893 total infants enrolled in the cohort, breastfeeding, outcome, and covariate (potential confounder) data were available in only ˜3500 (44%) at 6 months and ˜3000 (38%) at 12 months. | |
| Risk of bias | ||
| Bias | Authors' judgement | Support for judgement |
| Allocation concealment (selection bias) | Unclear risk | D ‐ Not done |
| Methods | Design: prospective cohort. | |
| Participants | 279 healthy U.S. infants. | |
| Interventions | EBF = EBF for >= 6 months (n = 138). | |
| Outcomes | Number of episodes of OM, 1 or more episodes of OM, and frequent OM in first 12 months. | |
| Notes | ||
| Risk of bias | ||
| Bias | Authors' judgement | Support for judgement |
| Allocation concealment (selection bias) | Unclear risk | D ‐ Not used |
| Methods | Design: prospective cohort. | |
| Participants | 60 healthy U.S. infants living in Davis, CA. | |
| Interventions | EBF = BF ± <= 120 ml/day of other milk or formula for >= 12 months and no solids < 6 months (n = 19). | |
| Outcomes | Monthly weight and length gain at 6‐9 and 9‐12 months; total sleeping time at 9 months. | |
| Notes | 1. Data on weight and length gain 4‐6 months included in pooled analysis of WHO 1994. | |
| Risk of bias | ||
| Bias | Authors' judgement | Support for judgement |
| Allocation concealment (selection bias) | Unclear risk | D ‐ Not used |
| Methods | Design: prospective cohort. | |
| Participants | 1018 Bangladeshi women with live births. | |
| Interventions | EBF = BF with no other liquids or solids for >= 7 months (n = 647). | |
| Outcomes | Duration of lactational amenorrhea. | |
| Notes | 1. Over 95% of study women BF > 16 months, so all MBF women assumed to continue BF >= 6 months. | |
| Risk of bias | ||
| Bias | Authors' judgement | Support for judgement |
| Allocation concealment (selection bias) | Unclear risk | D ‐ Not used |
| Methods | Design: prospective cohort. | |
| Participants | 135 healthy Finnish infants of atopic parents. | |
| Interventions | EBF = BF without cow milk‐based formula; occasional water permitted; solids introduced at about 6 months (n = 70). | |
| Outcomes | Atopic eczema and food allergy at 1 year; any atopy, atopic eczema, pollen allergy, asthma, food allergy, and allergy to animal dander at 5 years. | |
| Notes | Discrepancy between 1‐ and 5‐year follow‐up reports regarding sample sizes per group (inverted from 1 report to the other). | |
| Risk of bias | ||
| Bias | Authors' judgement | Support for judgement |
| Allocation concealment (selection bias) | Unclear risk | D ‐ Not used |
| Methods | Design: prospective cohort. | |
| Participants | 193 healthy, term Iranian infants followed at 1 of 5 randomly urban health centres. | |
| Interventions | EBF = no other liquid or solid before 6 months (n = 98). | |
| Outcomes | Weight and length gains; incidence of respiratory and gastrointestinal infection during the period of 4 to 6 months. | |
| Notes | 1. EBF and MBF infants 'matched' for sex and for weight and length at 4 months, but matching criteria for weight and length not provided. | |
| Risk of bias | ||
| Bias | Authors' judgement | Support for judgement |
| Allocation concealment (selection bias) | Unclear risk | D ‐ Not used |
| Methods | Design: prospective cohort. | |
| Participants | 48 rural Bangladeshi children. | |
| Interventions | EBF = no other liquid or semi‐solid food (water permitted) and introduction of supplementation between 12 and 15 months. | |
| Outcomes | Weight and length through 24 months; number of diarrheal episodes; average duration of diarrhea. | |
| Notes | 1. Graphical presentation of data only without SDs, thus precluding quantitative reporting. | |
| Risk of bias | ||
| Bias | Authors' judgement | Support for judgement |
| Allocation concealment (selection bias) | Unclear risk | D ‐ Not used |
| Methods | Design: prospective cohort nested within randomized trial. | |
| Participants | 3483 healthy, term Belarussian infants. | |
| Interventions | EBF = no liquids or solids other than breast milk for >= 6 months (n = 621). | |
| Outcomes | Monthly weight and length gain 3‐6, 6‐9, and 9‐12 months; WAZ, LAZ, WLZ, and head circumference at 6, 9, and 12 months; death; occurrence of and hospitalization for gastrointestinal and respiratory infection; atopic eczema and recurrent wheezing in first 12 months; height, weight, adiposity, allergy symptoms and diagnoses, skin‐prick tests, dental caries, IQ, teacher's academic ratings, and parent's and teacher's assessments of behaviour at 6.5 years. | |
| Notes | Outcomes analyzed using multilevel regression accounting for clustering and controlling for geographic region, urban vs rural location, parental education, family atopic history, and maternal smoking during pregnancy. | |
| Risk of bias | ||
| Bias | Authors' judgement | Support for judgement |
| Allocation concealment (selection bias) | Unclear risk | D ‐ Not used |
| Methods | Design: prospective cohort within randomized trial. | |
| Participants | 510 Australian infants. | |
| Interventions | EBF = no nonbreast milk or solids for >= 6 months (n = 246). | |
| Outcomes | Occurrence of and hospitalization for upper and lower respiratory tract infection and recurrent wheezing in first 12 months; asthma and skin‐prick tests at 6 years. | |
| Notes | 1. Published article includes multivariate control for confounders, but data included here are raw and unpublished. | |
| Risk of bias | ||
| Bias | Authors' judgement | Support for judgement |
| Allocation concealment (selection bias) | Unclear risk | D ‐ Not used |
| Methods | Design: prospective cohort. | |
| Participants | 309 healthy, term infants born in Nigerian urban university teaching hospital. | |
| Interventions | EBF = no other liquid or solid for >= 6 months (n = 264). | |
| Outcomes | Respiratory infection, gastrointestinal infection, weight, and length. | |
| Notes | 1. Only 34 of 45 MBF infants had recorded weights an lengths. | |
| Risk of bias | ||
| Bias | Authors' judgement | Support for judgement |
| Allocation concealment (selection bias) | Unclear risk | D ‐ Not used |
| Methods | Design: prospective cohort. | |
| Participants | 30 term, appropriate‐for‐gestational‐age Italian infants recruited at 6 months and BF for first year of life. | |
| Interventions | EBF = BF only without any other fluids or solids for >= 7 months (n = 9). | |
| Outcomes | Hemoglobin and serum ferritin concentrations at 12 months. | |
| Notes | ||
| Risk of bias | ||
| Bias | Authors' judgement | Support for judgement |
| Allocation concealment (selection bias) | Unclear risk | D ‐ Not used |
| Methods | Design: cross‐sectional. | |
| Participants | 31 poor East Indian children < 3 years living under poor hygienic conditions. | |
| Interventions | EBF = no supplementation with other milk or traditional solid foods for 6‐12 months (n = 11). | |
| Outcomes | Weight‐for‐age < 75% of reference mean. | |
| Notes | 1. Study population included all children < 3 years living in 3 villages. | |
| Risk of bias | ||
| Bias | Authors' judgement | Support for judgement |
| Allocation concealment (selection bias) | Unclear risk | D ‐ Not used |
| Methods | Design: prospective cohort. | |
| Participants | 26 healthy Finnish infants. | |
| Interventions | EBF = BF without supplementary formula or solid foods for 9 months (n = 7). | |
| Outcomes | VLDL, LDL, HDL2, HDL3, apoprotein B, and total triglyceride concentration at 9 months. | |
| Notes | Atopic outcomes not compared in EBF vs MBF groups as defined here. | |
| Risk of bias | ||
| Bias | Authors' judgement | Support for judgement |
| Allocation concealment (selection bias) | Unclear risk | D ‐ Not used |
| Methods | Design: prospective cohort. | |
| Participants | 370 Senegalese infants recruited at 2‐3 months. | |
| Interventions | EBF = breast milk and water only until at least 6‐7 months (n = 154). | |
| Outcomes | Monthly weight and length gain 4‐6 and 6‐9 months; WAZ, LAZ, WLZ, and mid‐upper arm circumference at 4‐5, 6‐7, and 9‐10 months; duration of lactational amenorrhea. | |
| Notes | 1. EBF = 'very late' group, MBF = 'early' and 'late' groups combined. | |
| Risk of bias | ||
| Bias | Authors' judgement | Support for judgement |
| Allocation concealment (selection bias) | Unclear risk | D ‐ Not used |
| Methods | Design: prospective cohort. | |
| Participants | Pooled sample of healthy developed‐country infants (n = 358). | |
| Interventions | EBF = BF ± other liquids for >= 6 months (n = 200). | |
| Outcomes | Monthly weight and length gain 4‐6 months. | |
| Notes | Multivariate control for initial weight and length, but data not presented. | |
| Risk of bias | ||
| Bias | Authors' judgement | Support for judgement |
| Allocation concealment (selection bias) | Unclear risk | D ‐ Not used |
| Methods | Design: prospective cohort. | |
| Participants | Pooled sample of mid‐to high‐SES infants from 2 developed and 3 developing countries (n = 556). | |
| Interventions | EBF = BF ± noncaloric liquids for >= 6 months (n = 179). | |
| Outcomes | Monthly weight and length gain 4‐8 months. | |
| Notes | 1. Multilevel regression used to control for maternal size and education and infant size and growth < 4 months. | |
| Risk of bias | ||
| Bias | Authors' judgement | Support for judgement |
| Allocation concealment (selection bias) | Unclear risk | D ‐ Not used |
BF: breastfeeding
EBF: exclusive breastfeeding
HDL2: high‐density lipoprotein‐2
HDL3: high‐density lipoprotein‐3
LAZ: length‐for‐age z‐score
LBW: low birthweight
LDL: low density lipoprotein
MBF: mixed breastfeeding
OM: otitis media
SD: standard deviation
SE: standard error
SES: socioeconomic status
VLDL: very low density lipoprotein
vs: versus
WAZ: weight‐for‐age z‐score
WLZ: weight‐for‐length z‐score
Characteristics of excluded studies [ordered by study ID]
Ir a:
| Study | Reason for exclusion |
| The group with full breastfeeding from 4 to < 6 months did not necessarily continue mixed (partial) breastfeeding to at least 6 months. | |
| The group with full breastfeeding from 4 to < 6 months did not necessarily continue mixed (partial) breastfeeding to at least 6 months. | |
| The group with exclusive breastfeeding from 3‐6 months did not necessarily continue mixed (partial) breastfeeding to at least 6 months. | |
| Both intervention and control groups were free to consume locally available complementary foods prior to 4 months and during the intervention period from 4 to 7 months. | |
| The group with exclusive breastfeeding from 4‐6 months did not necessarily continue mixed (partial) breastfeeding to at least 6 months. | |
| The group with full/exclusive breastfeeding from 4‐6 months did not necessarily continue mixed (partial) breastfeeding to at least 6 months. | |
| Those infants in the control group (mixed breastfeeding at ages 4‐6 months) were not necessarily exclusively breastfed until 4 months. | |
| Comparing the 533 total (207+326) infants who were breastfed to any extent for at least 6 months with the 599 (277+322) who were exclusively breastfed for at least 3 months, it appears as if 66 (599‐533) of the 277 infants listed as exclusively breastfed for 3‐< 6 months discontinued breastfeeding before 6 months (see Table 1), |
Data and analyses
| Outcome or subgroup title | No. of studies | No. of participants | Statistical method | Effect size |
| 1 Monthly weight gain from 4‐6 months (g/mo) Show forest plot | 2 | 265 | Mean Difference (IV, Fixed, 95% CI) | 20.78 [‐21.99, 63.54] |
| Analysis 1.1  Comparison 1 Exclusive breastfeeding for 6 versus 4 months, developing countries, controlled trials, Outcome 1 Monthly weight gain from 4‐6 months (g/mo). | ||||
| 2 Monthly weight gain from 6‐12 months (g/mo) Show forest plot | 2 | 233 | Mean Difference (IV, Fixed, 95% CI) | ‐2.62 [‐25.85, 20.62] |
| Analysis 1.2  Comparison 1 Exclusive breastfeeding for 6 versus 4 months, developing countries, controlled trials, Outcome 2 Monthly weight gain from 6‐12 months (g/mo). | ||||
| 3 Monthly length gain 4‐6 months (cm/mo) Show forest plot | 2 | 265 | Mean Difference (IV, Fixed, 95% CI) | 0.10 [‐0.04, 0.24] |
| Analysis 1.3  Comparison 1 Exclusive breastfeeding for 6 versus 4 months, developing countries, controlled trials, Outcome 3 Monthly length gain 4‐6 months (cm/mo). | ||||
| 4 Monthly length gain 6‐12 months (cm/mo) Show forest plot | 2 | 233 | Mean Difference (IV, Fixed, 95% CI) | ‐0.04 [‐0.10, 0.02] |
| Analysis 1.4  Comparison 1 Exclusive breastfeeding for 6 versus 4 months, developing countries, controlled trials, Outcome 4 Monthly length gain 6‐12 months (cm/mo). | ||||
| 5 Weight‐for‐age z‐score at 6 months Show forest plot | 2 | 260 | Mean Difference (IV, Fixed, 95% CI) | 0.18 [‐0.06, 0.41] |
| Analysis 1.5  Comparison 1 Exclusive breastfeeding for 6 versus 4 months, developing countries, controlled trials, Outcome 5 Weight‐for‐age z‐score at 6 months. | ||||
| 6 Length‐for‐age z‐score at 6 months Show forest plot | 2 | 260 | Mean Difference (IV, Fixed, 95% CI) | 0.11 [‐0.11, 0.33] |
| Analysis 1.6  Comparison 1 Exclusive breastfeeding for 6 versus 4 months, developing countries, controlled trials, Outcome 6 Length‐for‐age z‐score at 6 months. | ||||
| 7 Weight‐for‐length z‐score at 6 months Show forest plot | 2 | 260 | Mean Difference (IV, Fixed, 95% CI) | 0.09 [‐0.13, 0.31] |
| Analysis 1.7  Comparison 1 Exclusive breastfeeding for 6 versus 4 months, developing countries, controlled trials, Outcome 7 Weight‐for‐length z‐score at 6 months. | ||||
| 8 Weight‐for‐age z‐score < ‐2 at 6 months Show forest plot | 2 | 260 | Risk Ratio (M‐H, Fixed, 95% CI) | 2.14 [0.74, 6.24] |
| Analysis 1.8  Comparison 1 Exclusive breastfeeding for 6 versus 4 months, developing countries, controlled trials, Outcome 8 Weight‐for‐age z‐score < ‐2 at 6 months. | ||||
| 9 Length‐for‐age z‐score < ‐2 at 6 months Show forest plot | 2 | 260 | Risk Ratio (M‐H, Fixed, 95% CI) | 1.18 [0.56, 2.50] |
| Analysis 1.9  Comparison 1 Exclusive breastfeeding for 6 versus 4 months, developing countries, controlled trials, Outcome 9 Length‐for‐age z‐score < ‐2 at 6 months. | ||||
| 10 Weight‐for‐length z‐score < ‐2 at 6 months Show forest plot | 2 | 260 | Risk Ratio (M‐H, Fixed, 95% CI) | 1.38 [0.17, 10.98] |
| Analysis 1.10  Comparison 1 Exclusive breastfeeding for 6 versus 4 months, developing countries, controlled trials, Outcome 10 Weight‐for‐length z‐score < ‐2 at 6 months. | ||||
| 11 Receipt of Fe supplements 6‐9 months Show forest plot | 1 | 139 | Risk Ratio (M‐H, Fixed, 95% CI) | 1.20 [0.91, 1.58] |
| Analysis 1.11  Comparison 1 Exclusive breastfeeding for 6 versus 4 months, developing countries, controlled trials, Outcome 11 Receipt of Fe supplements 6‐9 months. | ||||
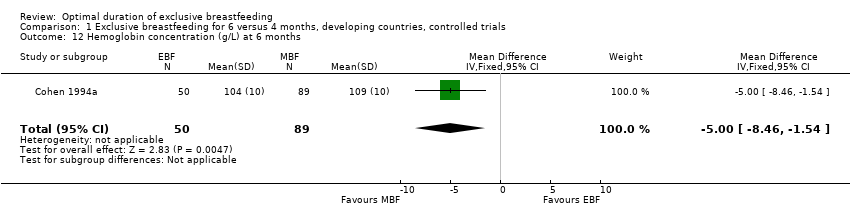
| 12 Hemoglobin concentration (g/L) at 6 months Show forest plot | 1 | 139 | Mean Difference (IV, Fixed, 95% CI) | ‐5.0 [‐8.46, ‐1.54] |
| Analysis 1.12  Comparison 1 Exclusive breastfeeding for 6 versus 4 months, developing countries, controlled trials, Outcome 12 Hemoglobin concentration (g/L) at 6 months. | ||||
| 13 Hemoglobin concentration < 110 g/L at 6 months Show forest plot | 1 | 139 | Risk Ratio (M‐H, Fixed, 95% CI) | 1.20 [0.91, 1.58] |
| Analysis 1.13  Comparison 1 Exclusive breastfeeding for 6 versus 4 months, developing countries, controlled trials, Outcome 13 Hemoglobin concentration < 110 g/L at 6 months. | ||||
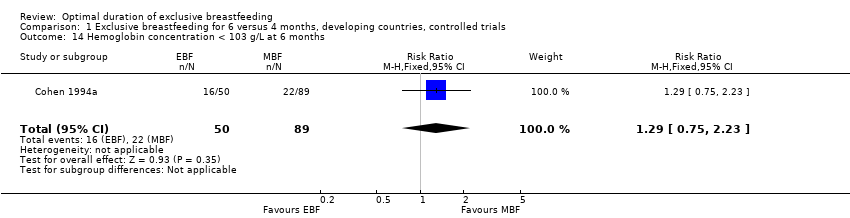
| 14 Hemoglobin concentration < 103 g/L at 6 months Show forest plot | 1 | 139 | Risk Ratio (M‐H, Fixed, 95% CI) | 1.29 [0.75, 2.23] |
| Analysis 1.14  Comparison 1 Exclusive breastfeeding for 6 versus 4 months, developing countries, controlled trials, Outcome 14 Hemoglobin concentration < 103 g/L at 6 months. | ||||
| 15 Hematocrit (%) at 6 months Show forest plot | 1 | 139 | Mean Difference (IV, Fixed, 95% CI) | ‐1.20 [‐2.15, ‐0.25] |
| Analysis 1.15  Comparison 1 Exclusive breastfeeding for 6 versus 4 months, developing countries, controlled trials, Outcome 15 Hematocrit (%) at 6 months. | ||||
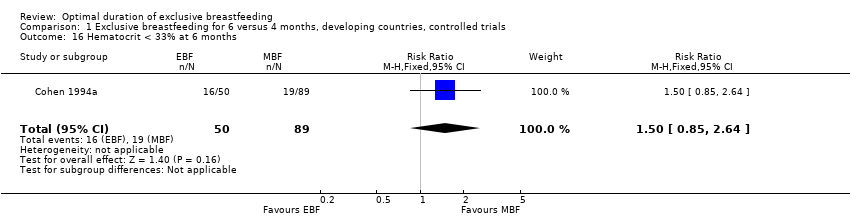
| 16 Hematocrit < 33% at 6 months Show forest plot | 1 | 139 | Risk Ratio (M‐H, Fixed, 95% CI) | 1.50 [0.85, 2.64] |
| Analysis 1.16  Comparison 1 Exclusive breastfeeding for 6 versus 4 months, developing countries, controlled trials, Outcome 16 Hematocrit < 33% at 6 months. | ||||
| 17 Plasma ferritin concentration (mcg/L) at 6 months Show forest plot | 1 | 135 | Mean Difference (IV, Fixed, 95% CI) | ‐18.9 [‐37.31, ‐0.49] |
| Analysis 1.17  Comparison 1 Exclusive breastfeeding for 6 versus 4 months, developing countries, controlled trials, Outcome 17 Plasma ferritin concentration (mcg/L) at 6 months. | ||||
| 18 Plasma ferritin concentration < 12 mcg/L at 6 months Show forest plot | 1 | 135 | Risk Ratio (M‐H, Fixed, 95% CI) | 2.34 [0.86, 6.35] |
| Analysis 1.18  Comparison 1 Exclusive breastfeeding for 6 versus 4 months, developing countries, controlled trials, Outcome 18 Plasma ferritin concentration < 12 mcg/L at 6 months. | ||||
| 19 Plasma ferritin concentration < 15 mcg/L at 6 months Show forest plot | 1 | 135 | Risk Ratio (M‐H, Fixed, 95% CI) | 2.93 [1.13, 7.56] |
| Analysis 1.19  Comparison 1 Exclusive breastfeeding for 6 versus 4 months, developing countries, controlled trials, Outcome 19 Plasma ferritin concentration < 15 mcg/L at 6 months. | ||||
| 20 Plasma zinc concentration < 70 mcg/dL at 6 months Show forest plot | 1 | 101 | Risk Ratio (M‐H, Fixed, 95% CI) | 0.75 [0.43, 1.33] |
| Analysis 1.20  Comparison 1 Exclusive breastfeeding for 6 versus 4 months, developing countries, controlled trials, Outcome 20 Plasma zinc concentration < 70 mcg/dL at 6 months. | ||||
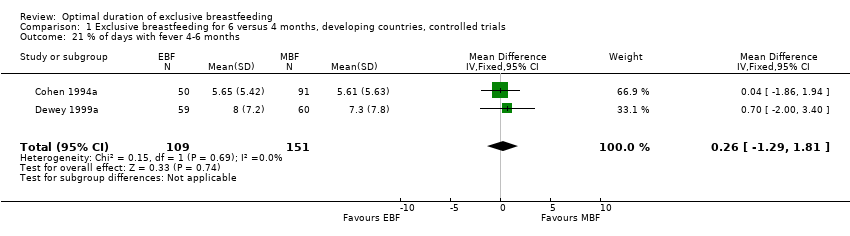
| 21 % of days with fever 4‐6 months Show forest plot | 2 | 260 | Mean Difference (IV, Fixed, 95% CI) | 0.26 [‐1.29, 1.81] |
| Analysis 1.21  Comparison 1 Exclusive breastfeeding for 6 versus 4 months, developing countries, controlled trials, Outcome 21 % of days with fever 4‐6 months. | ||||
| 22 % of days with cough 4‐6 months Show forest plot | 2 | 260 | Mean Difference (IV, Random, 95% CI) | 2.33 [‐6.00, 12.65] |
| Analysis 1.22  Comparison 1 Exclusive breastfeeding for 6 versus 4 months, developing countries, controlled trials, Outcome 22 % of days with cough 4‐6 months. | ||||
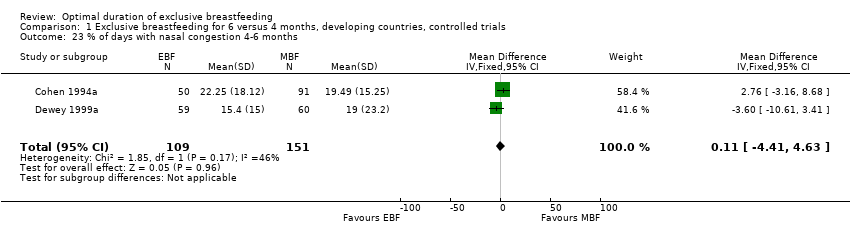
| 23 % of days with nasal congestion 4‐6 months Show forest plot | 2 | 260 | Mean Difference (IV, Fixed, 95% CI) | 0.11 [‐4.41, 4.63] |
| Analysis 1.23  Comparison 1 Exclusive breastfeeding for 6 versus 4 months, developing countries, controlled trials, Outcome 23 % of days with nasal congestion 4‐6 months. | ||||
| 24 % of days with nasal discharge 4‐6 months Show forest plot | 2 | 260 | Mean Difference (IV, Random, 95% CI) | ‐0.72 [‐6.81, 5.38] |
| Analysis 1.24  Comparison 1 Exclusive breastfeeding for 6 versus 4 months, developing countries, controlled trials, Outcome 24 % of days with nasal discharge 4‐6 months. | ||||
| 25 % of days with hoarseness 4‐6 months Show forest plot | 2 | 260 | Mean Difference (IV, Fixed, 95% CI) | ‐0.19 [‐1.17, 0.79] |
| Analysis 1.25  Comparison 1 Exclusive breastfeeding for 6 versus 4 months, developing countries, controlled trials, Outcome 25 % of days with hoarseness 4‐6 months. | ||||
| 26 % of days with diarrhea 4‐6 months Show forest plot | 2 | 260 | Mean Difference (IV, Fixed, 95% CI) | 1.15 [‐0.35, 2.65] |
| Analysis 1.26  Comparison 1 Exclusive breastfeeding for 6 versus 4 months, developing countries, controlled trials, Outcome 26 % of days with diarrhea 4‐6 months. | ||||
| 27 % of days with fever 6‐12 months Show forest plot | 2 | 258 | Mean Difference (IV, Fixed, 95% CI) | ‐0.39 [‐2.80, 2.02] |
| Analysis 1.27  Comparison 1 Exclusive breastfeeding for 6 versus 4 months, developing countries, controlled trials, Outcome 27 % of days with fever 6‐12 months. | ||||
| 28 % of days with nasal congestion 6‐12 months Show forest plot | 2 | 258 | Mean Difference (IV, Fixed, 95% CI) | 3.11 [‐0.12, 6.35] |
| Analysis 1.28  Comparison 1 Exclusive breastfeeding for 6 versus 4 months, developing countries, controlled trials, Outcome 28 % of days with nasal congestion 6‐12 months. | ||||
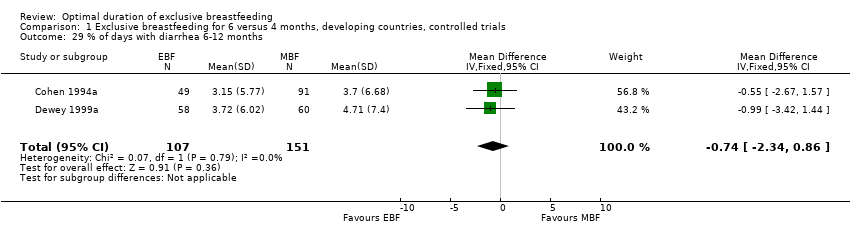
| 29 % of days with diarrhea 6‐12 months Show forest plot | 2 | 258 | Mean Difference (IV, Fixed, 95% CI) | ‐0.74 [‐2.34, 0.86] |
| Analysis 1.29  Comparison 1 Exclusive breastfeeding for 6 versus 4 months, developing countries, controlled trials, Outcome 29 % of days with diarrhea 6‐12 months. | ||||
| 30 Age first crawled (mo) Show forest plot | 2 | 240 | Mean Difference (IV, Fixed, 95% CI) | ‐0.80 [‐1.26, ‐0.34] |
| Analysis 1.30  Comparison 1 Exclusive breastfeeding for 6 versus 4 months, developing countries, controlled trials, Outcome 30 Age first crawled (mo). | ||||
| 31 Age first sat from lying position (mo) Show forest plot | 2 | 238 | Mean Difference (IV, Random, 95% CI) | ‐0.22 [‐0.91, 0.46] |
| Analysis 1.31  Comparison 1 Exclusive breastfeeding for 6 versus 4 months, developing countries, controlled trials, Outcome 31 Age first sat from lying position (mo). | ||||
| 32 Did not walk by 12 months Show forest plot | 2 | 233 | Risk Ratio (M‐H, Random, 95% CI) | 0.88 [0.50, 1.55] |
| Analysis 1.32  Comparison 1 Exclusive breastfeeding for 6 versus 4 months, developing countries, controlled trials, Outcome 32 Did not walk by 12 months. | ||||
| 33 Maternal postpartum weight loss 4‐6 months (kg) Show forest plot | 2 | 260 | Mean Difference (IV, Fixed, 95% CI) | 0.42 [0.02, 0.82] |
| Analysis 1.33  Comparison 1 Exclusive breastfeeding for 6 versus 4 months, developing countries, controlled trials, Outcome 33 Maternal postpartum weight loss 4‐6 months (kg). | ||||
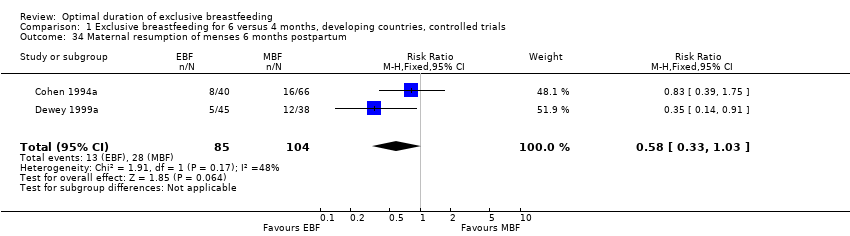
| 34 Maternal resumption of menses 6 months postpartum Show forest plot | 2 | 189 | Risk Ratio (M‐H, Fixed, 95% CI) | 0.58 [0.33, 1.03] |
| Analysis 1.34  Comparison 1 Exclusive breastfeeding for 6 versus 4 months, developing countries, controlled trials, Outcome 34 Maternal resumption of menses 6 months postpartum. | ||||
| Outcome or subgroup title | No. of studies | No. of participants | Statistical method | Effect size |
| 1 Monthly weight gain 4‐6 months (g/mo) Show forest plot | 4 | 1803 | Mean Difference (IV, Fixed, 95% CI) | ‐10.10 [‐27.68, 7.48] |
| Analysis 2.1  Comparison 2 Exclusive breastfeeding for 6‐7 versus 3‐4 months, developing countries, observational studies, Outcome 1 Monthly weight gain 4‐6 months (g/mo). | ||||
| 2 Monthly weight gain 6‐9 months (g/mo) Show forest plot | 1 | 319 | Mean Difference (IV, Fixed, 95% CI) | ‐6.0 [‐54.15, 42.15] |
| Analysis 2.2  Comparison 2 Exclusive breastfeeding for 6‐7 versus 3‐4 months, developing countries, observational studies, Outcome 2 Monthly weight gain 6‐9 months (g/mo). | ||||
| 3 Monthly length gain 4‐6 months (cm/mo) Show forest plot | 4 | 1803 | Mean Difference (IV, Fixed, 95% CI) | 0.04 [‐0.02, 0.11] |
| Analysis 2.3  Comparison 2 Exclusive breastfeeding for 6‐7 versus 3‐4 months, developing countries, observational studies, Outcome 3 Monthly length gain 4‐6 months (cm/mo). | ||||
| 4 Monthly length gain 6‐9 months (cm/mo) Show forest plot | 1 | 319 | Mean Difference (IV, Fixed, 95% CI) | 0.04 [‐0.06, 0.14] |
| Analysis 2.4  Comparison 2 Exclusive breastfeeding for 6‐7 versus 3‐4 months, developing countries, observational studies, Outcome 4 Monthly length gain 6‐9 months (cm/mo). | ||||
| 5 Weight‐for‐age z‐score at 6‐7 months Show forest plot | 1 | 370 | Mean Difference (IV, Fixed, 95% CI) | 0.13 [‐0.09, 0.35] |
| Analysis 2.5  Comparison 2 Exclusive breastfeeding for 6‐7 versus 3‐4 months, developing countries, observational studies, Outcome 5 Weight‐for‐age z‐score at 6‐7 months. | ||||
| 6 Weight‐for‐age z‐score at 9‐10 months Show forest plot | 1 | 319 | Mean Difference (IV, Fixed, 95% CI) | 0.09 [‐0.15, 0.33] |
| Analysis 2.6  Comparison 2 Exclusive breastfeeding for 6‐7 versus 3‐4 months, developing countries, observational studies, Outcome 6 Weight‐for‐age z‐score at 9‐10 months. | ||||
| 7 Length‐for‐age z‐score at 6‐7 months Show forest plot | 1 | 370 | Mean Difference (IV, Fixed, 95% CI) | 0.04 [‐0.14, 0.22] |
| Analysis 2.7  Comparison 2 Exclusive breastfeeding for 6‐7 versus 3‐4 months, developing countries, observational studies, Outcome 7 Length‐for‐age z‐score at 6‐7 months. | ||||
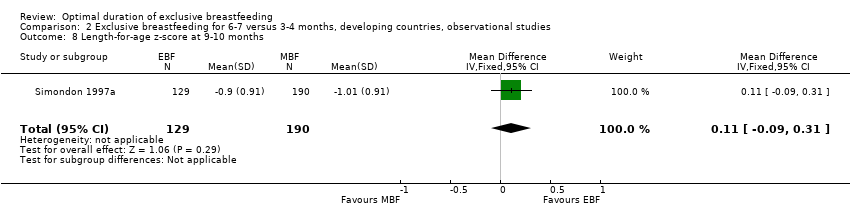
| 8 Length‐for‐age z‐score at 9‐10 months Show forest plot | 1 | 319 | Mean Difference (IV, Fixed, 95% CI) | 0.11 [‐0.09, 0.31] |
| Analysis 2.8  Comparison 2 Exclusive breastfeeding for 6‐7 versus 3‐4 months, developing countries, observational studies, Outcome 8 Length‐for‐age z‐score at 9‐10 months. | ||||
| 9 Weight‐for‐length z‐score at 6‐7 months Show forest plot | 1 | 370 | Mean Difference (IV, Fixed, 95% CI) | 0.11 [‐0.09, 0.31] |
| Analysis 2.9  Comparison 2 Exclusive breastfeeding for 6‐7 versus 3‐4 months, developing countries, observational studies, Outcome 9 Weight‐for‐length z‐score at 6‐7 months. | ||||
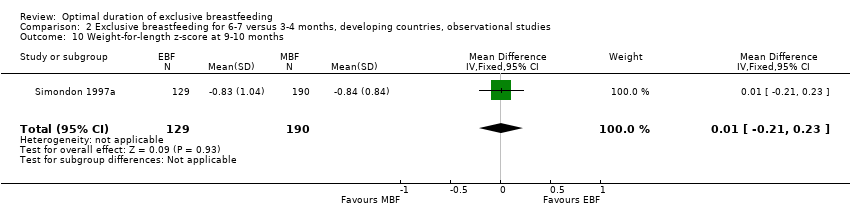
| 10 Weight‐for‐length z‐score at 9‐10 months Show forest plot | 1 | 319 | Mean Difference (IV, Fixed, 95% CI) | 0.01 [‐0.21, 0.23] |
| Analysis 2.10  Comparison 2 Exclusive breastfeeding for 6‐7 versus 3‐4 months, developing countries, observational studies, Outcome 10 Weight‐for‐length z‐score at 9‐10 months. | ||||
| 11 Weight‐for‐age z‐score < ‐2 at 6‐7 months Show forest plot | 1 | 370 | Risk Ratio (M‐H, Fixed, 95% CI) | 0.92 [0.54, 1.58] |
| Analysis 2.11  Comparison 2 Exclusive breastfeeding for 6‐7 versus 3‐4 months, developing countries, observational studies, Outcome 11 Weight‐for‐age z‐score < ‐2 at 6‐7 months. | ||||
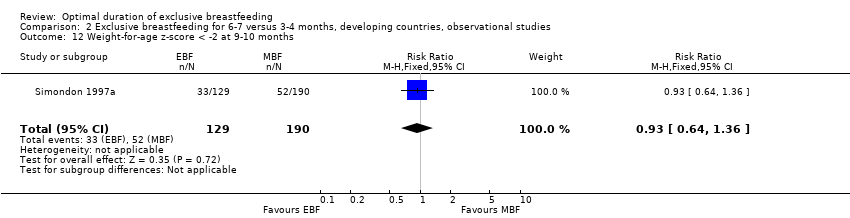
| 12 Weight‐for‐age z‐score < ‐2 at 9‐10 months Show forest plot | 1 | 319 | Risk Ratio (M‐H, Fixed, 95% CI) | 0.93 [0.64, 1.36] |
| Analysis 2.12  Comparison 2 Exclusive breastfeeding for 6‐7 versus 3‐4 months, developing countries, observational studies, Outcome 12 Weight‐for‐age z‐score < ‐2 at 9‐10 months. | ||||
| 13 Length‐for‐age z‐score < ‐2 at 6‐7 months Show forest plot | 1 | 370 | Risk Ratio (M‐H, Fixed, 95% CI) | 1.20 [0.57, 2.53] |
| Analysis 2.13  Comparison 2 Exclusive breastfeeding for 6‐7 versus 3‐4 months, developing countries, observational studies, Outcome 13 Length‐for‐age z‐score < ‐2 at 6‐7 months. | ||||
| 14 Length‐for‐age z‐score < ‐2 at 9‐10 months Show forest plot | 1 | 319 | Risk Ratio (M‐H, Fixed, 95% CI) | 1.21 [0.62, 2.37] |
| Analysis 2.14  Comparison 2 Exclusive breastfeeding for 6‐7 versus 3‐4 months, developing countries, observational studies, Outcome 14 Length‐for‐age z‐score < ‐2 at 9‐10 months. | ||||
| 15 Weight‐for‐length z‐score < ‐2 at 6‐7 months Show forest plot | 1 | 370 | Risk Ratio (M‐H, Fixed, 95% CI) | 0.42 [0.12, 1.50] |
| Analysis 2.15  Comparison 2 Exclusive breastfeeding for 6‐7 versus 3‐4 months, developing countries, observational studies, Outcome 15 Weight‐for‐length z‐score < ‐2 at 6‐7 months. | ||||
| 16 Weight‐for‐length z‐score < ‐2 at 9‐10 months Show forest plot | 1 | 319 | Risk Ratio (M‐H, Fixed, 95% CI) | 0.82 [0.39, 1.71] |
| Analysis 2.16  Comparison 2 Exclusive breastfeeding for 6‐7 versus 3‐4 months, developing countries, observational studies, Outcome 16 Weight‐for‐length z‐score < ‐2 at 9‐10 months. | ||||
| 17 Mid‐upper arm circumference at 6‐7 months (cm) Show forest plot | 1 | 370 | Mean Difference (IV, Fixed, 95% CI) | 0.20 [‐0.04, 0.44] |
| Analysis 2.17  Comparison 2 Exclusive breastfeeding for 6‐7 versus 3‐4 months, developing countries, observational studies, Outcome 17 Mid‐upper arm circumference at 6‐7 months (cm). | ||||
| 18 Mid‐upper arm circumference at 9‐10 months (cm) Show forest plot | 1 | 319 | Mean Difference (IV, Fixed, 95% CI) | 0.10 [‐0.16, 0.36] |
| Analysis 2.18  Comparison 2 Exclusive breastfeeding for 6‐7 versus 3‐4 months, developing countries, observational studies, Outcome 18 Mid‐upper arm circumference at 9‐10 months (cm). | ||||
| 19 One or more episodes of gastrointestinal infection at 4‐6 months Show forest plot | 1 | 193 | Risk Ratio (M‐H, Fixed, 95% CI) | 0.41 [0.21, 0.78] |
| Analysis 2.19  Comparison 2 Exclusive breastfeeding for 6‐7 versus 3‐4 months, developing countries, observational studies, Outcome 19 One or more episodes of gastrointestinal infection at 4‐6 months. | ||||
| 20 One or more episodes of respiratory infection at 4‐6 months Show forest plot | 1 | 193 | Risk Ratio (M‐H, Fixed, 95% CI) | 0.68 [0.43, 1.06] |
| Analysis 2.20  Comparison 2 Exclusive breastfeeding for 6‐7 versus 3‐4 months, developing countries, observational studies, Outcome 20 One or more episodes of respiratory infection at 4‐6 months. | ||||
| 21 Resumption of menses by 6‐7 months postpartum Show forest plot | 1 | 686 | Risk Ratio (M‐H, Fixed, 95% CI) | 0.19 [0.05, 0.79] |
| Analysis 2.21  Comparison 2 Exclusive breastfeeding for 6‐7 versus 3‐4 months, developing countries, observational studies, Outcome 21 Resumption of menses by 6‐7 months postpartum. | ||||
| Outcome or subgroup title | No. of studies | No. of participants | Statistical method | Effect size |
| 1 Weight‐for‐age < 75% of reference mean Show forest plot | 1 | 31 | Risk Ratio (M‐H, Fixed, 95% CI) | 0.61 [0.26, 1.43] |
| Analysis 3.1  Comparison 3 Exclusive breastfeeding for > 6 months versus 6 months, developing countries, observational studies, Outcome 1 Weight‐for‐age < 75% of reference mean. | ||||
| Outcome or subgroup title | No. of studies | No. of participants | Statistical method | Effect size |
| 1 Monthly weight gain 3‐8 months (g/mo) Show forest plot | 4 | 4388 | Mean Difference (IV, Random, 95% CI) | ‐7.95 [‐31.84, 15.93] |
| Analysis 4.1  Comparison 4 Exclusive breastfeeding for 6‐7 months versus 3‐4 months, developed countries, observational studies, Outcome 1 Monthly weight gain 3‐8 months (g/mo). | ||||
| 2 Monthly weight gain 6‐9 months (g/mo) Show forest plot | 2 | 3432 | Mean Difference (IV, Random, 95% CI) | 21.11 [‐44.70, 86.91] |
| Analysis 4.2  Comparison 4 Exclusive breastfeeding for 6‐7 months versus 3‐4 months, developed countries, observational studies, Outcome 2 Monthly weight gain 6‐9 months (g/mo). | ||||
| 3 Monthly weight gain 8‐12 months (g/mo) Show forest plot | 3 | 3450 | Mean Difference (IV, Fixed, 95% CI) | ‐1.82 [‐16.72, 13.08] |
| Analysis 4.3  Comparison 4 Exclusive breastfeeding for 6‐7 months versus 3‐4 months, developed countries, observational studies, Outcome 3 Monthly weight gain 8‐12 months (g/mo). | ||||
| 4 Monthly length gain 3‐8 months (cm/mo) Show forest plot | 4 | 4385 | Mean Difference (IV, Random, 95% CI) | ‐0.03 [‐0.11, 0.06] |
| Analysis 4.4  Comparison 4 Exclusive breastfeeding for 6‐7 months versus 3‐4 months, developed countries, observational studies, Outcome 4 Monthly length gain 3‐8 months (cm/mo). | ||||
| 5 Monthly length gain 6‐9 months (cm/mo) Show forest plot | 2 | 3430 | Mean Difference (IV, Fixed, 95% CI) | ‐0.04 [‐0.10, 0.01] |
| Analysis 4.5  Comparison 4 Exclusive breastfeeding for 6‐7 months versus 3‐4 months, developed countries, observational studies, Outcome 5 Monthly length gain 6‐9 months (cm/mo). | ||||
| 6 Monthly length gain 8‐12 months (cm/mo) Show forest plot | 3 | 3448 | Mean Difference (IV, Fixed, 95% CI) | 0.09 [0.03, 0.14] |
| Analysis 4.6  Comparison 4 Exclusive breastfeeding for 6‐7 months versus 3‐4 months, developed countries, observational studies, Outcome 6 Monthly length gain 8‐12 months (cm/mo). | ||||
| 7 Weight‐for‐age z‐score at 6 months Show forest plot | 1 | 3455 | Mean Difference (IV, Fixed, 95% CI) | ‐0.09 [‐0.16, ‐0.02] |
| Analysis 4.7  Comparison 4 Exclusive breastfeeding for 6‐7 months versus 3‐4 months, developed countries, observational studies, Outcome 7 Weight‐for‐age z‐score at 6 months. | ||||
| 8 Weight‐for‐age z‐score at 9 months Show forest plot | 1 | 3400 | Mean Difference (IV, Fixed, 95% CI) | ‐0.10 [‐0.18, ‐0.02] |
| Analysis 4.8  Comparison 4 Exclusive breastfeeding for 6‐7 months versus 3‐4 months, developed countries, observational studies, Outcome 8 Weight‐for‐age z‐score at 9 months. | ||||
| 9 Weight‐for‐age z‐score at 12 months Show forest plot | 1 | 3458 | Mean Difference (IV, Fixed, 95% CI) | ‐0.09 [‐0.17, ‐0.01] |
| Analysis 4.9  Comparison 4 Exclusive breastfeeding for 6‐7 months versus 3‐4 months, developed countries, observational studies, Outcome 9 Weight‐for‐age z‐score at 12 months. | ||||
| 10 Length‐for‐age z‐score at 6 months Show forest plot | 1 | 3454 | Mean Difference (IV, Fixed, 95% CI) | ‐0.12 [‐0.20, ‐0.04] |
| Analysis 4.10  Comparison 4 Exclusive breastfeeding for 6‐7 months versus 3‐4 months, developed countries, observational studies, Outcome 10 Length‐for‐age z‐score at 6 months. | ||||
| 11 Length‐for‐age z‐score at 9 months Show forest plot | 1 | 3398 | Mean Difference (IV, Fixed, 95% CI) | ‐0.14 [‐0.22, ‐0.06] |
| Analysis 4.11  Comparison 4 Exclusive breastfeeding for 6‐7 months versus 3‐4 months, developed countries, observational studies, Outcome 11 Length‐for‐age z‐score at 9 months. | ||||
| 12 Length‐for‐age z‐score at 12 months Show forest plot | 1 | 3458 | Mean Difference (IV, Fixed, 95% CI) | ‐0.02 [‐0.10, 0.06] |
| Analysis 4.12  Comparison 4 Exclusive breastfeeding for 6‐7 months versus 3‐4 months, developed countries, observational studies, Outcome 12 Length‐for‐age z‐score at 12 months. | ||||
| 13 Weight‐for‐length z‐score at 6 months Show forest plot | 1 | 3454 | Mean Difference (IV, Fixed, 95% CI) | 0.02 [‐0.07, 0.11] |
| Analysis 4.13  Comparison 4 Exclusive breastfeeding for 6‐7 months versus 3‐4 months, developed countries, observational studies, Outcome 13 Weight‐for‐length z‐score at 6 months. | ||||
| 14 Weight‐for‐length z‐score at 9 months Show forest plot | 1 | 3398 | Mean Difference (IV, Fixed, 95% CI) | 0.03 [‐0.06, 0.12] |
| Analysis 4.14  Comparison 4 Exclusive breastfeeding for 6‐7 months versus 3‐4 months, developed countries, observational studies, Outcome 14 Weight‐for‐length z‐score at 9 months. | ||||
| 15 Weight‐for‐length z‐score at 12 months Show forest plot | 1 | 3458 | Mean Difference (IV, Fixed, 95% CI) | ‐0.08 [‐0.17, 0.01] |
| Analysis 4.15  Comparison 4 Exclusive breastfeeding for 6‐7 months versus 3‐4 months, developed countries, observational studies, Outcome 15 Weight‐for‐length z‐score at 12 months. | ||||
| 16 Weight‐for‐age z‐score < ‐2 at 6 months Show forest plot | 1 | 3461 | Risk Ratio (M‐H, Fixed, 95% CI) | 0.92 [0.04, 19.04] |
| Analysis 4.16  Comparison 4 Exclusive breastfeeding for 6‐7 months versus 3‐4 months, developed countries, observational studies, Outcome 16 Weight‐for‐age z‐score < ‐2 at 6 months. | ||||
| 17 Weight‐for‐age z‐score < ‐2 at 9 months Show forest plot | 1 | 3408 | Risk Ratio (M‐H, Fixed, 95% CI) | 1.52 [0.16, 14.62] |
| Analysis 4.17  Comparison 4 Exclusive breastfeeding for 6‐7 months versus 3‐4 months, developed countries, observational studies, Outcome 17 Weight‐for‐age z‐score < ‐2 at 9 months. | ||||
| 18 Weight‐for‐age z‐score < ‐2 at 12 months Show forest plot | 1 | 3466 | Risk Ratio (M‐H, Fixed, 95% CI) | 1.15 [0.13, 10.31] |
| Analysis 4.18  Comparison 4 Exclusive breastfeeding for 6‐7 months versus 3‐4 months, developed countries, observational studies, Outcome 18 Weight‐for‐age z‐score < ‐2 at 12 months. | ||||
| 19 Length‐for‐age z‐score < ‐2 at 6 months Show forest plot | 1 | 3460 | Risk Ratio (M‐H, Fixed, 95% CI) | 1.53 [0.84, 2.78] |
| Analysis 4.19  Comparison 4 Exclusive breastfeeding for 6‐7 months versus 3‐4 months, developed countries, observational studies, Outcome 19 Length‐for‐age z‐score < ‐2 at 6 months. | ||||
| 20 Length‐for‐age z‐score < ‐2 at 9 months Show forest plot | 1 | 3406 | Risk Ratio (M‐H, Fixed, 95% CI) | 1.46 [0.80, 2.64] |
| Analysis 4.20  Comparison 4 Exclusive breastfeeding for 6‐7 months versus 3‐4 months, developed countries, observational studies, Outcome 20 Length‐for‐age z‐score < ‐2 at 9 months. | ||||
| 21 Length‐for‐age z‐score < ‐2 at 12 months Show forest plot | 1 | 3466 | Risk Ratio (M‐H, Fixed, 95% CI) | 0.66 [0.23, 1.87] |
| Analysis 4.21  Comparison 4 Exclusive breastfeeding for 6‐7 months versus 3‐4 months, developed countries, observational studies, Outcome 21 Length‐for‐age z‐score < ‐2 at 12 months. | ||||
| 22 Weight‐for‐length z‐score < ‐2 at 6 months Show forest plot | 1 | 3460 | Risk Ratio (M‐H, Fixed, 95% CI) | 0.31 [0.02, 5.34] |
| Analysis 4.22  Comparison 4 Exclusive breastfeeding for 6‐7 months versus 3‐4 months, developed countries, observational studies, Outcome 22 Weight‐for‐length z‐score < ‐2 at 6 months. | ||||
| 23 Weight‐for‐length z‐score < ‐2 at 9 months Show forest plot | 1 | 3406 | Risk Ratio (M‐H, Fixed, 95% CI) | 1.14 [0.24, 5.37] |
| Analysis 4.23  Comparison 4 Exclusive breastfeeding for 6‐7 months versus 3‐4 months, developed countries, observational studies, Outcome 23 Weight‐for‐length z‐score < ‐2 at 9 months. | ||||
| 24 Weight‐for‐length z‐score < ‐2 at 12 months Show forest plot | 1 | 3466 | Risk Ratio (M‐H, Fixed, 95% CI) | 1.15 [0.13, 10.31] |
| Analysis 4.24  Comparison 4 Exclusive breastfeeding for 6‐7 months versus 3‐4 months, developed countries, observational studies, Outcome 24 Weight‐for‐length z‐score < ‐2 at 12 months. | ||||
| 25 Head circumference at 6 months (cm) Show forest plot | 1 | 3440 | Mean Difference (IV, Fixed, 95% CI) | ‐0.10 [‐0.23, 0.03] |
| Analysis 4.25  Comparison 4 Exclusive breastfeeding for 6‐7 months versus 3‐4 months, developed countries, observational studies, Outcome 25 Head circumference at 6 months (cm). | ||||
| 26 Head circumference at 9 months (cm) Show forest plot | 1 | 3389 | Mean Difference (IV, Fixed, 95% CI) | 0.07 [‐0.06, 0.20] |
| Analysis 4.26  Comparison 4 Exclusive breastfeeding for 6‐7 months versus 3‐4 months, developed countries, observational studies, Outcome 26 Head circumference at 9 months (cm). | ||||
| 27 Head circumference at 12 months (cm) Show forest plot | 1 | 3450 | Mean Difference (IV, Fixed, 95% CI) | 0.19 [0.06, 0.32] |
| Analysis 4.27  Comparison 4 Exclusive breastfeeding for 6‐7 months versus 3‐4 months, developed countries, observational studies, Outcome 27 Head circumference at 12 months (cm). | ||||
| 28 Sleeping time at 9 months (min/day) Show forest plot | 1 | 50 | Mean Difference (IV, Fixed, 95% CI) | 1.0 [‐36.65, 38.65] |
| Analysis 4.28  Comparison 4 Exclusive breastfeeding for 6‐7 months versus 3‐4 months, developed countries, observational studies, Outcome 28 Sleeping time at 9 months (min/day). | ||||
| 29 Total essential amino acid concentration (umol/L) at 6 months Show forest plot | 1 | 44 | Mean Difference (IV, Fixed, 95% CI) | 22.0 [‐59.60, 103.60] |
| Analysis 4.29  Comparison 4 Exclusive breastfeeding for 6‐7 months versus 3‐4 months, developed countries, observational studies, Outcome 29 Total essential amino acid concentration (umol/L) at 6 months. | ||||
| 30 Total amino acid concentration (umol/L) at 6 months Show forest plot | 1 | 44 | Mean Difference (IV, Fixed, 95% CI) | 73.0 [‐118.22, 264.22] |
| Analysis 4.30  Comparison 4 Exclusive breastfeeding for 6‐7 months versus 3‐4 months, developed countries, observational studies, Outcome 30 Total amino acid concentration (umol/L) at 6 months. | ||||
| 31 Atopic eczema in first 12 months Show forest plot | 2 | 3618 | Risk Ratio (M‐H, Random, 95% CI) | 0.65 [0.27, 1.59] |
| Analysis 4.31  Comparison 4 Exclusive breastfeeding for 6‐7 months versus 3‐4 months, developed countries, observational studies, Outcome 31 Atopic eczema in first 12 months. | ||||
| 32 Food allergy at 1 year (by history) Show forest plot | 1 | 135 | Risk Ratio (M‐H, Fixed, 95% CI) | 0.19 [0.08, 0.48] |
| Analysis 4.32  Comparison 4 Exclusive breastfeeding for 6‐7 months versus 3‐4 months, developed countries, observational studies, Outcome 32 Food allergy at 1 year (by history). | ||||
| 33 Food allergy at 1 year (by double challenge) Show forest plot | 1 | 135 | Risk Ratio (M‐H, Fixed, 95% CI) | 0.77 [0.25, 2.41] |
| Analysis 4.33  Comparison 4 Exclusive breastfeeding for 6‐7 months versus 3‐4 months, developed countries, observational studies, Outcome 33 Food allergy at 1 year (by double challenge). | ||||
| 34 Two or more episodes of wheezing in first 12 months Show forest plot | 2 | 3993 | Risk Ratio (M‐H, Fixed, 95% CI) | 0.79 [0.49, 1.28] |
| Analysis 4.34  Comparison 4 Exclusive breastfeeding for 6‐7 months versus 3‐4 months, developed countries, observational studies, Outcome 34 Two or more episodes of wheezing in first 12 months. | ||||
| 35 Hemoglobin concentration (g/L) at 12 months Show forest plot | 1 | 30 | Mean Difference (IV, Fixed, 95% CI) | 8.0 [4.03, 11.97] |
| Analysis 4.35  Comparison 4 Exclusive breastfeeding for 6‐7 months versus 3‐4 months, developed countries, observational studies, Outcome 35 Hemoglobin concentration (g/L) at 12 months. | ||||
| 36 Hemoglobin concentration < 110 g/L at 12 months Show forest plot | 1 | 30 | Risk Ratio (M‐H, Fixed, 95% CI) | 0.12 [0.01, 1.80] |
| Analysis 4.36  Comparison 4 Exclusive breastfeeding for 6‐7 months versus 3‐4 months, developed countries, observational studies, Outcome 36 Hemoglobin concentration < 110 g/L at 12 months. | ||||
| 37 Serum ferritin concentration (mcg/L) at 12 months Show forest plot | 1 | 30 | Mean Difference (IV, Fixed, 95% CI) | 4.70 [‐6.30, 15.70] |
| Analysis 4.37  Comparison 4 Exclusive breastfeeding for 6‐7 months versus 3‐4 months, developed countries, observational studies, Outcome 37 Serum ferritin concentration (mcg/L) at 12 months. | ||||
| 38 Serum ferritin concentration < 10 mcg/L at 12 months Show forest plot | 1 | 30 | Risk Ratio (M‐H, Fixed, 95% CI) | 0.42 [0.12, 1.54] |
| Analysis 4.38  Comparison 4 Exclusive breastfeeding for 6‐7 months versus 3‐4 months, developed countries, observational studies, Outcome 38 Serum ferritin concentration < 10 mcg/L at 12 months. | ||||
| 39 One or more episodes of gastrointestinal infection in first 12 months Show forest plot | 1 | 3483 | Risk Ratio (M‐H, Fixed, 95% CI) | 0.67 [0.46, 0.97] |
| Analysis 4.39  Comparison 4 Exclusive breastfeeding for 6‐7 months versus 3‐4 months, developed countries, observational studies, Outcome 39 One or more episodes of gastrointestinal infection in first 12 months. | ||||
| 40 Hospitalization for gastrointestinal infection in first 12 months Show forest plot | 1 | 3483 | Risk Ratio (M‐H, Fixed, 95% CI) | 0.79 [0.42, 1.49] |
| Analysis 4.40  Comparison 4 Exclusive breastfeeding for 6‐7 months versus 3‐4 months, developed countries, observational studies, Outcome 40 Hospitalization for gastrointestinal infection in first 12 months. | ||||
| 41 One or more episodes of upper respiratory tract infection in first 12 months Show forest plot | 1 | 510 | Risk Ratio (M‐H, Fixed, 95% CI) | 1.07 [0.96, 1.20] |
| Analysis 4.41  Comparison 4 Exclusive breastfeeding for 6‐7 months versus 3‐4 months, developed countries, observational studies, Outcome 41 One or more episodes of upper respiratory tract infection in first 12 months. | ||||
| 42 Two or more episodes of upper respiratory tract infection in first 12 months Show forest plot | 2 | 3993 | Risk Ratio (M‐H, Fixed, 95% CI) | 0.91 [0.82, 1.02] |
| Analysis 4.42  Comparison 4 Exclusive breastfeeding for 6‐7 months versus 3‐4 months, developed countries, observational studies, Outcome 42 Two or more episodes of upper respiratory tract infection in first 12 months. | ||||
| 43 Four or more episodes of upper respiratory tract infection in first 12 months Show forest plot | 1 | 510 | Risk Ratio (M‐H, Fixed, 95% CI) | 0.82 [0.52, 1.29] |
| Analysis 4.43  Comparison 4 Exclusive breastfeeding for 6‐7 months versus 3‐4 months, developed countries, observational studies, Outcome 43 Four or more episodes of upper respiratory tract infection in first 12 months. | ||||
| 44 One or more episodes of lower respiratory tract infection in first 12 months Show forest plot | 1 | 510 | Risk Ratio (M‐H, Fixed, 95% CI) | 1.07 [0.86, 1.33] |
| Analysis 4.44  Comparison 4 Exclusive breastfeeding for 6‐7 months versus 3‐4 months, developed countries, observational studies, Outcome 44 One or more episodes of lower respiratory tract infection in first 12 months. | ||||
| 45 Two or more episodes of respiratory tract infection (upper or lower) in first 12 months Show forest plot | 1 | 3483 | Risk Ratio (M‐H, Fixed, 95% CI) | 0.90 [0.79, 1.03] |
| Analysis 4.45  Comparison 4 Exclusive breastfeeding for 6‐7 months versus 3‐4 months, developed countries, observational studies, Outcome 45 Two or more episodes of respiratory tract infection (upper or lower) in first 12 months. | ||||
| 46 Hospitalization for respiratory tract infection in first 12 months Show forest plot | 2 | 3993 | Risk Ratio (M‐H, Fixed, 95% CI) | 0.75 [0.60, 0.94] |
| Analysis 4.46  Comparison 4 Exclusive breastfeeding for 6‐7 months versus 3‐4 months, developed countries, observational studies, Outcome 46 Hospitalization for respiratory tract infection in first 12 months. | ||||
| 47 Number of episodes of otitis media in first 12 months Show forest plot | 1 | 279 | Mean Difference (IV, Fixed, 95% CI) | ‐0.04 [‐0.49, 0.41] |
| Analysis 4.47  Comparison 4 Exclusive breastfeeding for 6‐7 months versus 3‐4 months, developed countries, observational studies, Outcome 47 Number of episodes of otitis media in first 12 months. | ||||
| 48 One or more episodes of otitis media in first 12 months Show forest plot | 2 | 3762 | Risk Ratio (M‐H, Fixed, 95% CI) | 1.28 [1.04, 1.57] |
| Analysis 4.48  Comparison 4 Exclusive breastfeeding for 6‐7 months versus 3‐4 months, developed countries, observational studies, Outcome 48 One or more episodes of otitis media in first 12 months. | ||||
| 49 Frequent otitis media in first 12 months Show forest plot | 1 | 279 | Risk Ratio (M‐H, Fixed, 95% CI) | 0.81 [0.43, 1.52] |
| Analysis 4.49  Comparison 4 Exclusive breastfeeding for 6‐7 months versus 3‐4 months, developed countries, observational studies, Outcome 49 Frequent otitis media in first 12 months. | ||||
| 50 Death in first 12 months Show forest plot | 1 | 3483 | Risk Ratio (M‐H, Fixed, 95% CI) | 2.30 [0.21, 25.37] |
| Analysis 4.50  Comparison 4 Exclusive breastfeeding for 6‐7 months versus 3‐4 months, developed countries, observational studies, Outcome 50 Death in first 12 months. | ||||
| 51 Any dental caries (decayed, missing, or filled teeth) at 6 years Show forest plot | 1 | 2948 | Risk Ratio (M‐H, Fixed, 95% CI) | 0.98 [0.94, 1.03] |
| Analysis 4.51  Comparison 4 Exclusive breastfeeding for 6‐7 months versus 3‐4 months, developed countries, observational studies, Outcome 51 Any dental caries (decayed, missing, or filled teeth) at 6 years. | ||||
| 52 Any incisor caries (decayed, missing, or filled teeth) at 6 years Show forest plot | 1 | 2948 | Odds Ratio (M‐H, Fixed, 95% CI) | 0.91 [0.72, 1.16] |
| Analysis 4.52  Comparison 4 Exclusive breastfeeding for 6‐7 months versus 3‐4 months, developed countries, observational studies, Outcome 52 Any incisor caries (decayed, missing, or filled teeth) at 6 years. | ||||
| 53 Height at 6.5 years Show forest plot | 1 | 2951 | Mean Difference (IV, Fixed, 95% CI) | 0.10 [‐0.40, 0.60] |
| Analysis 4.53  Comparison 4 Exclusive breastfeeding for 6‐7 months versus 3‐4 months, developed countries, observational studies, Outcome 53 Height at 6.5 years. | ||||
| 54 Leg length at 6.5 years Show forest plot | 1 | 2951 | Mean Difference (IV, Fixed, 95% CI) | 0.20 [‐0.14, 0.54] |
| Analysis 4.54  Comparison 4 Exclusive breastfeeding for 6‐7 months versus 3‐4 months, developed countries, observational studies, Outcome 54 Leg length at 6.5 years. | ||||
| 55 Head circumference at 6.5 years Show forest plot | 1 | 2951 | Mean Difference (IV, Fixed, 95% CI) | 0.10 [‐0.04, 0.24] |
| Analysis 4.55  Comparison 4 Exclusive breastfeeding for 6‐7 months versus 3‐4 months, developed countries, observational studies, Outcome 55 Head circumference at 6.5 years. | ||||
| 56 BMI at 6.5 years Show forest plot | 1 | 2951 | Mean Difference (IV, Fixed, 95% CI) | 0.20 [0.02, 0.38] |
| Analysis 4.56  Comparison 4 Exclusive breastfeeding for 6‐7 months versus 3‐4 months, developed countries, observational studies, Outcome 56 BMI at 6.5 years. | ||||
| 57 Triceps skinfold thickness at 6.5 years Show forest plot | 1 | 2951 | Mean Difference (IV, Fixed, 95% CI) | 0.90 [0.51, 1.29] |
| Analysis 4.57  Comparison 4 Exclusive breastfeeding for 6‐7 months versus 3‐4 months, developed countries, observational studies, Outcome 57 Triceps skinfold thickness at 6.5 years. | ||||
| 58 Subscapular skinfold thickness Show forest plot | 1 | 2951 | Mean Difference (IV, Fixed, 95% CI) | 0.5 [0.25, 0.75] |
| Analysis 4.58  Comparison 4 Exclusive breastfeeding for 6‐7 months versus 3‐4 months, developed countries, observational studies, Outcome 58 Subscapular skinfold thickness. | ||||
| 59 Waist circumference at 6.5 years Show forest plot | 1 | 2951 | Mean Difference (IV, Fixed, 95% CI) | 0.0 [‐0.42, 0.42] |
| Analysis 4.59  Comparison 4 Exclusive breastfeeding for 6‐7 months versus 3‐4 months, developed countries, observational studies, Outcome 59 Waist circumference at 6.5 years. | ||||
| 60 Hip circumference at 6.5 years Show forest plot | 1 | 2951 | Mean Difference (IV, Fixed, 95% CI) | 0.5 [0.05, 0.95] |
| Analysis 4.60  Comparison 4 Exclusive breastfeeding for 6‐7 months versus 3‐4 months, developed countries, observational studies, Outcome 60 Hip circumference at 6.5 years. | ||||
| 61 Systolic blood pressure at 6.5 years Show forest plot | 1 | 2951 | Mean Difference (IV, Fixed, 95% CI) | 1.30 [0.39, 2.21] |
| Analysis 4.61  Comparison 4 Exclusive breastfeeding for 6‐7 months versus 3‐4 months, developed countries, observational studies, Outcome 61 Systolic blood pressure at 6.5 years. | ||||
| 62 Diastolic blood pressure at 6.5 years (mm Hg) Show forest plot | 1 | 2951 | Mean Difference (IV, Fixed, 95% CI) | 1.0 [0.29, 1.71] |
| Analysis 4.62  Comparison 4 Exclusive breastfeeding for 6‐7 months versus 3‐4 months, developed countries, observational studies, Outcome 62 Diastolic blood pressure at 6.5 years (mm Hg). | ||||
| 63 Atopic eczema at 5‐7 years Show forest plot | 2 | 3584 | Risk Ratio (M‐H, Fixed, 95% CI) | 0.86 [0.47, 1.58] |
| Analysis 4.63  Comparison 4 Exclusive breastfeeding for 6‐7 months versus 3‐4 months, developed countries, observational studies, Outcome 63 Atopic eczema at 5‐7 years. | ||||
| 64 Hay fever at 5‐7 years Show forest plot | 2 | 3584 | Risk Ratio (M‐H, Random, 95% CI) | 0.80 [0.39, 1.65] |
| Analysis 4.64  Comparison 4 Exclusive breastfeeding for 6‐7 months versus 3‐4 months, developed countries, observational studies, Outcome 64 Hay fever at 5‐7 years. | ||||
| 65 Asthma at 5‐7 years Show forest plot | 3 | 4023 | Risk Ratio (M‐H, Fixed, 95% CI) | 1.02 [0.72, 1.44] |
| Analysis 4.65  Comparison 4 Exclusive breastfeeding for 6‐7 months versus 3‐4 months, developed countries, observational studies, Outcome 65 Asthma at 5‐7 years. | ||||
| 66 Food allergy at 5 years Show forest plot | 1 | 113 | Risk Ratio (M‐H, Fixed, 95% CI) | 0.61 [0.12, 3.19] |
| Analysis 4.66  Comparison 4 Exclusive breastfeeding for 6‐7 months versus 3‐4 months, developed countries, observational studies, Outcome 66 Food allergy at 5 years. | ||||
| 67 Allergy to animal dander at 5 years Show forest plot | 1 | 113 | Risk Ratio (M‐H, Fixed, 95% CI) | 0.81 [0.24, 2.72] |
| Analysis 4.67  Comparison 4 Exclusive breastfeeding for 6‐7 months versus 3‐4 months, developed countries, observational studies, Outcome 67 Allergy to animal dander at 5 years. | ||||
| 68 Positive skin‐prick test to house dust mite at 6.5 years Show forest plot | 1 | 2320 | Odds Ratio (M‐H, Fixed, 95% CI) | 0.86 [0.62, 1.20] |
| Analysis 4.68  Comparison 4 Exclusive breastfeeding for 6‐7 months versus 3‐4 months, developed countries, observational studies, Outcome 68 Positive skin‐prick test to house dust mite at 6.5 years. | ||||
| 69 Positive skin‐prick test to cat dander at 6.5 years Show forest plot | 1 | 2320 | Odds Ratio (M‐H, Fixed, 95% CI) | 0.86 [0.60, 1.24] |
| Analysis 4.69  Comparison 4 Exclusive breastfeeding for 6‐7 months versus 3‐4 months, developed countries, observational studies, Outcome 69 Positive skin‐prick test to cat dander at 6.5 years. | ||||
| 70 Positive skin‐prick test to birch pollen at 6.5 years Show forest plot | 1 | 2320 | Odds Ratio (M‐H, Fixed, 95% CI) | 0.80 [0.55, 1.18] |
| Analysis 4.70  Comparison 4 Exclusive breastfeeding for 6‐7 months versus 3‐4 months, developed countries, observational studies, Outcome 70 Positive skin‐prick test to birch pollen at 6.5 years. | ||||
| 71 Positive skin‐prick test to mixed northern grasses at 6.5 years Show forest plot | 1 | 2320 | Odds Ratio (M‐H, Fixed, 95% CI) | 0.71 [0.50, 1.01] |
| Analysis 4.71  Comparison 4 Exclusive breastfeeding for 6‐7 months versus 3‐4 months, developed countries, observational studies, Outcome 71 Positive skin‐prick test to mixed northern grasses at 6.5 years. | ||||
| 72 Positive skin‐prick test to Alternaria at 6.5 years Show forest plot | 1 | 2320 | Odds Ratio (M‐H, Fixed, 95% CI) | 0.74 [0.47, 1.17] |
| Analysis 4.72  Comparison 4 Exclusive breastfeeding for 6‐7 months versus 3‐4 months, developed countries, observational studies, Outcome 72 Positive skin‐prick test to Alternaria at 6.5 years. | ||||
| 73 Any positive skin‐prick test at 6‐7 years Show forest plot | 2 | 2651 | Risk Ratio (M‐H, Fixed, 95% CI) | 0.95 [0.81, 1.11] |
| Analysis 4.73  Comparison 4 Exclusive breastfeeding for 6‐7 months versus 3‐4 months, developed countries, observational studies, Outcome 73 Any positive skin‐prick test at 6‐7 years. | ||||
| 74 Wechsler cognitive ability test at 6.5 years: vocabulary Show forest plot | 1 | 2944 | Mean Difference (IV, Fixed, 95% CI) | 0.5 [‐0.57, 1.57] |
| Analysis 4.74  Comparison 4 Exclusive breastfeeding for 6‐7 months versus 3‐4 months, developed countries, observational studies, Outcome 74 Wechsler cognitive ability test at 6.5 years: vocabulary. | ||||
| 75 Wechsler cognitive ability test at 6.5 years: similarities Show forest plot | 1 | 2944 | Mean Difference (IV, Fixed, 95% CI) | 0.30 [‐0.56, 1.16] |
| Analysis 4.75  Comparison 4 Exclusive breastfeeding for 6‐7 months versus 3‐4 months, developed countries, observational studies, Outcome 75 Wechsler cognitive ability test at 6.5 years: similarities. | ||||
| 76 Wechsler cognitive ability test at 6.5 years: matrices Show forest plot | 1 | 2944 | Mean Difference (IV, Fixed, 95% CI) | ‐0.20 [‐1.07, 0.67] |
| Analysis 4.76  Comparison 4 Exclusive breastfeeding for 6‐7 months versus 3‐4 months, developed countries, observational studies, Outcome 76 Wechsler cognitive ability test at 6.5 years: matrices. | ||||
| 77 Wechsler cognitive ability test at 6.5 years: block designs Show forest plot | 1 | 2944 | Mean Difference (IV, Fixed, 95% CI) | 1.30 [0.40, 2.20] |
| Analysis 4.77  Comparison 4 Exclusive breastfeeding for 6‐7 months versus 3‐4 months, developed countries, observational studies, Outcome 77 Wechsler cognitive ability test at 6.5 years: block designs. | ||||
| 78 Wechsler cognitive ability test at 6.5 years: verbal IQ Show forest plot | 1 | 2944 | Mean Difference (IV, Fixed, 95% CI) | 0.5 [‐0.95, 1.95] |
| Analysis 4.78  Comparison 4 Exclusive breastfeeding for 6‐7 months versus 3‐4 months, developed countries, observational studies, Outcome 78 Wechsler cognitive ability test at 6.5 years: verbal IQ. | ||||
| 79 Wechsler cognitive ability test at 6.5 years: performance IQ Show forest plot | 1 | 2944 | Mean Difference (IV, Fixed, 95% CI) | 0.80 [‐0.55, 2.15] |
| Analysis 4.79  Comparison 4 Exclusive breastfeeding for 6‐7 months versus 3‐4 months, developed countries, observational studies, Outcome 79 Wechsler cognitive ability test at 6.5 years: performance IQ. | ||||
| 80 Wechsler cognitive ability test at 6.5 years: full‐scale IQ Show forest plot | 1 | 2944 | Mean Difference (IV, Fixed, 95% CI) | 0.80 [‐0.58, 2.18] |
| Analysis 4.80  Comparison 4 Exclusive breastfeeding for 6‐7 months versus 3‐4 months, developed countries, observational studies, Outcome 80 Wechsler cognitive ability test at 6.5 years: full‐scale IQ. | ||||
| 81 Teacher's academic rating at 6.5 years: reading Show forest plot | 1 | 2196 | Mean Difference (IV, Fixed, 95% CI) | ‐0.10 [‐0.19, ‐0.01] |
| Analysis 4.81  Comparison 4 Exclusive breastfeeding for 6‐7 months versus 3‐4 months, developed countries, observational studies, Outcome 81 Teacher's academic rating at 6.5 years: reading. | ||||
| 82 Teacher's academic rating at 6.5 years: writing Show forest plot | 1 | 2196 | Mean Difference (IV, Fixed, 95% CI) | ‐0.12 [‐0.20, ‐0.04] |
| Analysis 4.82  Comparison 4 Exclusive breastfeeding for 6‐7 months versus 3‐4 months, developed countries, observational studies, Outcome 82 Teacher's academic rating at 6.5 years: writing. | ||||
| 83 Teacher's academic rating at 6.5 years: mathematics Show forest plot | 1 | 2196 | Mean Difference (IV, Fixed, 95% CI) | ‐0.04 [‐0.12, 0.04] |
| Analysis 4.83  Comparison 4 Exclusive breastfeeding for 6‐7 months versus 3‐4 months, developed countries, observational studies, Outcome 83 Teacher's academic rating at 6.5 years: mathematics. | ||||
| 84 Teacher's academic rating at 6.5 years: other subjects Show forest plot | 1 | 2196 | Mean Difference (IV, Fixed, 95% CI) | ‐0.10 [‐0.17, ‐0.03] |
| Analysis 4.84  Comparison 4 Exclusive breastfeeding for 6‐7 months versus 3‐4 months, developed countries, observational studies, Outcome 84 Teacher's academic rating at 6.5 years: other subjects. | ||||
| 85 Parent's behavior rating at 6.5 years: total difficulties Show forest plot | 1 | 2941 | Mean Difference (IV, Fixed, 95% CI) | 0.30 [‐0.16, 0.76] |
| Analysis 4.85  Comparison 4 Exclusive breastfeeding for 6‐7 months versus 3‐4 months, developed countries, observational studies, Outcome 85 Parent's behavior rating at 6.5 years: total difficulties. | ||||
| 86 Parent's behavior rating at 6.5 years: emotional symptoms Show forest plot | 1 | 2941 | Mean Difference (IV, Fixed, 95% CI) | 0.10 [‐0.09, 0.29] |
| Analysis 4.86  Comparison 4 Exclusive breastfeeding for 6‐7 months versus 3‐4 months, developed countries, observational studies, Outcome 86 Parent's behavior rating at 6.5 years: emotional symptoms. | ||||
| 87 Parent's behavior rating at 6.5 years: conduct problems Show forest plot | 1 | 2941 | Mean Difference (IV, Fixed, 95% CI) | 0.0 [‐0.13, 0.13] |
| Analysis 4.87  Comparison 4 Exclusive breastfeeding for 6‐7 months versus 3‐4 months, developed countries, observational studies, Outcome 87 Parent's behavior rating at 6.5 years: conduct problems. | ||||
| 88 Parent's behavior rating at 6.5 years: hyperactivity/inattention Show forest plot | 1 | 2941 | Mean Difference (IV, Fixed, 95% CI) | 0.20 [‐0.01, 0.41] |
| Analysis 4.88  Comparison 4 Exclusive breastfeeding for 6‐7 months versus 3‐4 months, developed countries, observational studies, Outcome 88 Parent's behavior rating at 6.5 years: hyperactivity/inattention. | ||||
| 89 Parent's behavior rating at 6.5 years: peer problems Show forest plot | 1 | 2941 | Mean Difference (IV, Fixed, 95% CI) | 0.10 [‐0.05, 0.25] |
| Analysis 4.89  Comparison 4 Exclusive breastfeeding for 6‐7 months versus 3‐4 months, developed countries, observational studies, Outcome 89 Parent's behavior rating at 6.5 years: peer problems. | ||||
| 90 Parent's behavior rating at 6.5 years: prosocial behavior Show forest plot | 1 | 2941 | Mean Difference (IV, Fixed, 95% CI) | 0.10 [‐0.05, 0.25] |
| Analysis 4.90  Comparison 4 Exclusive breastfeeding for 6‐7 months versus 3‐4 months, developed countries, observational studies, Outcome 90 Parent's behavior rating at 6.5 years: prosocial behavior. | ||||
| 91 Teacher's behavior rating at 6.5 years: total difficulties Show forest plot | 1 | 2525 | Mean Difference (IV, Fixed, 95% CI) | 0.10 [‐0.46, 0.66] |
| Analysis 4.91  Comparison 4 Exclusive breastfeeding for 6‐7 months versus 3‐4 months, developed countries, observational studies, Outcome 91 Teacher's behavior rating at 6.5 years: total difficulties. | ||||
| 92 Teacher's behavior rating at 6.5 years: emotional symptoms Show forest plot | 1 | 2525 | Mean Difference (IV, Fixed, 95% CI) | 0.0 [‐0.18, 0.18] |
| Analysis 4.92  Comparison 4 Exclusive breastfeeding for 6‐7 months versus 3‐4 months, developed countries, observational studies, Outcome 92 Teacher's behavior rating at 6.5 years: emotional symptoms. | ||||
| 93 Teacher's behavior rating at 6.5 years: conduct problems Show forest plot | 1 | 2525 | Mean Difference (IV, Fixed, 95% CI) | 0.0 [‐0.17, 0.17] |
| Analysis 4.93  Comparison 4 Exclusive breastfeeding for 6‐7 months versus 3‐4 months, developed countries, observational studies, Outcome 93 Teacher's behavior rating at 6.5 years: conduct problems. | ||||
| 94 Teacher's behavior rating at 6.5 years: hyperactivity/inattention Show forest plot | 1 | 2525 | Mean Difference (IV, Fixed, 95% CI) | ‐0.10 [‐0.37, 0.17] |
| Analysis 4.94  Comparison 4 Exclusive breastfeeding for 6‐7 months versus 3‐4 months, developed countries, observational studies, Outcome 94 Teacher's behavior rating at 6.5 years: hyperactivity/inattention. | ||||
| 95 Teacher's behavior rating at 6.5 years: peer problems Show forest plot | 1 | 2525 | Mean Difference (IV, Fixed, 95% CI) | 0.10 [‐0.08, 0.28] |
| Analysis 4.95  Comparison 4 Exclusive breastfeeding for 6‐7 months versus 3‐4 months, developed countries, observational studies, Outcome 95 Teacher's behavior rating at 6.5 years: peer problems. | ||||
| 96 Teacher's behavior rating at 6.5 years: prosocial behavior Show forest plot | 1 | 2525 | Mean Difference (IV, Fixed, 95% CI) | ‐0.10 [‐0.33, 0.13] |
| Analysis 4.96  Comparison 4 Exclusive breastfeeding for 6‐7 months versus 3‐4 months, developed countries, observational studies, Outcome 96 Teacher's behavior rating at 6.5 years: prosocial behavior. | ||||
| Outcome or subgroup title | No. of studies | No. of participants | Statistical method | Effect size |
| 1 Very low density lipoprotein concentration (mmol/L) at 9 months Show forest plot | 1 | 26 | Mean Difference (IV, Fixed, 95% CI) | 0.05 [‐0.10, 0.20] |
| Analysis 5.1  Comparison 5 Exclusive breastfeeding for > 6 months versus 6 months, developed countries, observational studies, Outcome 1 Very low density lipoprotein concentration (mmol/L) at 9 months. | ||||
| 2 Low density lipoproteinconcentration (mmol/L) at 9 months Show forest plot | 1 | 26 | Mean Difference (IV, Fixed, 95% CI) | ‐0.10 [‐0.88, 0.68] |
| Analysis 5.2  Comparison 5 Exclusive breastfeeding for > 6 months versus 6 months, developed countries, observational studies, Outcome 2 Low density lipoproteinconcentration (mmol/L) at 9 months. | ||||
| 3 High‐density lipoprotein‐2 concentration (mmol/L) at 9 months Show forest plot | 1 | 26 | Mean Difference (IV, Fixed, 95% CI) | 0.08 [‐0.05, 0.21] |
| Analysis 5.3  Comparison 5 Exclusive breastfeeding for > 6 months versus 6 months, developed countries, observational studies, Outcome 3 High‐density lipoprotein‐2 concentration (mmol/L) at 9 months. | ||||
| 4 High‐density lipoprotein‐3 concentration (mmol/L) at 9 months Show forest plot | 1 | 26 | Mean Difference (IV, Fixed, 95% CI) | 0.0 [‐0.07, 0.07] |
| Analysis 5.4  Comparison 5 Exclusive breastfeeding for > 6 months versus 6 months, developed countries, observational studies, Outcome 4 High‐density lipoprotein‐3 concentration (mmol/L) at 9 months. | ||||
| 5 Apoprotein B concentration (mg/dL) at 9 months Show forest plot | 1 | 26 | Mean Difference (IV, Fixed, 95% CI) | 5.0 [‐14.93, 24.93] |
| Analysis 5.5  Comparison 5 Exclusive breastfeeding for > 6 months versus 6 months, developed countries, observational studies, Outcome 5 Apoprotein B concentration (mg/dL) at 9 months. | ||||
| 6 Total triglyceride concentration (mmol/L) at 9 months Show forest plot | 1 | 26 | Mean Difference (IV, Fixed, 95% CI) | 0.3 [‐0.23, 0.83] |
| Analysis 5.6  Comparison 5 Exclusive breastfeeding for > 6 months versus 6 months, developed countries, observational studies, Outcome 6 Total triglyceride concentration (mmol/L) at 9 months. | ||||

Comparison 1 Exclusive breastfeeding for 6 versus 4 months, developing countries, controlled trials, Outcome 1 Monthly weight gain from 4‐6 months (g/mo).

Comparison 1 Exclusive breastfeeding for 6 versus 4 months, developing countries, controlled trials, Outcome 2 Monthly weight gain from 6‐12 months (g/mo).

Comparison 1 Exclusive breastfeeding for 6 versus 4 months, developing countries, controlled trials, Outcome 3 Monthly length gain 4‐6 months (cm/mo).

Comparison 1 Exclusive breastfeeding for 6 versus 4 months, developing countries, controlled trials, Outcome 4 Monthly length gain 6‐12 months (cm/mo).

Comparison 1 Exclusive breastfeeding for 6 versus 4 months, developing countries, controlled trials, Outcome 5 Weight‐for‐age z‐score at 6 months.

Comparison 1 Exclusive breastfeeding for 6 versus 4 months, developing countries, controlled trials, Outcome 6 Length‐for‐age z‐score at 6 months.

Comparison 1 Exclusive breastfeeding for 6 versus 4 months, developing countries, controlled trials, Outcome 7 Weight‐for‐length z‐score at 6 months.

Comparison 1 Exclusive breastfeeding for 6 versus 4 months, developing countries, controlled trials, Outcome 8 Weight‐for‐age z‐score < ‐2 at 6 months.

Comparison 1 Exclusive breastfeeding for 6 versus 4 months, developing countries, controlled trials, Outcome 9 Length‐for‐age z‐score < ‐2 at 6 months.

Comparison 1 Exclusive breastfeeding for 6 versus 4 months, developing countries, controlled trials, Outcome 10 Weight‐for‐length z‐score < ‐2 at 6 months.

Comparison 1 Exclusive breastfeeding for 6 versus 4 months, developing countries, controlled trials, Outcome 11 Receipt of Fe supplements 6‐9 months.
Comparison 1 Exclusive breastfeeding for 6 versus 4 months, developing countries, controlled trials, Outcome 12 Hemoglobin concentration (g/L) at 6 months.

Comparison 1 Exclusive breastfeeding for 6 versus 4 months, developing countries, controlled trials, Outcome 13 Hemoglobin concentration < 110 g/L at 6 months.
Comparison 1 Exclusive breastfeeding for 6 versus 4 months, developing countries, controlled trials, Outcome 14 Hemoglobin concentration < 103 g/L at 6 months.

Comparison 1 Exclusive breastfeeding for 6 versus 4 months, developing countries, controlled trials, Outcome 15 Hematocrit (%) at 6 months.
Comparison 1 Exclusive breastfeeding for 6 versus 4 months, developing countries, controlled trials, Outcome 16 Hematocrit < 33% at 6 months.

Comparison 1 Exclusive breastfeeding for 6 versus 4 months, developing countries, controlled trials, Outcome 17 Plasma ferritin concentration (mcg/L) at 6 months.

Comparison 1 Exclusive breastfeeding for 6 versus 4 months, developing countries, controlled trials, Outcome 18 Plasma ferritin concentration < 12 mcg/L at 6 months.

Comparison 1 Exclusive breastfeeding for 6 versus 4 months, developing countries, controlled trials, Outcome 19 Plasma ferritin concentration < 15 mcg/L at 6 months.

Comparison 1 Exclusive breastfeeding for 6 versus 4 months, developing countries, controlled trials, Outcome 20 Plasma zinc concentration < 70 mcg/dL at 6 months.
Comparison 1 Exclusive breastfeeding for 6 versus 4 months, developing countries, controlled trials, Outcome 21 % of days with fever 4‐6 months.

Comparison 1 Exclusive breastfeeding for 6 versus 4 months, developing countries, controlled trials, Outcome 22 % of days with cough 4‐6 months.
Comparison 1 Exclusive breastfeeding for 6 versus 4 months, developing countries, controlled trials, Outcome 23 % of days with nasal congestion 4‐6 months.

Comparison 1 Exclusive breastfeeding for 6 versus 4 months, developing countries, controlled trials, Outcome 24 % of days with nasal discharge 4‐6 months.

Comparison 1 Exclusive breastfeeding for 6 versus 4 months, developing countries, controlled trials, Outcome 25 % of days with hoarseness 4‐6 months.

Comparison 1 Exclusive breastfeeding for 6 versus 4 months, developing countries, controlled trials, Outcome 26 % of days with diarrhea 4‐6 months.

Comparison 1 Exclusive breastfeeding for 6 versus 4 months, developing countries, controlled trials, Outcome 27 % of days with fever 6‐12 months.

Comparison 1 Exclusive breastfeeding for 6 versus 4 months, developing countries, controlled trials, Outcome 28 % of days with nasal congestion 6‐12 months.
Comparison 1 Exclusive breastfeeding for 6 versus 4 months, developing countries, controlled trials, Outcome 29 % of days with diarrhea 6‐12 months.

Comparison 1 Exclusive breastfeeding for 6 versus 4 months, developing countries, controlled trials, Outcome 30 Age first crawled (mo).

Comparison 1 Exclusive breastfeeding for 6 versus 4 months, developing countries, controlled trials, Outcome 31 Age first sat from lying position (mo).

Comparison 1 Exclusive breastfeeding for 6 versus 4 months, developing countries, controlled trials, Outcome 32 Did not walk by 12 months.

Comparison 1 Exclusive breastfeeding for 6 versus 4 months, developing countries, controlled trials, Outcome 33 Maternal postpartum weight loss 4‐6 months (kg).
Comparison 1 Exclusive breastfeeding for 6 versus 4 months, developing countries, controlled trials, Outcome 34 Maternal resumption of menses 6 months postpartum.

Comparison 2 Exclusive breastfeeding for 6‐7 versus 3‐4 months, developing countries, observational studies, Outcome 1 Monthly weight gain 4‐6 months (g/mo).

Comparison 2 Exclusive breastfeeding for 6‐7 versus 3‐4 months, developing countries, observational studies, Outcome 2 Monthly weight gain 6‐9 months (g/mo).

Comparison 2 Exclusive breastfeeding for 6‐7 versus 3‐4 months, developing countries, observational studies, Outcome 3 Monthly length gain 4‐6 months (cm/mo).

Comparison 2 Exclusive breastfeeding for 6‐7 versus 3‐4 months, developing countries, observational studies, Outcome 4 Monthly length gain 6‐9 months (cm/mo).

Comparison 2 Exclusive breastfeeding for 6‐7 versus 3‐4 months, developing countries, observational studies, Outcome 5 Weight‐for‐age z‐score at 6‐7 months.

Comparison 2 Exclusive breastfeeding for 6‐7 versus 3‐4 months, developing countries, observational studies, Outcome 6 Weight‐for‐age z‐score at 9‐10 months.

Comparison 2 Exclusive breastfeeding for 6‐7 versus 3‐4 months, developing countries, observational studies, Outcome 7 Length‐for‐age z‐score at 6‐7 months.
Comparison 2 Exclusive breastfeeding for 6‐7 versus 3‐4 months, developing countries, observational studies, Outcome 8 Length‐for‐age z‐score at 9‐10 months.

Comparison 2 Exclusive breastfeeding for 6‐7 versus 3‐4 months, developing countries, observational studies, Outcome 9 Weight‐for‐length z‐score at 6‐7 months.
Comparison 2 Exclusive breastfeeding for 6‐7 versus 3‐4 months, developing countries, observational studies, Outcome 10 Weight‐for‐length z‐score at 9‐10 months.

Comparison 2 Exclusive breastfeeding for 6‐7 versus 3‐4 months, developing countries, observational studies, Outcome 11 Weight‐for‐age z‐score < ‐2 at 6‐7 months.
Comparison 2 Exclusive breastfeeding for 6‐7 versus 3‐4 months, developing countries, observational studies, Outcome 12 Weight‐for‐age z‐score < ‐2 at 9‐10 months.

Comparison 2 Exclusive breastfeeding for 6‐7 versus 3‐4 months, developing countries, observational studies, Outcome 13 Length‐for‐age z‐score < ‐2 at 6‐7 months.

Comparison 2 Exclusive breastfeeding for 6‐7 versus 3‐4 months, developing countries, observational studies, Outcome 14 Length‐for‐age z‐score < ‐2 at 9‐10 months.

Comparison 2 Exclusive breastfeeding for 6‐7 versus 3‐4 months, developing countries, observational studies, Outcome 15 Weight‐for‐length z‐score < ‐2 at 6‐7 months.

Comparison 2 Exclusive breastfeeding for 6‐7 versus 3‐4 months, developing countries, observational studies, Outcome 16 Weight‐for‐length z‐score < ‐2 at 9‐10 months.
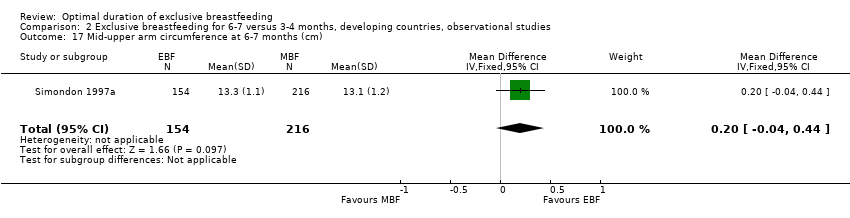
Comparison 2 Exclusive breastfeeding for 6‐7 versus 3‐4 months, developing countries, observational studies, Outcome 17 Mid‐upper arm circumference at 6‐7 months (cm).
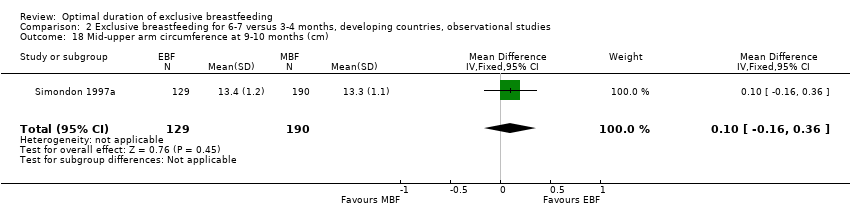
Comparison 2 Exclusive breastfeeding for 6‐7 versus 3‐4 months, developing countries, observational studies, Outcome 18 Mid‐upper arm circumference at 9‐10 months (cm).

Comparison 2 Exclusive breastfeeding for 6‐7 versus 3‐4 months, developing countries, observational studies, Outcome 19 One or more episodes of gastrointestinal infection at 4‐6 months.

Comparison 2 Exclusive breastfeeding for 6‐7 versus 3‐4 months, developing countries, observational studies, Outcome 20 One or more episodes of respiratory infection at 4‐6 months.

Comparison 2 Exclusive breastfeeding for 6‐7 versus 3‐4 months, developing countries, observational studies, Outcome 21 Resumption of menses by 6‐7 months postpartum.

Comparison 3 Exclusive breastfeeding for > 6 months versus 6 months, developing countries, observational studies, Outcome 1 Weight‐for‐age < 75% of reference mean.
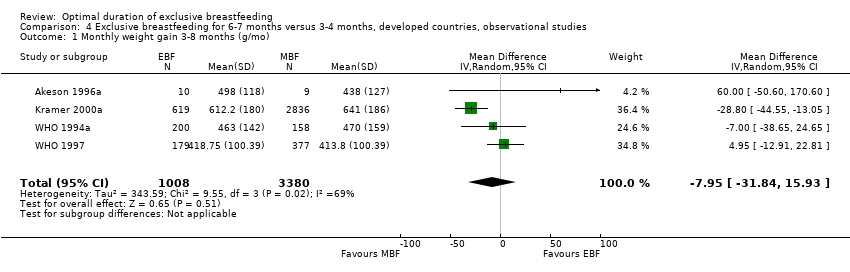
Comparison 4 Exclusive breastfeeding for 6‐7 months versus 3‐4 months, developed countries, observational studies, Outcome 1 Monthly weight gain 3‐8 months (g/mo).

Comparison 4 Exclusive breastfeeding for 6‐7 months versus 3‐4 months, developed countries, observational studies, Outcome 2 Monthly weight gain 6‐9 months (g/mo).

Comparison 4 Exclusive breastfeeding for 6‐7 months versus 3‐4 months, developed countries, observational studies, Outcome 3 Monthly weight gain 8‐12 months (g/mo).

Comparison 4 Exclusive breastfeeding for 6‐7 months versus 3‐4 months, developed countries, observational studies, Outcome 4 Monthly length gain 3‐8 months (cm/mo).
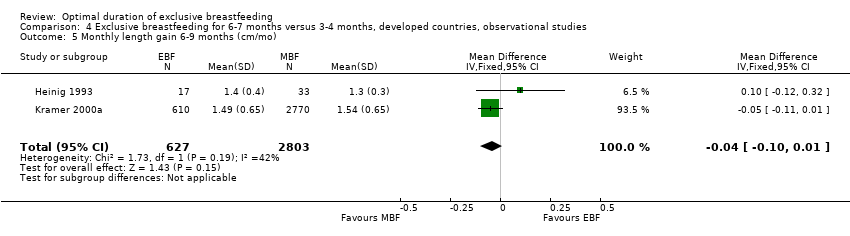
Comparison 4 Exclusive breastfeeding for 6‐7 months versus 3‐4 months, developed countries, observational studies, Outcome 5 Monthly length gain 6‐9 months (cm/mo).

Comparison 4 Exclusive breastfeeding for 6‐7 months versus 3‐4 months, developed countries, observational studies, Outcome 6 Monthly length gain 8‐12 months (cm/mo).
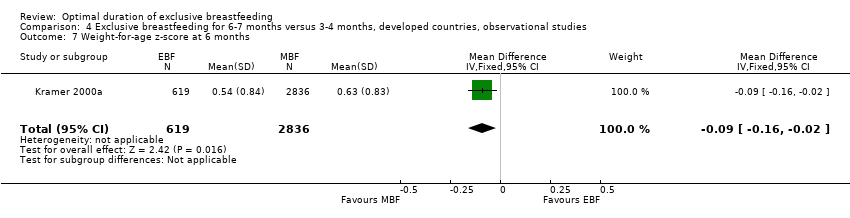
Comparison 4 Exclusive breastfeeding for 6‐7 months versus 3‐4 months, developed countries, observational studies, Outcome 7 Weight‐for‐age z‐score at 6 months.
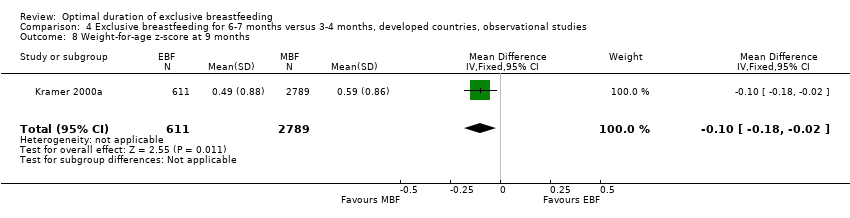
Comparison 4 Exclusive breastfeeding for 6‐7 months versus 3‐4 months, developed countries, observational studies, Outcome 8 Weight‐for‐age z‐score at 9 months.
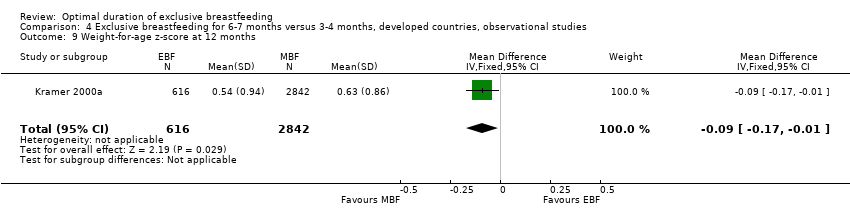
Comparison 4 Exclusive breastfeeding for 6‐7 months versus 3‐4 months, developed countries, observational studies, Outcome 9 Weight‐for‐age z‐score at 12 months.

Comparison 4 Exclusive breastfeeding for 6‐7 months versus 3‐4 months, developed countries, observational studies, Outcome 10 Length‐for‐age z‐score at 6 months.

Comparison 4 Exclusive breastfeeding for 6‐7 months versus 3‐4 months, developed countries, observational studies, Outcome 11 Length‐for‐age z‐score at 9 months.

Comparison 4 Exclusive breastfeeding for 6‐7 months versus 3‐4 months, developed countries, observational studies, Outcome 12 Length‐for‐age z‐score at 12 months.

Comparison 4 Exclusive breastfeeding for 6‐7 months versus 3‐4 months, developed countries, observational studies, Outcome 13 Weight‐for‐length z‐score at 6 months.

Comparison 4 Exclusive breastfeeding for 6‐7 months versus 3‐4 months, developed countries, observational studies, Outcome 14 Weight‐for‐length z‐score at 9 months.

Comparison 4 Exclusive breastfeeding for 6‐7 months versus 3‐4 months, developed countries, observational studies, Outcome 15 Weight‐for‐length z‐score at 12 months.

Comparison 4 Exclusive breastfeeding for 6‐7 months versus 3‐4 months, developed countries, observational studies, Outcome 16 Weight‐for‐age z‐score < ‐2 at 6 months.
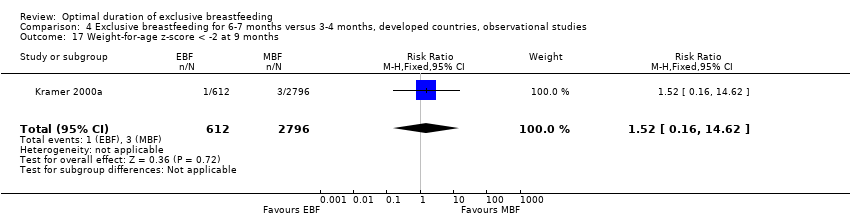
Comparison 4 Exclusive breastfeeding for 6‐7 months versus 3‐4 months, developed countries, observational studies, Outcome 17 Weight‐for‐age z‐score < ‐2 at 9 months.

Comparison 4 Exclusive breastfeeding for 6‐7 months versus 3‐4 months, developed countries, observational studies, Outcome 18 Weight‐for‐age z‐score < ‐2 at 12 months.
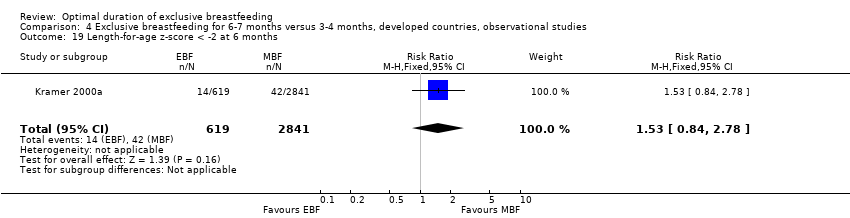
Comparison 4 Exclusive breastfeeding for 6‐7 months versus 3‐4 months, developed countries, observational studies, Outcome 19 Length‐for‐age z‐score < ‐2 at 6 months.

Comparison 4 Exclusive breastfeeding for 6‐7 months versus 3‐4 months, developed countries, observational studies, Outcome 20 Length‐for‐age z‐score < ‐2 at 9 months.
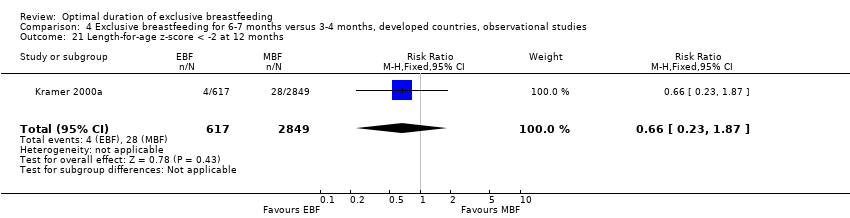
Comparison 4 Exclusive breastfeeding for 6‐7 months versus 3‐4 months, developed countries, observational studies, Outcome 21 Length‐for‐age z‐score < ‐2 at 12 months.

Comparison 4 Exclusive breastfeeding for 6‐7 months versus 3‐4 months, developed countries, observational studies, Outcome 22 Weight‐for‐length z‐score < ‐2 at 6 months.

Comparison 4 Exclusive breastfeeding for 6‐7 months versus 3‐4 months, developed countries, observational studies, Outcome 23 Weight‐for‐length z‐score < ‐2 at 9 months.

Comparison 4 Exclusive breastfeeding for 6‐7 months versus 3‐4 months, developed countries, observational studies, Outcome 24 Weight‐for‐length z‐score < ‐2 at 12 months.

Comparison 4 Exclusive breastfeeding for 6‐7 months versus 3‐4 months, developed countries, observational studies, Outcome 25 Head circumference at 6 months (cm).

Comparison 4 Exclusive breastfeeding for 6‐7 months versus 3‐4 months, developed countries, observational studies, Outcome 26 Head circumference at 9 months (cm).

Comparison 4 Exclusive breastfeeding for 6‐7 months versus 3‐4 months, developed countries, observational studies, Outcome 27 Head circumference at 12 months (cm).

Comparison 4 Exclusive breastfeeding for 6‐7 months versus 3‐4 months, developed countries, observational studies, Outcome 28 Sleeping time at 9 months (min/day).
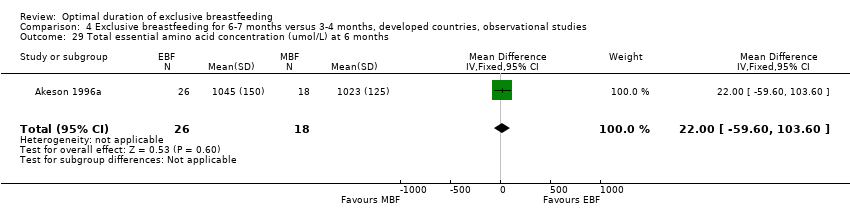
Comparison 4 Exclusive breastfeeding for 6‐7 months versus 3‐4 months, developed countries, observational studies, Outcome 29 Total essential amino acid concentration (umol/L) at 6 months.

Comparison 4 Exclusive breastfeeding for 6‐7 months versus 3‐4 months, developed countries, observational studies, Outcome 30 Total amino acid concentration (umol/L) at 6 months.

Comparison 4 Exclusive breastfeeding for 6‐7 months versus 3‐4 months, developed countries, observational studies, Outcome 31 Atopic eczema in first 12 months.

Comparison 4 Exclusive breastfeeding for 6‐7 months versus 3‐4 months, developed countries, observational studies, Outcome 32 Food allergy at 1 year (by history).
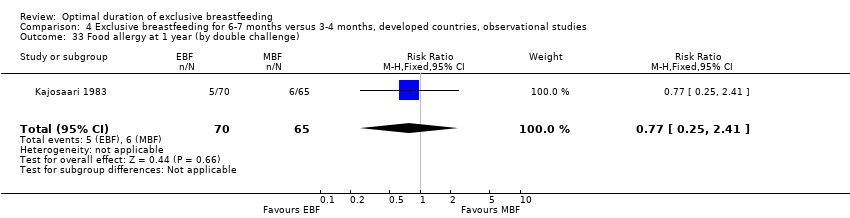
Comparison 4 Exclusive breastfeeding for 6‐7 months versus 3‐4 months, developed countries, observational studies, Outcome 33 Food allergy at 1 year (by double challenge).

Comparison 4 Exclusive breastfeeding for 6‐7 months versus 3‐4 months, developed countries, observational studies, Outcome 34 Two or more episodes of wheezing in first 12 months.

Comparison 4 Exclusive breastfeeding for 6‐7 months versus 3‐4 months, developed countries, observational studies, Outcome 35 Hemoglobin concentration (g/L) at 12 months.

Comparison 4 Exclusive breastfeeding for 6‐7 months versus 3‐4 months, developed countries, observational studies, Outcome 36 Hemoglobin concentration < 110 g/L at 12 months.

Comparison 4 Exclusive breastfeeding for 6‐7 months versus 3‐4 months, developed countries, observational studies, Outcome 37 Serum ferritin concentration (mcg/L) at 12 months.

Comparison 4 Exclusive breastfeeding for 6‐7 months versus 3‐4 months, developed countries, observational studies, Outcome 38 Serum ferritin concentration < 10 mcg/L at 12 months.

Comparison 4 Exclusive breastfeeding for 6‐7 months versus 3‐4 months, developed countries, observational studies, Outcome 39 One or more episodes of gastrointestinal infection in first 12 months.
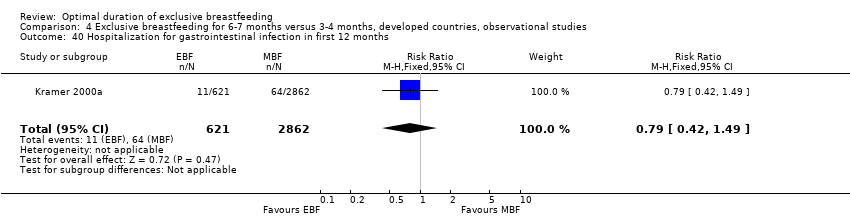
Comparison 4 Exclusive breastfeeding for 6‐7 months versus 3‐4 months, developed countries, observational studies, Outcome 40 Hospitalization for gastrointestinal infection in first 12 months.
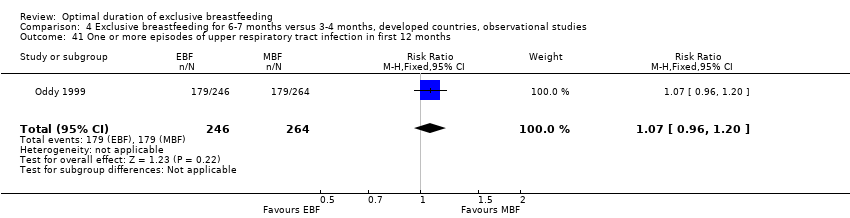
Comparison 4 Exclusive breastfeeding for 6‐7 months versus 3‐4 months, developed countries, observational studies, Outcome 41 One or more episodes of upper respiratory tract infection in first 12 months.

Comparison 4 Exclusive breastfeeding for 6‐7 months versus 3‐4 months, developed countries, observational studies, Outcome 42 Two or more episodes of upper respiratory tract infection in first 12 months.

Comparison 4 Exclusive breastfeeding for 6‐7 months versus 3‐4 months, developed countries, observational studies, Outcome 43 Four or more episodes of upper respiratory tract infection in first 12 months.
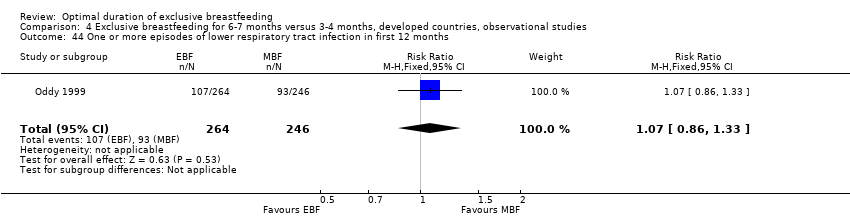
Comparison 4 Exclusive breastfeeding for 6‐7 months versus 3‐4 months, developed countries, observational studies, Outcome 44 One or more episodes of lower respiratory tract infection in first 12 months.

Comparison 4 Exclusive breastfeeding for 6‐7 months versus 3‐4 months, developed countries, observational studies, Outcome 45 Two or more episodes of respiratory tract infection (upper or lower) in first 12 months.
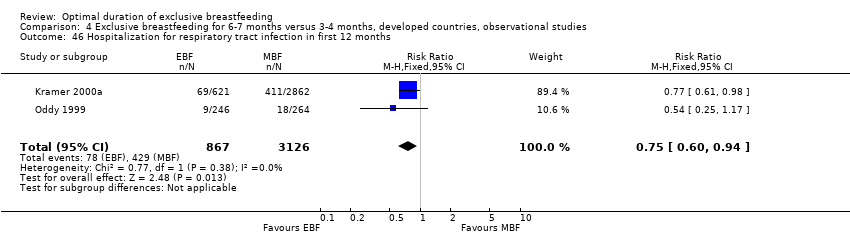
Comparison 4 Exclusive breastfeeding for 6‐7 months versus 3‐4 months, developed countries, observational studies, Outcome 46 Hospitalization for respiratory tract infection in first 12 months.

Comparison 4 Exclusive breastfeeding for 6‐7 months versus 3‐4 months, developed countries, observational studies, Outcome 47 Number of episodes of otitis media in first 12 months.

Comparison 4 Exclusive breastfeeding for 6‐7 months versus 3‐4 months, developed countries, observational studies, Outcome 48 One or more episodes of otitis media in first 12 months.
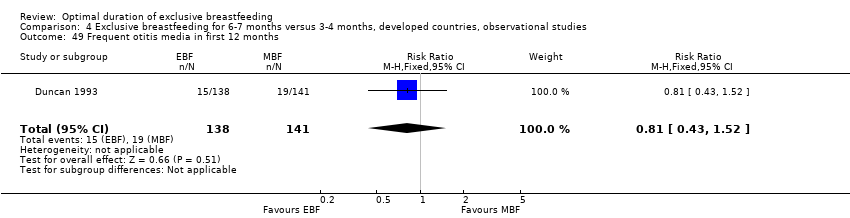
Comparison 4 Exclusive breastfeeding for 6‐7 months versus 3‐4 months, developed countries, observational studies, Outcome 49 Frequent otitis media in first 12 months.

Comparison 4 Exclusive breastfeeding for 6‐7 months versus 3‐4 months, developed countries, observational studies, Outcome 50 Death in first 12 months.

Comparison 4 Exclusive breastfeeding for 6‐7 months versus 3‐4 months, developed countries, observational studies, Outcome 51 Any dental caries (decayed, missing, or filled teeth) at 6 years.

Comparison 4 Exclusive breastfeeding for 6‐7 months versus 3‐4 months, developed countries, observational studies, Outcome 52 Any incisor caries (decayed, missing, or filled teeth) at 6 years.
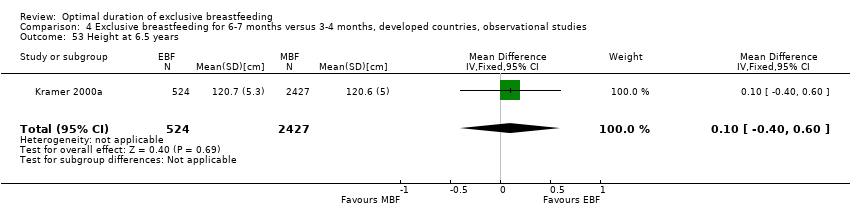
Comparison 4 Exclusive breastfeeding for 6‐7 months versus 3‐4 months, developed countries, observational studies, Outcome 53 Height at 6.5 years.
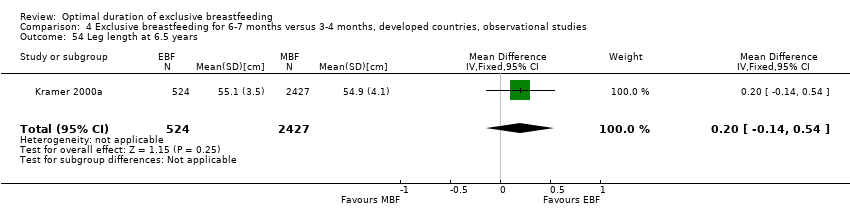
Comparison 4 Exclusive breastfeeding for 6‐7 months versus 3‐4 months, developed countries, observational studies, Outcome 54 Leg length at 6.5 years.

Comparison 4 Exclusive breastfeeding for 6‐7 months versus 3‐4 months, developed countries, observational studies, Outcome 55 Head circumference at 6.5 years.
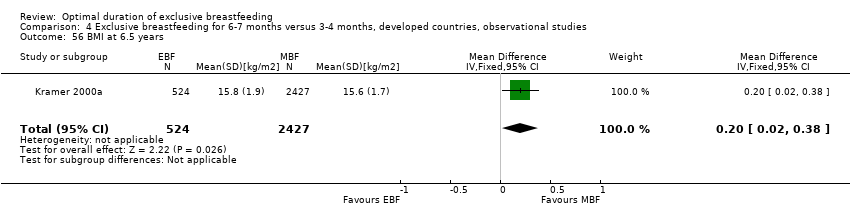
Comparison 4 Exclusive breastfeeding for 6‐7 months versus 3‐4 months, developed countries, observational studies, Outcome 56 BMI at 6.5 years.

Comparison 4 Exclusive breastfeeding for 6‐7 months versus 3‐4 months, developed countries, observational studies, Outcome 57 Triceps skinfold thickness at 6.5 years.

Comparison 4 Exclusive breastfeeding for 6‐7 months versus 3‐4 months, developed countries, observational studies, Outcome 58 Subscapular skinfold thickness.

Comparison 4 Exclusive breastfeeding for 6‐7 months versus 3‐4 months, developed countries, observational studies, Outcome 59 Waist circumference at 6.5 years.

Comparison 4 Exclusive breastfeeding for 6‐7 months versus 3‐4 months, developed countries, observational studies, Outcome 60 Hip circumference at 6.5 years.
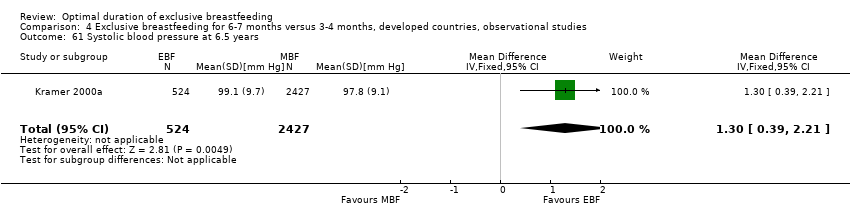
Comparison 4 Exclusive breastfeeding for 6‐7 months versus 3‐4 months, developed countries, observational studies, Outcome 61 Systolic blood pressure at 6.5 years.

Comparison 4 Exclusive breastfeeding for 6‐7 months versus 3‐4 months, developed countries, observational studies, Outcome 62 Diastolic blood pressure at 6.5 years (mm Hg).

Comparison 4 Exclusive breastfeeding for 6‐7 months versus 3‐4 months, developed countries, observational studies, Outcome 63 Atopic eczema at 5‐7 years.

Comparison 4 Exclusive breastfeeding for 6‐7 months versus 3‐4 months, developed countries, observational studies, Outcome 64 Hay fever at 5‐7 years.

Comparison 4 Exclusive breastfeeding for 6‐7 months versus 3‐4 months, developed countries, observational studies, Outcome 65 Asthma at 5‐7 years.

Comparison 4 Exclusive breastfeeding for 6‐7 months versus 3‐4 months, developed countries, observational studies, Outcome 66 Food allergy at 5 years.

Comparison 4 Exclusive breastfeeding for 6‐7 months versus 3‐4 months, developed countries, observational studies, Outcome 67 Allergy to animal dander at 5 years.
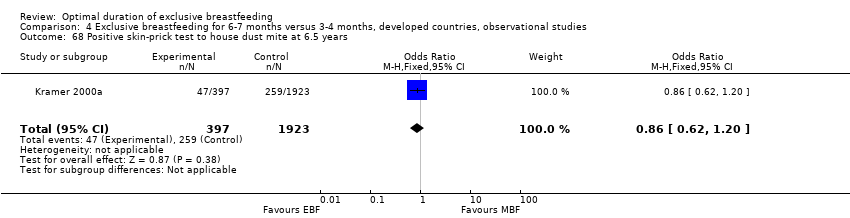
Comparison 4 Exclusive breastfeeding for 6‐7 months versus 3‐4 months, developed countries, observational studies, Outcome 68 Positive skin‐prick test to house dust mite at 6.5 years.

Comparison 4 Exclusive breastfeeding for 6‐7 months versus 3‐4 months, developed countries, observational studies, Outcome 69 Positive skin‐prick test to cat dander at 6.5 years.

Comparison 4 Exclusive breastfeeding for 6‐7 months versus 3‐4 months, developed countries, observational studies, Outcome 70 Positive skin‐prick test to birch pollen at 6.5 years.

Comparison 4 Exclusive breastfeeding for 6‐7 months versus 3‐4 months, developed countries, observational studies, Outcome 71 Positive skin‐prick test to mixed northern grasses at 6.5 years.

Comparison 4 Exclusive breastfeeding for 6‐7 months versus 3‐4 months, developed countries, observational studies, Outcome 72 Positive skin‐prick test to Alternaria at 6.5 years.

Comparison 4 Exclusive breastfeeding for 6‐7 months versus 3‐4 months, developed countries, observational studies, Outcome 73 Any positive skin‐prick test at 6‐7 years.

Comparison 4 Exclusive breastfeeding for 6‐7 months versus 3‐4 months, developed countries, observational studies, Outcome 74 Wechsler cognitive ability test at 6.5 years: vocabulary.

Comparison 4 Exclusive breastfeeding for 6‐7 months versus 3‐4 months, developed countries, observational studies, Outcome 75 Wechsler cognitive ability test at 6.5 years: similarities.
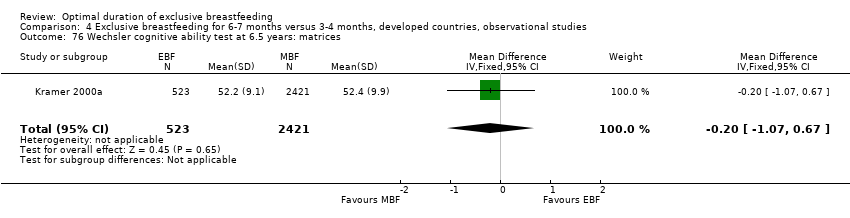
Comparison 4 Exclusive breastfeeding for 6‐7 months versus 3‐4 months, developed countries, observational studies, Outcome 76 Wechsler cognitive ability test at 6.5 years: matrices.

Comparison 4 Exclusive breastfeeding for 6‐7 months versus 3‐4 months, developed countries, observational studies, Outcome 77 Wechsler cognitive ability test at 6.5 years: block designs.
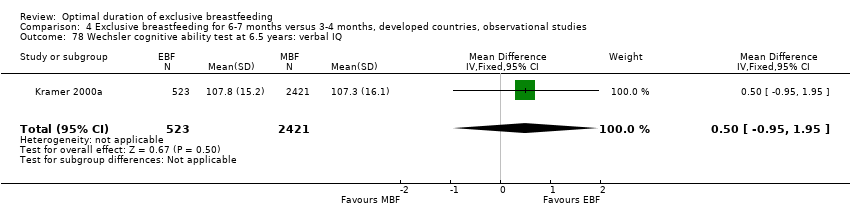
Comparison 4 Exclusive breastfeeding for 6‐7 months versus 3‐4 months, developed countries, observational studies, Outcome 78 Wechsler cognitive ability test at 6.5 years: verbal IQ.

Comparison 4 Exclusive breastfeeding for 6‐7 months versus 3‐4 months, developed countries, observational studies, Outcome 79 Wechsler cognitive ability test at 6.5 years: performance IQ.

Comparison 4 Exclusive breastfeeding for 6‐7 months versus 3‐4 months, developed countries, observational studies, Outcome 80 Wechsler cognitive ability test at 6.5 years: full‐scale IQ.

Comparison 4 Exclusive breastfeeding for 6‐7 months versus 3‐4 months, developed countries, observational studies, Outcome 81 Teacher's academic rating at 6.5 years: reading.

Comparison 4 Exclusive breastfeeding for 6‐7 months versus 3‐4 months, developed countries, observational studies, Outcome 82 Teacher's academic rating at 6.5 years: writing.

Comparison 4 Exclusive breastfeeding for 6‐7 months versus 3‐4 months, developed countries, observational studies, Outcome 83 Teacher's academic rating at 6.5 years: mathematics.

Comparison 4 Exclusive breastfeeding for 6‐7 months versus 3‐4 months, developed countries, observational studies, Outcome 84 Teacher's academic rating at 6.5 years: other subjects.

Comparison 4 Exclusive breastfeeding for 6‐7 months versus 3‐4 months, developed countries, observational studies, Outcome 85 Parent's behavior rating at 6.5 years: total difficulties.
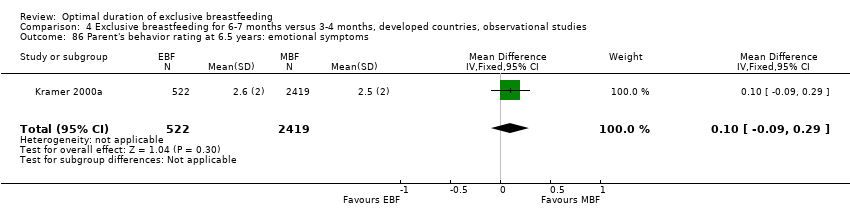
Comparison 4 Exclusive breastfeeding for 6‐7 months versus 3‐4 months, developed countries, observational studies, Outcome 86 Parent's behavior rating at 6.5 years: emotional symptoms.

Comparison 4 Exclusive breastfeeding for 6‐7 months versus 3‐4 months, developed countries, observational studies, Outcome 87 Parent's behavior rating at 6.5 years: conduct problems.

Comparison 4 Exclusive breastfeeding for 6‐7 months versus 3‐4 months, developed countries, observational studies, Outcome 88 Parent's behavior rating at 6.5 years: hyperactivity/inattention.

Comparison 4 Exclusive breastfeeding for 6‐7 months versus 3‐4 months, developed countries, observational studies, Outcome 89 Parent's behavior rating at 6.5 years: peer problems.

Comparison 4 Exclusive breastfeeding for 6‐7 months versus 3‐4 months, developed countries, observational studies, Outcome 90 Parent's behavior rating at 6.5 years: prosocial behavior.

Comparison 4 Exclusive breastfeeding for 6‐7 months versus 3‐4 months, developed countries, observational studies, Outcome 91 Teacher's behavior rating at 6.5 years: total difficulties.

Comparison 4 Exclusive breastfeeding for 6‐7 months versus 3‐4 months, developed countries, observational studies, Outcome 92 Teacher's behavior rating at 6.5 years: emotional symptoms.

Comparison 4 Exclusive breastfeeding for 6‐7 months versus 3‐4 months, developed countries, observational studies, Outcome 93 Teacher's behavior rating at 6.5 years: conduct problems.

Comparison 4 Exclusive breastfeeding for 6‐7 months versus 3‐4 months, developed countries, observational studies, Outcome 94 Teacher's behavior rating at 6.5 years: hyperactivity/inattention.

Comparison 4 Exclusive breastfeeding for 6‐7 months versus 3‐4 months, developed countries, observational studies, Outcome 95 Teacher's behavior rating at 6.5 years: peer problems.
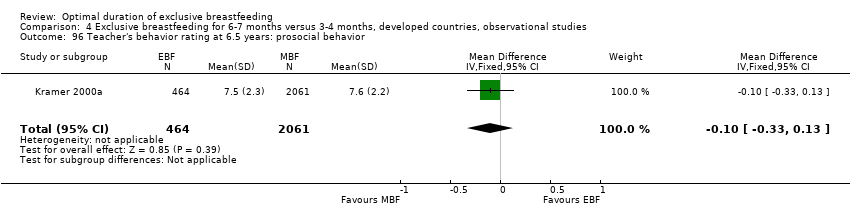
Comparison 4 Exclusive breastfeeding for 6‐7 months versus 3‐4 months, developed countries, observational studies, Outcome 96 Teacher's behavior rating at 6.5 years: prosocial behavior.

Comparison 5 Exclusive breastfeeding for > 6 months versus 6 months, developed countries, observational studies, Outcome 1 Very low density lipoprotein concentration (mmol/L) at 9 months.

Comparison 5 Exclusive breastfeeding for > 6 months versus 6 months, developed countries, observational studies, Outcome 2 Low density lipoproteinconcentration (mmol/L) at 9 months.

Comparison 5 Exclusive breastfeeding for > 6 months versus 6 months, developed countries, observational studies, Outcome 3 High‐density lipoprotein‐2 concentration (mmol/L) at 9 months.

Comparison 5 Exclusive breastfeeding for > 6 months versus 6 months, developed countries, observational studies, Outcome 4 High‐density lipoprotein‐3 concentration (mmol/L) at 9 months.

Comparison 5 Exclusive breastfeeding for > 6 months versus 6 months, developed countries, observational studies, Outcome 5 Apoprotein B concentration (mg/dL) at 9 months.
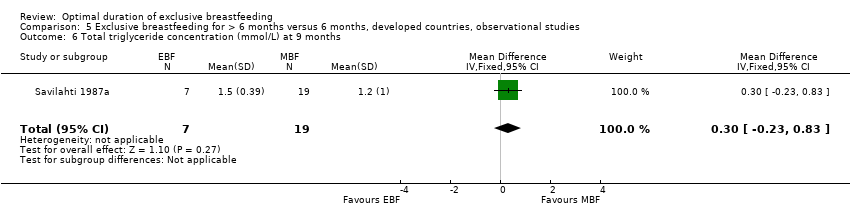
Comparison 5 Exclusive breastfeeding for > 6 months versus 6 months, developed countries, observational studies, Outcome 6 Total triglyceride concentration (mmol/L) at 9 months.
| Outcome or subgroup title | No. of studies | No. of participants | Statistical method | Effect size |
| 1 Monthly weight gain from 4‐6 months (g/mo) Show forest plot | 2 | 265 | Mean Difference (IV, Fixed, 95% CI) | 20.78 [‐21.99, 63.54] |
| 2 Monthly weight gain from 6‐12 months (g/mo) Show forest plot | 2 | 233 | Mean Difference (IV, Fixed, 95% CI) | ‐2.62 [‐25.85, 20.62] |
| 3 Monthly length gain 4‐6 months (cm/mo) Show forest plot | 2 | 265 | Mean Difference (IV, Fixed, 95% CI) | 0.10 [‐0.04, 0.24] |
| 4 Monthly length gain 6‐12 months (cm/mo) Show forest plot | 2 | 233 | Mean Difference (IV, Fixed, 95% CI) | ‐0.04 [‐0.10, 0.02] |
| 5 Weight‐for‐age z‐score at 6 months Show forest plot | 2 | 260 | Mean Difference (IV, Fixed, 95% CI) | 0.18 [‐0.06, 0.41] |
| 6 Length‐for‐age z‐score at 6 months Show forest plot | 2 | 260 | Mean Difference (IV, Fixed, 95% CI) | 0.11 [‐0.11, 0.33] |
| 7 Weight‐for‐length z‐score at 6 months Show forest plot | 2 | 260 | Mean Difference (IV, Fixed, 95% CI) | 0.09 [‐0.13, 0.31] |
| 8 Weight‐for‐age z‐score < ‐2 at 6 months Show forest plot | 2 | 260 | Risk Ratio (M‐H, Fixed, 95% CI) | 2.14 [0.74, 6.24] |
| 9 Length‐for‐age z‐score < ‐2 at 6 months Show forest plot | 2 | 260 | Risk Ratio (M‐H, Fixed, 95% CI) | 1.18 [0.56, 2.50] |
| 10 Weight‐for‐length z‐score < ‐2 at 6 months Show forest plot | 2 | 260 | Risk Ratio (M‐H, Fixed, 95% CI) | 1.38 [0.17, 10.98] |
| 11 Receipt of Fe supplements 6‐9 months Show forest plot | 1 | 139 | Risk Ratio (M‐H, Fixed, 95% CI) | 1.20 [0.91, 1.58] |
| 12 Hemoglobin concentration (g/L) at 6 months Show forest plot | 1 | 139 | Mean Difference (IV, Fixed, 95% CI) | ‐5.0 [‐8.46, ‐1.54] |
| 13 Hemoglobin concentration < 110 g/L at 6 months Show forest plot | 1 | 139 | Risk Ratio (M‐H, Fixed, 95% CI) | 1.20 [0.91, 1.58] |
| 14 Hemoglobin concentration < 103 g/L at 6 months Show forest plot | 1 | 139 | Risk Ratio (M‐H, Fixed, 95% CI) | 1.29 [0.75, 2.23] |
| 15 Hematocrit (%) at 6 months Show forest plot | 1 | 139 | Mean Difference (IV, Fixed, 95% CI) | ‐1.20 [‐2.15, ‐0.25] |
| 16 Hematocrit < 33% at 6 months Show forest plot | 1 | 139 | Risk Ratio (M‐H, Fixed, 95% CI) | 1.50 [0.85, 2.64] |
| 17 Plasma ferritin concentration (mcg/L) at 6 months Show forest plot | 1 | 135 | Mean Difference (IV, Fixed, 95% CI) | ‐18.9 [‐37.31, ‐0.49] |
| 18 Plasma ferritin concentration < 12 mcg/L at 6 months Show forest plot | 1 | 135 | Risk Ratio (M‐H, Fixed, 95% CI) | 2.34 [0.86, 6.35] |
| 19 Plasma ferritin concentration < 15 mcg/L at 6 months Show forest plot | 1 | 135 | Risk Ratio (M‐H, Fixed, 95% CI) | 2.93 [1.13, 7.56] |
| 20 Plasma zinc concentration < 70 mcg/dL at 6 months Show forest plot | 1 | 101 | Risk Ratio (M‐H, Fixed, 95% CI) | 0.75 [0.43, 1.33] |
| 21 % of days with fever 4‐6 months Show forest plot | 2 | 260 | Mean Difference (IV, Fixed, 95% CI) | 0.26 [‐1.29, 1.81] |
| 22 % of days with cough 4‐6 months Show forest plot | 2 | 260 | Mean Difference (IV, Random, 95% CI) | 2.33 [‐6.00, 12.65] |
| 23 % of days with nasal congestion 4‐6 months Show forest plot | 2 | 260 | Mean Difference (IV, Fixed, 95% CI) | 0.11 [‐4.41, 4.63] |
| 24 % of days with nasal discharge 4‐6 months Show forest plot | 2 | 260 | Mean Difference (IV, Random, 95% CI) | ‐0.72 [‐6.81, 5.38] |
| 25 % of days with hoarseness 4‐6 months Show forest plot | 2 | 260 | Mean Difference (IV, Fixed, 95% CI) | ‐0.19 [‐1.17, 0.79] |
| 26 % of days with diarrhea 4‐6 months Show forest plot | 2 | 260 | Mean Difference (IV, Fixed, 95% CI) | 1.15 [‐0.35, 2.65] |
| 27 % of days with fever 6‐12 months Show forest plot | 2 | 258 | Mean Difference (IV, Fixed, 95% CI) | ‐0.39 [‐2.80, 2.02] |
| 28 % of days with nasal congestion 6‐12 months Show forest plot | 2 | 258 | Mean Difference (IV, Fixed, 95% CI) | 3.11 [‐0.12, 6.35] |
| 29 % of days with diarrhea 6‐12 months Show forest plot | 2 | 258 | Mean Difference (IV, Fixed, 95% CI) | ‐0.74 [‐2.34, 0.86] |
| 30 Age first crawled (mo) Show forest plot | 2 | 240 | Mean Difference (IV, Fixed, 95% CI) | ‐0.80 [‐1.26, ‐0.34] |
| 31 Age first sat from lying position (mo) Show forest plot | 2 | 238 | Mean Difference (IV, Random, 95% CI) | ‐0.22 [‐0.91, 0.46] |
| 32 Did not walk by 12 months Show forest plot | 2 | 233 | Risk Ratio (M‐H, Random, 95% CI) | 0.88 [0.50, 1.55] |
| 33 Maternal postpartum weight loss 4‐6 months (kg) Show forest plot | 2 | 260 | Mean Difference (IV, Fixed, 95% CI) | 0.42 [0.02, 0.82] |
| 34 Maternal resumption of menses 6 months postpartum Show forest plot | 2 | 189 | Risk Ratio (M‐H, Fixed, 95% CI) | 0.58 [0.33, 1.03] |
| Outcome or subgroup title | No. of studies | No. of participants | Statistical method | Effect size |
| 1 Monthly weight gain 4‐6 months (g/mo) Show forest plot | 4 | 1803 | Mean Difference (IV, Fixed, 95% CI) | ‐10.10 [‐27.68, 7.48] |
| 2 Monthly weight gain 6‐9 months (g/mo) Show forest plot | 1 | 319 | Mean Difference (IV, Fixed, 95% CI) | ‐6.0 [‐54.15, 42.15] |
| 3 Monthly length gain 4‐6 months (cm/mo) Show forest plot | 4 | 1803 | Mean Difference (IV, Fixed, 95% CI) | 0.04 [‐0.02, 0.11] |
| 4 Monthly length gain 6‐9 months (cm/mo) Show forest plot | 1 | 319 | Mean Difference (IV, Fixed, 95% CI) | 0.04 [‐0.06, 0.14] |
| 5 Weight‐for‐age z‐score at 6‐7 months Show forest plot | 1 | 370 | Mean Difference (IV, Fixed, 95% CI) | 0.13 [‐0.09, 0.35] |
| 6 Weight‐for‐age z‐score at 9‐10 months Show forest plot | 1 | 319 | Mean Difference (IV, Fixed, 95% CI) | 0.09 [‐0.15, 0.33] |
| 7 Length‐for‐age z‐score at 6‐7 months Show forest plot | 1 | 370 | Mean Difference (IV, Fixed, 95% CI) | 0.04 [‐0.14, 0.22] |
| 8 Length‐for‐age z‐score at 9‐10 months Show forest plot | 1 | 319 | Mean Difference (IV, Fixed, 95% CI) | 0.11 [‐0.09, 0.31] |
| 9 Weight‐for‐length z‐score at 6‐7 months Show forest plot | 1 | 370 | Mean Difference (IV, Fixed, 95% CI) | 0.11 [‐0.09, 0.31] |
| 10 Weight‐for‐length z‐score at 9‐10 months Show forest plot | 1 | 319 | Mean Difference (IV, Fixed, 95% CI) | 0.01 [‐0.21, 0.23] |
| 11 Weight‐for‐age z‐score < ‐2 at 6‐7 months Show forest plot | 1 | 370 | Risk Ratio (M‐H, Fixed, 95% CI) | 0.92 [0.54, 1.58] |
| 12 Weight‐for‐age z‐score < ‐2 at 9‐10 months Show forest plot | 1 | 319 | Risk Ratio (M‐H, Fixed, 95% CI) | 0.93 [0.64, 1.36] |
| 13 Length‐for‐age z‐score < ‐2 at 6‐7 months Show forest plot | 1 | 370 | Risk Ratio (M‐H, Fixed, 95% CI) | 1.20 [0.57, 2.53] |
| 14 Length‐for‐age z‐score < ‐2 at 9‐10 months Show forest plot | 1 | 319 | Risk Ratio (M‐H, Fixed, 95% CI) | 1.21 [0.62, 2.37] |
| 15 Weight‐for‐length z‐score < ‐2 at 6‐7 months Show forest plot | 1 | 370 | Risk Ratio (M‐H, Fixed, 95% CI) | 0.42 [0.12, 1.50] |
| 16 Weight‐for‐length z‐score < ‐2 at 9‐10 months Show forest plot | 1 | 319 | Risk Ratio (M‐H, Fixed, 95% CI) | 0.82 [0.39, 1.71] |
| 17 Mid‐upper arm circumference at 6‐7 months (cm) Show forest plot | 1 | 370 | Mean Difference (IV, Fixed, 95% CI) | 0.20 [‐0.04, 0.44] |
| 18 Mid‐upper arm circumference at 9‐10 months (cm) Show forest plot | 1 | 319 | Mean Difference (IV, Fixed, 95% CI) | 0.10 [‐0.16, 0.36] |
| 19 One or more episodes of gastrointestinal infection at 4‐6 months Show forest plot | 1 | 193 | Risk Ratio (M‐H, Fixed, 95% CI) | 0.41 [0.21, 0.78] |
| 20 One or more episodes of respiratory infection at 4‐6 months Show forest plot | 1 | 193 | Risk Ratio (M‐H, Fixed, 95% CI) | 0.68 [0.43, 1.06] |
| 21 Resumption of menses by 6‐7 months postpartum Show forest plot | 1 | 686 | Risk Ratio (M‐H, Fixed, 95% CI) | 0.19 [0.05, 0.79] |
| Outcome or subgroup title | No. of studies | No. of participants | Statistical method | Effect size |
| 1 Weight‐for‐age < 75% of reference mean Show forest plot | 1 | 31 | Risk Ratio (M‐H, Fixed, 95% CI) | 0.61 [0.26, 1.43] |
| Outcome or subgroup title | No. of studies | No. of participants | Statistical method | Effect size |
| 1 Monthly weight gain 3‐8 months (g/mo) Show forest plot | 4 | 4388 | Mean Difference (IV, Random, 95% CI) | ‐7.95 [‐31.84, 15.93] |
| 2 Monthly weight gain 6‐9 months (g/mo) Show forest plot | 2 | 3432 | Mean Difference (IV, Random, 95% CI) | 21.11 [‐44.70, 86.91] |
| 3 Monthly weight gain 8‐12 months (g/mo) Show forest plot | 3 | 3450 | Mean Difference (IV, Fixed, 95% CI) | ‐1.82 [‐16.72, 13.08] |
| 4 Monthly length gain 3‐8 months (cm/mo) Show forest plot | 4 | 4385 | Mean Difference (IV, Random, 95% CI) | ‐0.03 [‐0.11, 0.06] |
| 5 Monthly length gain 6‐9 months (cm/mo) Show forest plot | 2 | 3430 | Mean Difference (IV, Fixed, 95% CI) | ‐0.04 [‐0.10, 0.01] |
| 6 Monthly length gain 8‐12 months (cm/mo) Show forest plot | 3 | 3448 | Mean Difference (IV, Fixed, 95% CI) | 0.09 [0.03, 0.14] |
| 7 Weight‐for‐age z‐score at 6 months Show forest plot | 1 | 3455 | Mean Difference (IV, Fixed, 95% CI) | ‐0.09 [‐0.16, ‐0.02] |
| 8 Weight‐for‐age z‐score at 9 months Show forest plot | 1 | 3400 | Mean Difference (IV, Fixed, 95% CI) | ‐0.10 [‐0.18, ‐0.02] |
| 9 Weight‐for‐age z‐score at 12 months Show forest plot | 1 | 3458 | Mean Difference (IV, Fixed, 95% CI) | ‐0.09 [‐0.17, ‐0.01] |
| 10 Length‐for‐age z‐score at 6 months Show forest plot | 1 | 3454 | Mean Difference (IV, Fixed, 95% CI) | ‐0.12 [‐0.20, ‐0.04] |
| 11 Length‐for‐age z‐score at 9 months Show forest plot | 1 | 3398 | Mean Difference (IV, Fixed, 95% CI) | ‐0.14 [‐0.22, ‐0.06] |
| 12 Length‐for‐age z‐score at 12 months Show forest plot | 1 | 3458 | Mean Difference (IV, Fixed, 95% CI) | ‐0.02 [‐0.10, 0.06] |
| 13 Weight‐for‐length z‐score at 6 months Show forest plot | 1 | 3454 | Mean Difference (IV, Fixed, 95% CI) | 0.02 [‐0.07, 0.11] |
| 14 Weight‐for‐length z‐score at 9 months Show forest plot | 1 | 3398 | Mean Difference (IV, Fixed, 95% CI) | 0.03 [‐0.06, 0.12] |
| 15 Weight‐for‐length z‐score at 12 months Show forest plot | 1 | 3458 | Mean Difference (IV, Fixed, 95% CI) | ‐0.08 [‐0.17, 0.01] |
| 16 Weight‐for‐age z‐score < ‐2 at 6 months Show forest plot | 1 | 3461 | Risk Ratio (M‐H, Fixed, 95% CI) | 0.92 [0.04, 19.04] |
| 17 Weight‐for‐age z‐score < ‐2 at 9 months Show forest plot | 1 | 3408 | Risk Ratio (M‐H, Fixed, 95% CI) | 1.52 [0.16, 14.62] |
| 18 Weight‐for‐age z‐score < ‐2 at 12 months Show forest plot | 1 | 3466 | Risk Ratio (M‐H, Fixed, 95% CI) | 1.15 [0.13, 10.31] |
| 19 Length‐for‐age z‐score < ‐2 at 6 months Show forest plot | 1 | 3460 | Risk Ratio (M‐H, Fixed, 95% CI) | 1.53 [0.84, 2.78] |
| 20 Length‐for‐age z‐score < ‐2 at 9 months Show forest plot | 1 | 3406 | Risk Ratio (M‐H, Fixed, 95% CI) | 1.46 [0.80, 2.64] |
| 21 Length‐for‐age z‐score < ‐2 at 12 months Show forest plot | 1 | 3466 | Risk Ratio (M‐H, Fixed, 95% CI) | 0.66 [0.23, 1.87] |
| 22 Weight‐for‐length z‐score < ‐2 at 6 months Show forest plot | 1 | 3460 | Risk Ratio (M‐H, Fixed, 95% CI) | 0.31 [0.02, 5.34] |
| 23 Weight‐for‐length z‐score < ‐2 at 9 months Show forest plot | 1 | 3406 | Risk Ratio (M‐H, Fixed, 95% CI) | 1.14 [0.24, 5.37] |
| 24 Weight‐for‐length z‐score < ‐2 at 12 months Show forest plot | 1 | 3466 | Risk Ratio (M‐H, Fixed, 95% CI) | 1.15 [0.13, 10.31] |
| 25 Head circumference at 6 months (cm) Show forest plot | 1 | 3440 | Mean Difference (IV, Fixed, 95% CI) | ‐0.10 [‐0.23, 0.03] |
| 26 Head circumference at 9 months (cm) Show forest plot | 1 | 3389 | Mean Difference (IV, Fixed, 95% CI) | 0.07 [‐0.06, 0.20] |
| 27 Head circumference at 12 months (cm) Show forest plot | 1 | 3450 | Mean Difference (IV, Fixed, 95% CI) | 0.19 [0.06, 0.32] |
| 28 Sleeping time at 9 months (min/day) Show forest plot | 1 | 50 | Mean Difference (IV, Fixed, 95% CI) | 1.0 [‐36.65, 38.65] |
| 29 Total essential amino acid concentration (umol/L) at 6 months Show forest plot | 1 | 44 | Mean Difference (IV, Fixed, 95% CI) | 22.0 [‐59.60, 103.60] |
| 30 Total amino acid concentration (umol/L) at 6 months Show forest plot | 1 | 44 | Mean Difference (IV, Fixed, 95% CI) | 73.0 [‐118.22, 264.22] |
| 31 Atopic eczema in first 12 months Show forest plot | 2 | 3618 | Risk Ratio (M‐H, Random, 95% CI) | 0.65 [0.27, 1.59] |
| 32 Food allergy at 1 year (by history) Show forest plot | 1 | 135 | Risk Ratio (M‐H, Fixed, 95% CI) | 0.19 [0.08, 0.48] |
| 33 Food allergy at 1 year (by double challenge) Show forest plot | 1 | 135 | Risk Ratio (M‐H, Fixed, 95% CI) | 0.77 [0.25, 2.41] |
| 34 Two or more episodes of wheezing in first 12 months Show forest plot | 2 | 3993 | Risk Ratio (M‐H, Fixed, 95% CI) | 0.79 [0.49, 1.28] |
| 35 Hemoglobin concentration (g/L) at 12 months Show forest plot | 1 | 30 | Mean Difference (IV, Fixed, 95% CI) | 8.0 [4.03, 11.97] |
| 36 Hemoglobin concentration < 110 g/L at 12 months Show forest plot | 1 | 30 | Risk Ratio (M‐H, Fixed, 95% CI) | 0.12 [0.01, 1.80] |
| 37 Serum ferritin concentration (mcg/L) at 12 months Show forest plot | 1 | 30 | Mean Difference (IV, Fixed, 95% CI) | 4.70 [‐6.30, 15.70] |
| 38 Serum ferritin concentration < 10 mcg/L at 12 months Show forest plot | 1 | 30 | Risk Ratio (M‐H, Fixed, 95% CI) | 0.42 [0.12, 1.54] |
| 39 One or more episodes of gastrointestinal infection in first 12 months Show forest plot | 1 | 3483 | Risk Ratio (M‐H, Fixed, 95% CI) | 0.67 [0.46, 0.97] |
| 40 Hospitalization for gastrointestinal infection in first 12 months Show forest plot | 1 | 3483 | Risk Ratio (M‐H, Fixed, 95% CI) | 0.79 [0.42, 1.49] |
| 41 One or more episodes of upper respiratory tract infection in first 12 months Show forest plot | 1 | 510 | Risk Ratio (M‐H, Fixed, 95% CI) | 1.07 [0.96, 1.20] |
| 42 Two or more episodes of upper respiratory tract infection in first 12 months Show forest plot | 2 | 3993 | Risk Ratio (M‐H, Fixed, 95% CI) | 0.91 [0.82, 1.02] |
| 43 Four or more episodes of upper respiratory tract infection in first 12 months Show forest plot | 1 | 510 | Risk Ratio (M‐H, Fixed, 95% CI) | 0.82 [0.52, 1.29] |
| 44 One or more episodes of lower respiratory tract infection in first 12 months Show forest plot | 1 | 510 | Risk Ratio (M‐H, Fixed, 95% CI) | 1.07 [0.86, 1.33] |
| 45 Two or more episodes of respiratory tract infection (upper or lower) in first 12 months Show forest plot | 1 | 3483 | Risk Ratio (M‐H, Fixed, 95% CI) | 0.90 [0.79, 1.03] |
| 46 Hospitalization for respiratory tract infection in first 12 months Show forest plot | 2 | 3993 | Risk Ratio (M‐H, Fixed, 95% CI) | 0.75 [0.60, 0.94] |
| 47 Number of episodes of otitis media in first 12 months Show forest plot | 1 | 279 | Mean Difference (IV, Fixed, 95% CI) | ‐0.04 [‐0.49, 0.41] |
| 48 One or more episodes of otitis media in first 12 months Show forest plot | 2 | 3762 | Risk Ratio (M‐H, Fixed, 95% CI) | 1.28 [1.04, 1.57] |
| 49 Frequent otitis media in first 12 months Show forest plot | 1 | 279 | Risk Ratio (M‐H, Fixed, 95% CI) | 0.81 [0.43, 1.52] |
| 50 Death in first 12 months Show forest plot | 1 | 3483 | Risk Ratio (M‐H, Fixed, 95% CI) | 2.30 [0.21, 25.37] |
| 51 Any dental caries (decayed, missing, or filled teeth) at 6 years Show forest plot | 1 | 2948 | Risk Ratio (M‐H, Fixed, 95% CI) | 0.98 [0.94, 1.03] |
| 52 Any incisor caries (decayed, missing, or filled teeth) at 6 years Show forest plot | 1 | 2948 | Odds Ratio (M‐H, Fixed, 95% CI) | 0.91 [0.72, 1.16] |
| 53 Height at 6.5 years Show forest plot | 1 | 2951 | Mean Difference (IV, Fixed, 95% CI) | 0.10 [‐0.40, 0.60] |
| 54 Leg length at 6.5 years Show forest plot | 1 | 2951 | Mean Difference (IV, Fixed, 95% CI) | 0.20 [‐0.14, 0.54] |
| 55 Head circumference at 6.5 years Show forest plot | 1 | 2951 | Mean Difference (IV, Fixed, 95% CI) | 0.10 [‐0.04, 0.24] |
| 56 BMI at 6.5 years Show forest plot | 1 | 2951 | Mean Difference (IV, Fixed, 95% CI) | 0.20 [0.02, 0.38] |
| 57 Triceps skinfold thickness at 6.5 years Show forest plot | 1 | 2951 | Mean Difference (IV, Fixed, 95% CI) | 0.90 [0.51, 1.29] |
| 58 Subscapular skinfold thickness Show forest plot | 1 | 2951 | Mean Difference (IV, Fixed, 95% CI) | 0.5 [0.25, 0.75] |
| 59 Waist circumference at 6.5 years Show forest plot | 1 | 2951 | Mean Difference (IV, Fixed, 95% CI) | 0.0 [‐0.42, 0.42] |
| 60 Hip circumference at 6.5 years Show forest plot | 1 | 2951 | Mean Difference (IV, Fixed, 95% CI) | 0.5 [0.05, 0.95] |
| 61 Systolic blood pressure at 6.5 years Show forest plot | 1 | 2951 | Mean Difference (IV, Fixed, 95% CI) | 1.30 [0.39, 2.21] |
| 62 Diastolic blood pressure at 6.5 years (mm Hg) Show forest plot | 1 | 2951 | Mean Difference (IV, Fixed, 95% CI) | 1.0 [0.29, 1.71] |
| 63 Atopic eczema at 5‐7 years Show forest plot | 2 | 3584 | Risk Ratio (M‐H, Fixed, 95% CI) | 0.86 [0.47, 1.58] |
| 64 Hay fever at 5‐7 years Show forest plot | 2 | 3584 | Risk Ratio (M‐H, Random, 95% CI) | 0.80 [0.39, 1.65] |
| 65 Asthma at 5‐7 years Show forest plot | 3 | 4023 | Risk Ratio (M‐H, Fixed, 95% CI) | 1.02 [0.72, 1.44] |
| 66 Food allergy at 5 years Show forest plot | 1 | 113 | Risk Ratio (M‐H, Fixed, 95% CI) | 0.61 [0.12, 3.19] |
| 67 Allergy to animal dander at 5 years Show forest plot | 1 | 113 | Risk Ratio (M‐H, Fixed, 95% CI) | 0.81 [0.24, 2.72] |
| 68 Positive skin‐prick test to house dust mite at 6.5 years Show forest plot | 1 | 2320 | Odds Ratio (M‐H, Fixed, 95% CI) | 0.86 [0.62, 1.20] |
| 69 Positive skin‐prick test to cat dander at 6.5 years Show forest plot | 1 | 2320 | Odds Ratio (M‐H, Fixed, 95% CI) | 0.86 [0.60, 1.24] |
| 70 Positive skin‐prick test to birch pollen at 6.5 years Show forest plot | 1 | 2320 | Odds Ratio (M‐H, Fixed, 95% CI) | 0.80 [0.55, 1.18] |
| 71 Positive skin‐prick test to mixed northern grasses at 6.5 years Show forest plot | 1 | 2320 | Odds Ratio (M‐H, Fixed, 95% CI) | 0.71 [0.50, 1.01] |
| 72 Positive skin‐prick test to Alternaria at 6.5 years Show forest plot | 1 | 2320 | Odds Ratio (M‐H, Fixed, 95% CI) | 0.74 [0.47, 1.17] |
| 73 Any positive skin‐prick test at 6‐7 years Show forest plot | 2 | 2651 | Risk Ratio (M‐H, Fixed, 95% CI) | 0.95 [0.81, 1.11] |
| 74 Wechsler cognitive ability test at 6.5 years: vocabulary Show forest plot | 1 | 2944 | Mean Difference (IV, Fixed, 95% CI) | 0.5 [‐0.57, 1.57] |
| 75 Wechsler cognitive ability test at 6.5 years: similarities Show forest plot | 1 | 2944 | Mean Difference (IV, Fixed, 95% CI) | 0.30 [‐0.56, 1.16] |
| 76 Wechsler cognitive ability test at 6.5 years: matrices Show forest plot | 1 | 2944 | Mean Difference (IV, Fixed, 95% CI) | ‐0.20 [‐1.07, 0.67] |
| 77 Wechsler cognitive ability test at 6.5 years: block designs Show forest plot | 1 | 2944 | Mean Difference (IV, Fixed, 95% CI) | 1.30 [0.40, 2.20] |
| 78 Wechsler cognitive ability test at 6.5 years: verbal IQ Show forest plot | 1 | 2944 | Mean Difference (IV, Fixed, 95% CI) | 0.5 [‐0.95, 1.95] |
| 79 Wechsler cognitive ability test at 6.5 years: performance IQ Show forest plot | 1 | 2944 | Mean Difference (IV, Fixed, 95% CI) | 0.80 [‐0.55, 2.15] |
| 80 Wechsler cognitive ability test at 6.5 years: full‐scale IQ Show forest plot | 1 | 2944 | Mean Difference (IV, Fixed, 95% CI) | 0.80 [‐0.58, 2.18] |
| 81 Teacher's academic rating at 6.5 years: reading Show forest plot | 1 | 2196 | Mean Difference (IV, Fixed, 95% CI) | ‐0.10 [‐0.19, ‐0.01] |
| 82 Teacher's academic rating at 6.5 years: writing Show forest plot | 1 | 2196 | Mean Difference (IV, Fixed, 95% CI) | ‐0.12 [‐0.20, ‐0.04] |
| 83 Teacher's academic rating at 6.5 years: mathematics Show forest plot | 1 | 2196 | Mean Difference (IV, Fixed, 95% CI) | ‐0.04 [‐0.12, 0.04] |
| 84 Teacher's academic rating at 6.5 years: other subjects Show forest plot | 1 | 2196 | Mean Difference (IV, Fixed, 95% CI) | ‐0.10 [‐0.17, ‐0.03] |
| 85 Parent's behavior rating at 6.5 years: total difficulties Show forest plot | 1 | 2941 | Mean Difference (IV, Fixed, 95% CI) | 0.30 [‐0.16, 0.76] |
| 86 Parent's behavior rating at 6.5 years: emotional symptoms Show forest plot | 1 | 2941 | Mean Difference (IV, Fixed, 95% CI) | 0.10 [‐0.09, 0.29] |
| 87 Parent's behavior rating at 6.5 years: conduct problems Show forest plot | 1 | 2941 | Mean Difference (IV, Fixed, 95% CI) | 0.0 [‐0.13, 0.13] |
| 88 Parent's behavior rating at 6.5 years: hyperactivity/inattention Show forest plot | 1 | 2941 | Mean Difference (IV, Fixed, 95% CI) | 0.20 [‐0.01, 0.41] |
| 89 Parent's behavior rating at 6.5 years: peer problems Show forest plot | 1 | 2941 | Mean Difference (IV, Fixed, 95% CI) | 0.10 [‐0.05, 0.25] |
| 90 Parent's behavior rating at 6.5 years: prosocial behavior Show forest plot | 1 | 2941 | Mean Difference (IV, Fixed, 95% CI) | 0.10 [‐0.05, 0.25] |
| 91 Teacher's behavior rating at 6.5 years: total difficulties Show forest plot | 1 | 2525 | Mean Difference (IV, Fixed, 95% CI) | 0.10 [‐0.46, 0.66] |
| 92 Teacher's behavior rating at 6.5 years: emotional symptoms Show forest plot | 1 | 2525 | Mean Difference (IV, Fixed, 95% CI) | 0.0 [‐0.18, 0.18] |
| 93 Teacher's behavior rating at 6.5 years: conduct problems Show forest plot | 1 | 2525 | Mean Difference (IV, Fixed, 95% CI) | 0.0 [‐0.17, 0.17] |
| 94 Teacher's behavior rating at 6.5 years: hyperactivity/inattention Show forest plot | 1 | 2525 | Mean Difference (IV, Fixed, 95% CI) | ‐0.10 [‐0.37, 0.17] |
| 95 Teacher's behavior rating at 6.5 years: peer problems Show forest plot | 1 | 2525 | Mean Difference (IV, Fixed, 95% CI) | 0.10 [‐0.08, 0.28] |
| 96 Teacher's behavior rating at 6.5 years: prosocial behavior Show forest plot | 1 | 2525 | Mean Difference (IV, Fixed, 95% CI) | ‐0.10 [‐0.33, 0.13] |
| Outcome or subgroup title | No. of studies | No. of participants | Statistical method | Effect size |
| 1 Very low density lipoprotein concentration (mmol/L) at 9 months Show forest plot | 1 | 26 | Mean Difference (IV, Fixed, 95% CI) | 0.05 [‐0.10, 0.20] |
| 2 Low density lipoproteinconcentration (mmol/L) at 9 months Show forest plot | 1 | 26 | Mean Difference (IV, Fixed, 95% CI) | ‐0.10 [‐0.88, 0.68] |
| 3 High‐density lipoprotein‐2 concentration (mmol/L) at 9 months Show forest plot | 1 | 26 | Mean Difference (IV, Fixed, 95% CI) | 0.08 [‐0.05, 0.21] |
| 4 High‐density lipoprotein‐3 concentration (mmol/L) at 9 months Show forest plot | 1 | 26 | Mean Difference (IV, Fixed, 95% CI) | 0.0 [‐0.07, 0.07] |
| 5 Apoprotein B concentration (mg/dL) at 9 months Show forest plot | 1 | 26 | Mean Difference (IV, Fixed, 95% CI) | 5.0 [‐14.93, 24.93] |
| 6 Total triglyceride concentration (mmol/L) at 9 months Show forest plot | 1 | 26 | Mean Difference (IV, Fixed, 95% CI) | 0.3 [‐0.23, 0.83] |