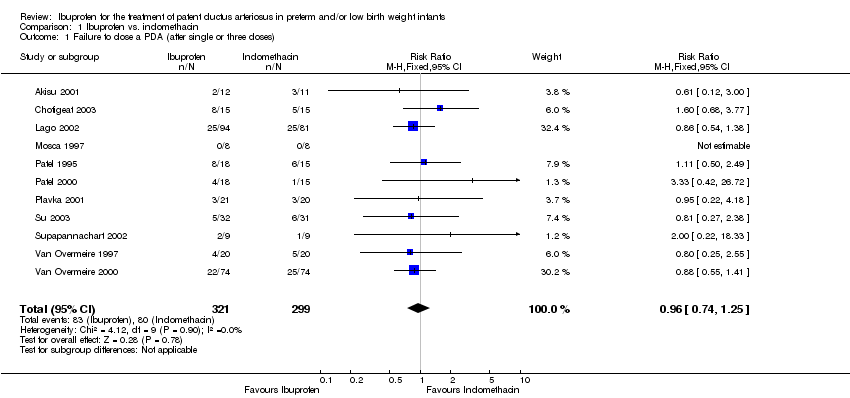
| 1 Failure to close a PDA (after single or three doses) Show forest plot | 11 | 620 | Risk Ratio (M‐H, Fixed, 95% CI) | 0.96 [0.74, 1.25] |
|
| 2 All cause mortality Show forest plot | 4 | 301 | Risk Ratio (M‐H, Fixed, 95% CI) | 0.79 [0.39, 1.57] |
|
| 3 Neonatal mortality (during first 28/30 days of life) Show forest plot | 1 | 148 | Risk Ratio (M‐H, Fixed, 95% CI) | 1.17 [0.41, 3.31] |
|
| 4 Infant mortality (death during the first year of life) | 0 | 0 | Risk Ratio (M‐H, Fixed, 95% CI) | 0.0 [0.0, 0.0] |
| 5 Reopening of the ductus arteriosus Show forest plot | 3 | 120 | Risk Ratio (M‐H, Fixed, 95% CI) | 1.32 [0.47, 3.74] |
|
| 6 Need for surgical closure of the PDA Show forest plot | 7 | 530 | Risk Ratio (M‐H, Fixed, 95% CI) | 0.93 [0.58, 1.49] |
|
| 7 Need for treatment with indomethacin to close the PDA | 0 | 0 | Risk Ratio (M‐H, Fixed, 95% CI) | 0.0 [0.0, 0.0] |
| 8 Duration of ventilator support Show forest plot | 3 | 278 | Mean Difference (IV, Fixed, 95% CI) | ‐1.05 [‐4.17, 2.06] |
|
| 9 Intraventricular haemorrhage (Grade I‐IV) Show forest plot | 3 | 126 | Risk Ratio (M‐H, Fixed, 95% CI) | 0.76 [0.30, 1.90] |
|
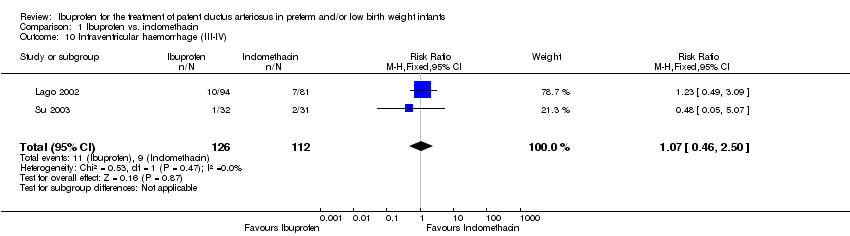
| 10 Intraventricular haemorrhage (III‐IV) Show forest plot | 2 | 238 | Risk Ratio (M‐H, Fixed, 95% CI) | 1.07 [0.46, 2.50] |
|
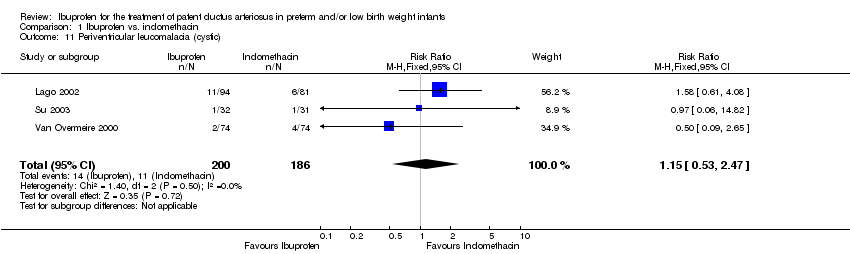
| 11 Periventricular leucomalacia (cystic) Show forest plot | 3 | 386 | Risk Ratio (M‐H, Fixed, 95% CI) | 1.15 [0.53, 2.47] |
|
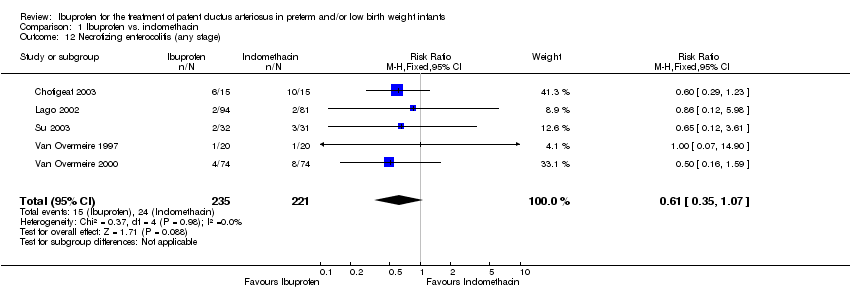
| 12 Necrotizing enterocolitis (any stage) Show forest plot | 5 | 456 | Risk Ratio (M‐H, Fixed, 95% CI) | 0.61 [0.35, 1.07] |
|
| 13 Decreased urine output (<1 cc/kg/hr) Show forest plot | 2 | 323 | Risk Ratio (M‐H, Fixed, 95% CI) | 0.22 [0.09, 0.51] |
|
| 14 Time to full enteral feeds Show forest plot | 3 | 386 | Mean Difference (IV, Fixed, 95% CI) | 1.14 [‐1.50, 3.77] |
|
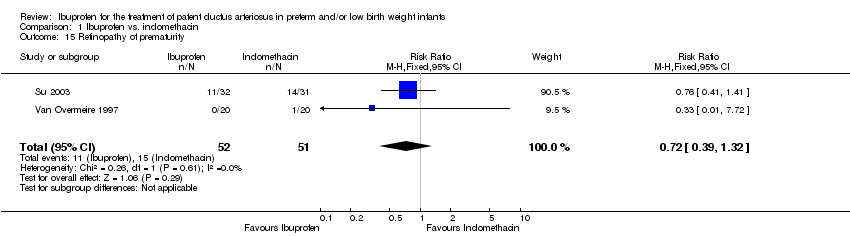
| 15 Retinopathy of prematurity Show forest plot | 2 | 103 | Risk Ratio (M‐H, Fixed, 95% CI) | 0.72 [0.39, 1.32] |
|
| 16 Pneumothorax | 0 | 0 | Risk Ratio (M‐H, Fixed, 95% CI) | 0.0 [0.0, 0.0] |
| 17 Chronic lung disease (at 28 days) Show forest plot | 2 | 188 | Risk Ratio (M‐H, Fixed, 95% CI) | 1.37 [1.01, 1.86] |
|
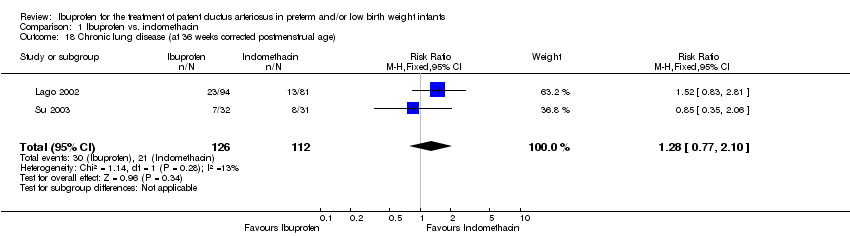
| 18 Chronic lung disease (at 36 weeks corrected postmenstrual age) Show forest plot | 2 | 238 | Risk Ratio (M‐H, Fixed, 95% CI) | 1.28 [0.77, 2.10] |
|
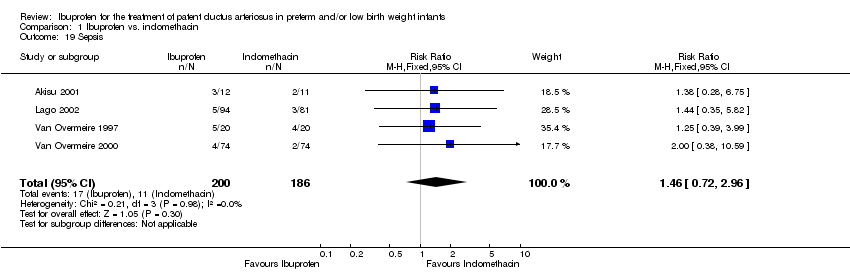
| 19 Sepsis Show forest plot | 4 | 386 | Risk Ratio (M‐H, Fixed, 95% CI) | 1.46 [0.72, 2.96] |
|
| 20 Duration of hospitalization Show forest plot | 2 | 238 | Mean Difference (IV, Fixed, 95% CI) | ‐3.52 [‐9.87, 2.83] |
|
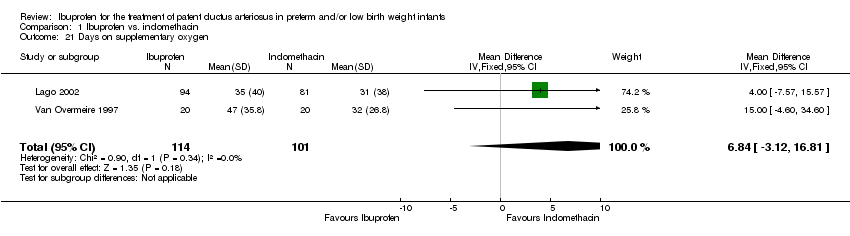
| 21 Days on supplementary oxygen Show forest plot | 2 | 215 | Mean Difference (IV, Fixed, 95% CI) | 6.84 [‐3.12, 16.81] |
|
| 22 Gastrointestinal bleed Show forest plot | 2 | 86 | Risk Ratio (M‐H, Fixed, 95% CI) | 0.67 [0.14, 3.25] |
|
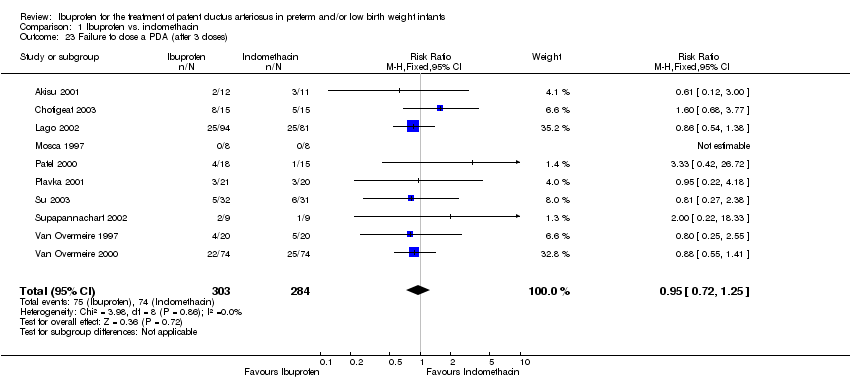
| 23 Failure to close a PDA (after 3 doses) Show forest plot | 10 | 587 | Risk Ratio (M‐H, Fixed, 95% CI) | 0.95 [0.72, 1.25] |
|
| 24 Failure to close a PDA (after 3 doses, abstracts excluded) Show forest plot | 7 | 498 | Risk Ratio (M‐H, Fixed, 95% CI) | 0.89 [0.66, 1.19] |
|