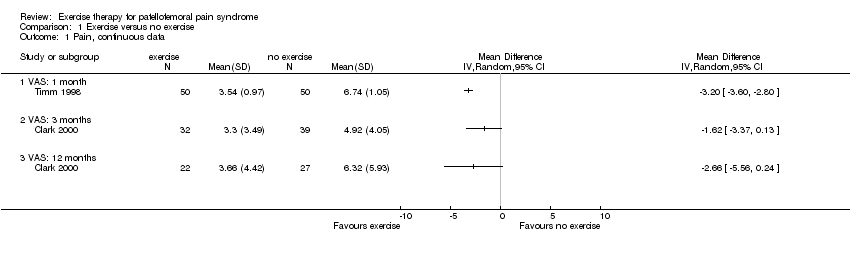
| 1 Pain, continuous data Show forest plot | 3 | | Mean Difference (IV, Random, 95% CI) | Totals not selected |
|
| 1.1 VAS: 6 weeks | 1 | | Mean Difference (IV, Random, 95% CI) | 0.0 [0.0, 0.0] |
| 1.2 VAS walking stairs: 6 weeks | 1 | | Mean Difference (IV, Random, 95% CI) | 0.0 [0.0, 0.0] |
| 1.3 VAS sitting with knees bent: 6 weeks | 1 | | Mean Difference (IV, Random, 95% CI) | 0.0 [0.0, 0.0] |
| 1.4 VAS bending knees: 6 weeks | 1 | | Mean Difference (IV, Random, 95% CI) | 0.0 [0.0, 0.0] |
| 1.5 VAS during triple jump test: 5 weeks | 1 | | Mean Difference (IV, Random, 95% CI) | 0.0 [0.0, 0.0] |
| 1.6 VAS during daily activity: 5 weeks | 1 | | Mean Difference (IV, Random, 95% CI) | 0.0 [0.0, 0.0] |
| 1.7 VAS during triple jump test: 3 months | 1 | | Mean Difference (IV, Random, 95% CI) | 0.0 [0.0, 0.0] |
| 1.8 VAS during daily activity: 3 months | 1 | | Mean Difference (IV, Random, 95% CI) | 0.0 [0.0, 0.0] |
| 2 Pain, dichotomous data Show forest plot | 1 | | Risk Ratio (M‐H, Random, 95% CI) | Totals not selected |
|
| 2.1 >50% improvement: 6‐8 weeks | 1 | | Risk Ratio (M‐H, Random, 95% CI) | 0.0 [0.0, 0.0] |
| 3 Function, continuous data Show forest plot | 3 | | Mean Difference (IV, Random, 95% CI) | Totals not selected |
|
| 3.1 Kujala Patellofemoral Scale: ± 6 weeks | 2 | | Mean Difference (IV, Random, 95% CI) | 0.0 [0.0, 0.0] |
| 3.2 Kujala Patellofemoral Scale: 3 months | 1 | | Mean Difference (IV, Random, 95% CI) | 0.0 [0.0, 0.0] |
| 3.3 Number of retro‐step repetitions until painful: 8 weeks | 1 | | Mean Difference (IV, Random, 95% CI) | 0.0 [0.0, 0.0] |
| 3.4 Number of retro‐step repetitions until painful: 1 year | 1 | | Mean Difference (IV, Random, 95% CI) | 0.0 [0.0, 0.0] |
| 4 Function, dichotomous data Show forest plot | 2 | | Risk Ratio (M‐H, Random, 95% CI) | Totals not selected |
|
| 4.1 Overall assessment of function ‐ number of patients improved: 6 weeks | 1 | | Risk Ratio (M‐H, Random, 95% CI) | 0.0 [0.0, 0.0] |
| 4.2 Asymptomatic patients in unilateral squat test: 5 weeks | 1 | | Risk Ratio (M‐H, Random, 95% CI) | 0.0 [0.0, 0.0] |
| 4.3 Asymptomatic patients in step up test: 5 weeks | 1 | | Risk Ratio (M‐H, Random, 95% CI) | 0.0 [0.0, 0.0] |
| 4.4 Asymptomatic patients in step down test: 5 weeks | 1 | | Risk Ratio (M‐H, Random, 95% CI) | 0.0 [0.0, 0.0] |
| 4.5 Asymptomatic patients in unilateral squat test: 3 months | 1 | | Risk Ratio (M‐H, Random, 95% CI) | 0.0 [0.0, 0.0] |
| 4.6 Asymptomatic patients in step up test: 3 months | 1 | | Risk Ratio (M‐H, Random, 95% CI) | 0.0 [0.0, 0.0] |
| 4.7 Asymptomatic patients in step down test: 3 months | 1 | | Risk Ratio (M‐H, Random, 95% CI) | 0.0 [0.0, 0.0] |
| 5 Function, categorical data Show forest plot | | | Other data | No numeric data |
|
| 5.1 Function Index Questionnaire: 6 months | | | Other data | No numeric data |
| 5.2 Function Index Questionnaire: 12 months | | | Other data | No numeric data |
| 6 Global assessment, 11‐point scale, continuous data Show forest plot | 1 | | Mean Difference (IV, Random, 95% CI) | Totals not selected |
|
| 6.1 Satisfaction with therapy: 6 weeks | 1 | | Mean Difference (IV, Random, 95% CI) | 0.0 [0.0, 0.0] |
| 6.2 Satisfaction with recovery: 6 weeks | 1 | | Mean Difference (IV, Random, 95% CI) | 0.0 [0.0, 0.0] |
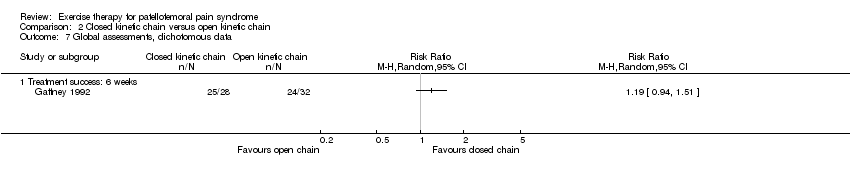
| 7 Global assessments, dichotomous data Show forest plot | 1 | | Risk Ratio (M‐H, Random, 95% CI) | Totals not selected |
|
| 7.1 Treatment success: 6 weeks | 1 | | Risk Ratio (M‐H, Random, 95% CI) | 0.0 [0.0, 0.0] |