Exercise therapy for patellofemoral pain syndrome
Referencias
References to studies included in this review
References to studies excluded from this review
References to studies awaiting assessment
Additional references
Characteristics of studies
Characteristics of included studies [ordered by study ID]
Ir a:
| Methods | RCT High quality: Delphi score 6 | |
| Participants | AKP/PFPS, median duration >12 months (<3 to >12) 1) n=20 | |
| Interventions | Duration 3 months, 6 sessions Education: background of PFPS | |
| Outcomes | VAS pain: baseline, 3 months, 12 months | |
| Notes | Drop‐outs: | |
| Risk of bias | ||
| Bias | Authors' judgement | Support for judgement |
| Allocation concealment? | Low risk | A ‐ Adequate |
| Methods | RCT Low quality: Delphi score 3 | |
| Participants | PFPS, mild or moderate 1) n=13 | |
| Interventions | Duration 6‐8 weeks, | |
| Outcomes | Baseline, 6‐8 weeks: | |
| Notes | 1) 2 withdrawals: 1 female increased pain, 1 male vacation interruptions, | |
| Risk of bias | ||
| Bias | Authors' judgement | Support for judgement |
| Allocation concealment? | Unclear risk | B ‐ Unclear |
| Methods | RCT Low quality: Delphi score 4 | |
| Participants | PFPS, all unilateral, duration: 10 ± 8 months 60 patients, 20% male 1) n=30 | |
| Interventions | Conventional exercise program: 4 weeks 5 days/week supervised, total duration not stated. Biofeedback 4 weeks, 3 times per week. | |
| Outcomes | VAS pain: baseline, 1, 2, 3 months | |
| Notes | No drop outs | |
| Risk of bias | ||
| Bias | Authors' judgement | Support for judgement |
| Allocation concealment? | Unclear risk | B ‐ Unclear |
| Methods | RCT Low quality: Delphi score 3 | |
| Participants | PFPS/chondromalacia, 50% bilateral 1) n=36 | |
| Interventions | Duration 6 weeks, weekly visits to check correct performance all groups, stretching retinaculum before taping | |
| Outcomes | VAS pain baseline, 6 weeks: | |
| Notes | 1) 8 withdrawals Descriptions: | |
| Risk of bias | ||
| Bias | Authors' judgement | Support for judgement |
| Allocation concealment? | Unclear risk | B ‐ Unclear |
| Methods | RCT Low quality: Delphi score 1 | |
| Participants | Chondropathy, type Wyberg I or II (not III), with or without dysplasia of the patella 40 patients per group were included, analysed were following numbers: | |
| Interventions | Duration 4 weeks, | |
| Outcomes | Arpège function scale: baseline, 4 weeks | |
| Notes | Drop out reasons: | |
| Risk of bias | ||
| Bias | Authors' judgement | Support for judgement |
| Allocation concealment? | Unclear risk | D ‐ Not used |
| Methods | RCT Low quality: Delphi score 3 | |
| Participants | PFPS, 54% bilateral, 15% of patients limitations in activities 1) n=42 | |
| Interventions | Duration 4 weeks, | |
| Outcomes | VAS 3 days average of worst pain: baseline, 1, 3, 6, 12 months | |
| Notes | In particular patients with good results at 1 month dropped out Number of patients 0, 1, 3, 6, 12 months: | |
| Risk of bias | ||
| Bias | Authors' judgement | Support for judgement |
| Allocation concealment? | Unclear risk | B ‐ Unclear |
| Methods | CCT Low quality: Delphi score 3 | |
| Participants | Chondromalacia, all unilateral, | |
| Interventions | Duration 4 weeks | |
| Outcomes | CRS, overall activity level: 4 weeks | |
| Notes | No drop‐outs | |
| Risk of bias | ||
| Bias | Authors' judgement | Support for judgement |
| Allocation concealment? | Unclear risk | D ‐ Not used |
| Methods | CCT Low quality: Delphi score 1 | |
| Participants | PFPS, 1) n=11 2) n=12 | |
| Interventions | Duration 8 weeks | |
| Outcomes | Retro step repetitions until intolerance of symptomatic leg | |
| Notes | 1) 6 drop‐outs | |
| Risk of bias | ||
| Bias | Authors' judgement | Support for judgement |
| Allocation concealment? | Unclear risk | D ‐ Not used |
| Methods | RCT Low quality: Delphi score 3 | |
| Participants | PFPS, 27% bilateral, 75% pain with sports, 1) n=20 | |
| Interventions | Duration: 3 sessions to familiarise with training, 12 weeks training, 3 days per week during week 1 and 2, thereafter 2 days per week 1) isometric exercise | |
| Outcomes | Number of patients participating in sports with/without pain: 0, 3, 12 months | |
| Notes | No drop‐outs reported | |
| Risk of bias | ||
| Bias | Authors' judgement | Support for judgement |
| Allocation concealment? | Unclear risk | B ‐ Unclear |
| Methods | RCT Low quality: Delphi score 3 | |
| Participants | PFPS, all unilateral, duration: 12.5 ± 5 weeks (5‐19) | |
| Interventions | 4 weeks duration, daily use of Protonics® device | |
| Outcomes | VAS pain: baseline, 4 weeks | |
| Notes | No drop‐outs reported | |
| Risk of bias | ||
| Bias | Authors' judgement | Support for judgement |
| Allocation concealment? | Unclear risk | B ‐ Unclear |
| Methods | RCT High quality: Delphi score 6 | |
| Participants | PFPS, 1) n=7 | |
| Interventions | Duration 6 weeks: group 1 group 2 home exercise intensity not specified | |
| Outcomes | 11‐point pain scale walking stairs, mean (min‐max): baseline, 6 weeks | |
| Notes | Drop‐outs | |
| Risk of bias | ||
| Bias | Authors' judgement | Support for judgement |
| Allocation concealment? | Low risk | A ‐ Adequate |
| Methods | RCT High quality: Delphi score 6 | |
| Participants | PFPS, 45% bilateral, duration: 15.1 (0.5 ‐ 28) months 1) n=30 | |
| Interventions | Duration: 5 weeks, three days per week | |
| Outcomes | VAS pain during daily activity: baseline, 5 weeks, 3 months | |
| Notes | No drop‐outs | |
| Risk of bias | ||
| Bias | Authors' judgement | Support for judgement |
| Allocation concealment? | Low risk | A ‐ Adequate |
*stretching exercises usually focus on knee flexors and extensors and iliotibial band, sometimes patellar retinaculum
ABBREVIATIONS AND ACRONYMS
AKP: anterior knee pain
PFPS: patellofemoral pain syndrome
GP: General Practitioner
RCT: randomised controlled trial
CCT: concurrent controlled trial
VAS: visual analogue scale
WOMAC: osteoarthritis index, measuring pain, disability and stiffness of the knee or hip
FIQ: functional index questionnaire
KPFS: Kujala patellofemoral function scale
CRS: Cincinnati rating scale
Characteristics of excluded studies [ordered by study ID]
Ir a:
| Study | Reason for exclusion |
| Publication was not full text article, contact with third author did not yield data. | |
| Description of results insufficient. | |
| The contrast between both exercising treatment groups existed of taping of the patella, which is not the aim of this review. | |
| Number of patients with plica syndrome, Osgood Schlatter and tendinitis not mentioned, no subgroups reported. |
Data and analyses
| Outcome or subgroup title | No. of studies | No. of participants | Statistical method | Effect size |
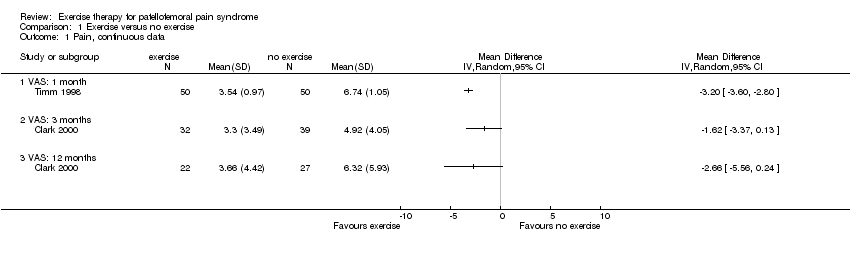
| 1 Pain, continuous data Show forest plot | 2 | Mean Difference (IV, Random, 95% CI) | Totals not selected | |
| Analysis 1.1  Comparison 1 Exercise versus no exercise, Outcome 1 Pain, continuous data. | ||||
| 1.1 VAS: 1 month | 1 | Mean Difference (IV, Random, 95% CI) | 0.0 [0.0, 0.0] | |
| 1.2 VAS: 3 months | 1 | Mean Difference (IV, Random, 95% CI) | 0.0 [0.0, 0.0] | |
| 1.3 VAS: 12 months | 1 | Mean Difference (IV, Random, 95% CI) | 0.0 [0.0, 0.0] | |
| 2 Function, continuous data Show forest plot | 3 | Mean Difference (IV, Random, 95% CI) | Totals not selected | |
| Analysis 1.2  Comparison 1 Exercise versus no exercise, Outcome 2 Function, continuous data. | ||||
| 2.1 Cincinnatti overall activity level: 1 month, static exercise versus no exercise | 1 | Mean Difference (IV, Random, 95% CI) | 0.0 [0.0, 0.0] | |
| 2.2 Cincinnatti overall activity level: 1 month, isokinetic exercise versus no exercise | 1 | Mean Difference (IV, Random, 95% CI) | 0.0 [0.0, 0.0] | |
| 2.3 Kujala Patellofemoral Scale: 1 month | 1 | Mean Difference (IV, Random, 95% CI) | 0.0 [0.0, 0.0] | |
| 2.4 100 ‐ WOMAC = inversed WOMAC scale: 3 months | 1 | Mean Difference (IV, Random, 95% CI) | 0.0 [0.0, 0.0] | |
| 2.5 100 ‐ WOMAC = inversed WOMAC scale: 12 months | 1 | Mean Difference (IV, Random, 95% CI) | 0.0 [0.0, 0.0] | |
| 3 Recovery, dichotomous data Show forest plot | 1 | Risk Ratio (M‐H, Random, 95% CI) | Totals not selected | |
| Analysis 1.3  Comparison 1 Exercise versus no exercise, Outcome 3 Recovery, dichotomous data. | ||||
| 3.1 Number of patients discharged from therapy because of patient's satisfaction, 3 months | 1 | Risk Ratio (M‐H, Random, 95% CI) | 0.0 [0.0, 0.0] | |
| 3.2 Number of patients no longer troubled by symptoms, 12 months | 1 | Risk Ratio (M‐H, Random, 95% CI) | 0.0 [0.0, 0.0] | |
| 3.3 Number of patients discontinuing therapy after 12 months | 1 | Risk Ratio (M‐H, Random, 95% CI) | 0.0 [0.0, 0.0] | |
| Outcome or subgroup title | No. of studies | No. of participants | Statistical method | Effect size | ||||||||||||||||||||||||||||||||||||||||
| 1 Pain, continuous data Show forest plot | 3 | Mean Difference (IV, Random, 95% CI) | Totals not selected | |||||||||||||||||||||||||||||||||||||||||
| Analysis 2.1  Comparison 2 Closed kinetic chain versus open kinetic chain, Outcome 1 Pain, continuous data. | ||||||||||||||||||||||||||||||||||||||||||||
| 1.1 VAS: 6 weeks | 1 | Mean Difference (IV, Random, 95% CI) | 0.0 [0.0, 0.0] | |||||||||||||||||||||||||||||||||||||||||
| 1.2 VAS walking stairs: 6 weeks | 1 | Mean Difference (IV, Random, 95% CI) | 0.0 [0.0, 0.0] | |||||||||||||||||||||||||||||||||||||||||
| 1.3 VAS sitting with knees bent: 6 weeks | 1 | Mean Difference (IV, Random, 95% CI) | 0.0 [0.0, 0.0] | |||||||||||||||||||||||||||||||||||||||||
| 1.4 VAS bending knees: 6 weeks | 1 | Mean Difference (IV, Random, 95% CI) | 0.0 [0.0, 0.0] | |||||||||||||||||||||||||||||||||||||||||
| 1.5 VAS during triple jump test: 5 weeks | 1 | Mean Difference (IV, Random, 95% CI) | 0.0 [0.0, 0.0] | |||||||||||||||||||||||||||||||||||||||||
| 1.6 VAS during daily activity: 5 weeks | 1 | Mean Difference (IV, Random, 95% CI) | 0.0 [0.0, 0.0] | |||||||||||||||||||||||||||||||||||||||||
| 1.7 VAS during triple jump test: 3 months | 1 | Mean Difference (IV, Random, 95% CI) | 0.0 [0.0, 0.0] | |||||||||||||||||||||||||||||||||||||||||
| 1.8 VAS during daily activity: 3 months | 1 | Mean Difference (IV, Random, 95% CI) | 0.0 [0.0, 0.0] | |||||||||||||||||||||||||||||||||||||||||
| 2 Pain, dichotomous data Show forest plot | 1 | Risk Ratio (M‐H, Random, 95% CI) | Totals not selected | |||||||||||||||||||||||||||||||||||||||||
| Analysis 2.2  Comparison 2 Closed kinetic chain versus open kinetic chain, Outcome 2 Pain, dichotomous data. | ||||||||||||||||||||||||||||||||||||||||||||
| 2.1 >50% improvement: 6‐8 weeks | 1 | Risk Ratio (M‐H, Random, 95% CI) | 0.0 [0.0, 0.0] | |||||||||||||||||||||||||||||||||||||||||
| 3 Function, continuous data Show forest plot | 3 | Mean Difference (IV, Random, 95% CI) | Totals not selected | |||||||||||||||||||||||||||||||||||||||||
| Analysis 2.3  Comparison 2 Closed kinetic chain versus open kinetic chain, Outcome 3 Function, continuous data. | ||||||||||||||||||||||||||||||||||||||||||||
| 3.1 Kujala Patellofemoral Scale: ± 6 weeks | 2 | Mean Difference (IV, Random, 95% CI) | 0.0 [0.0, 0.0] | |||||||||||||||||||||||||||||||||||||||||
| 3.2 Kujala Patellofemoral Scale: 3 months | 1 | Mean Difference (IV, Random, 95% CI) | 0.0 [0.0, 0.0] | |||||||||||||||||||||||||||||||||||||||||
| 3.3 Number of retro‐step repetitions until painful: 8 weeks | 1 | Mean Difference (IV, Random, 95% CI) | 0.0 [0.0, 0.0] | |||||||||||||||||||||||||||||||||||||||||
| 3.4 Number of retro‐step repetitions until painful: 1 year | 1 | Mean Difference (IV, Random, 95% CI) | 0.0 [0.0, 0.0] | |||||||||||||||||||||||||||||||||||||||||
| 4 Function, dichotomous data Show forest plot | 2 | Risk Ratio (M‐H, Random, 95% CI) | Totals not selected | |||||||||||||||||||||||||||||||||||||||||
| Analysis 2.4  Comparison 2 Closed kinetic chain versus open kinetic chain, Outcome 4 Function, dichotomous data. | ||||||||||||||||||||||||||||||||||||||||||||
| 4.1 Overall assessment of function ‐ number of patients improved: 6 weeks | 1 | Risk Ratio (M‐H, Random, 95% CI) | 0.0 [0.0, 0.0] | |||||||||||||||||||||||||||||||||||||||||
| 4.2 Asymptomatic patients in unilateral squat test: 5 weeks | 1 | Risk Ratio (M‐H, Random, 95% CI) | 0.0 [0.0, 0.0] | |||||||||||||||||||||||||||||||||||||||||
| 4.3 Asymptomatic patients in step up test: 5 weeks | 1 | Risk Ratio (M‐H, Random, 95% CI) | 0.0 [0.0, 0.0] | |||||||||||||||||||||||||||||||||||||||||
| 4.4 Asymptomatic patients in step down test: 5 weeks | 1 | Risk Ratio (M‐H, Random, 95% CI) | 0.0 [0.0, 0.0] | |||||||||||||||||||||||||||||||||||||||||
| 4.5 Asymptomatic patients in unilateral squat test: 3 months | 1 | Risk Ratio (M‐H, Random, 95% CI) | 0.0 [0.0, 0.0] | |||||||||||||||||||||||||||||||||||||||||
| 4.6 Asymptomatic patients in step up test: 3 months | 1 | Risk Ratio (M‐H, Random, 95% CI) | 0.0 [0.0, 0.0] | |||||||||||||||||||||||||||||||||||||||||
| 4.7 Asymptomatic patients in step down test: 3 months | 1 | Risk Ratio (M‐H, Random, 95% CI) | 0.0 [0.0, 0.0] | |||||||||||||||||||||||||||||||||||||||||
| 5 Function, categorical data Show forest plot | Other data | No numeric data | ||||||||||||||||||||||||||||||||||||||||||
| Analysis 2.5
Comparison 2 Closed kinetic chain versus open kinetic chain, Outcome 5 Function, categorical data. | ||||||||||||||||||||||||||||||||||||||||||||
| 5.1 Function Index Questionnaire: 6 months | Other data | No numeric data | ||||||||||||||||||||||||||||||||||||||||||
| 5.2 Function Index Questionnaire: 12 months | Other data | No numeric data | ||||||||||||||||||||||||||||||||||||||||||
| 6 Global assessment, 11‐point scale, continuous data Show forest plot | 1 | Mean Difference (IV, Random, 95% CI) | Totals not selected | |||||||||||||||||||||||||||||||||||||||||
| Analysis 2.6  Comparison 2 Closed kinetic chain versus open kinetic chain, Outcome 6 Global assessment, 11‐point scale, continuous data. | ||||||||||||||||||||||||||||||||||||||||||||
| 6.1 Satisfaction with therapy: 6 weeks | 1 | Mean Difference (IV, Random, 95% CI) | 0.0 [0.0, 0.0] | |||||||||||||||||||||||||||||||||||||||||
| 6.2 Satisfaction with recovery: 6 weeks | 1 | Mean Difference (IV, Random, 95% CI) | 0.0 [0.0, 0.0] | |||||||||||||||||||||||||||||||||||||||||
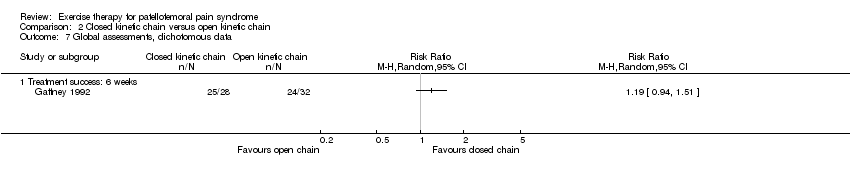
| 7 Global assessments, dichotomous data Show forest plot | 1 | Risk Ratio (M‐H, Random, 95% CI) | Totals not selected | |||||||||||||||||||||||||||||||||||||||||
| Analysis 2.7  Comparison 2 Closed kinetic chain versus open kinetic chain, Outcome 7 Global assessments, dichotomous data. | ||||||||||||||||||||||||||||||||||||||||||||
| 7.1 Treatment success: 6 weeks | 1 | Risk Ratio (M‐H, Random, 95% CI) | 0.0 [0.0, 0.0] | |||||||||||||||||||||||||||||||||||||||||

Methodological quality scores after consensus meeting
Comparison 1 Exercise versus no exercise, Outcome 1 Pain, continuous data.

Comparison 1 Exercise versus no exercise, Outcome 2 Function, continuous data.

Comparison 1 Exercise versus no exercise, Outcome 3 Recovery, dichotomous data.

Comparison 2 Closed kinetic chain versus open kinetic chain, Outcome 1 Pain, continuous data.

Comparison 2 Closed kinetic chain versus open kinetic chain, Outcome 2 Pain, dichotomous data.

Comparison 2 Closed kinetic chain versus open kinetic chain, Outcome 3 Function, continuous data.

Comparison 2 Closed kinetic chain versus open kinetic chain, Outcome 4 Function, dichotomous data.
| Study | Months | Rating | Closed kinetic chain | Open kinetic chain |
| Function Index Questionnaire: 6 months | ||||
| Stiene 1996 | 6 | poor (0‐4) | 0 | 1 |
| Stiene 1996 | ||||
| Function Index Questionnaire: 12 months | ||||
| Stiene 1996 | 12 | poor (0‐4) | 0 | 1 |
| Stiene 1996 | ||||
Comparison 2 Closed kinetic chain versus open kinetic chain, Outcome 5 Function, categorical data.

Comparison 2 Closed kinetic chain versus open kinetic chain, Outcome 6 Global assessment, 11‐point scale, continuous data.
Comparison 2 Closed kinetic chain versus open kinetic chain, Outcome 7 Global assessments, dichotomous data.
| Item | Score | Notes |
| D1. Was a method of randomisation performed? | 2 = yes, clearly described method of randomisation | Cochrane code (Clarke 2003b): Clearly yes = A; Not sure = B; Clearly no = C |
| M‐A. (D2) Was the assigned treatment adequately concealed prior to allocation? | 2 = method did not allow disclosure of assignment | |
| M‐B. (D9) Were the outcomes of patients who withdrew described and included in the analysis (intention‐to‐treat)? | 2 = withdrawals well described and accounted for in analysis | |
| M‐C. (D5) Were the outcome assessors blinded to treatment status? | 2 = effective action taken to blind assessors | |
| M‐D. (D3) Were the treatment and control group comparable at entry? | 2 = good comparability of groups, or confounding adjusted for in analysis | |
| M‐E. (D7) Were the participants blind to assignment status after allocation? | 2 = effective action taken to blind participants | |
| M‐F. (D6) Were the treatment providers blind to assignment status after allocation? | 2 = effective action taken to blind treatment providers | |
| M‐G. Were care programmes, other than the trial options, identical? | 2 = care programmes clearly identical | |
| M‐H. (D4) Were the inclusion and exclusion criteria clearly defined? | 2 = clearly defined | |
| M‐I. Were the interventions clearly defined? | 2 = clearly defined interventions are applied with a standardised protocol | |
| M‐J. Were the outcome measures used clearly defined? | 2 = clearly defined | |
| M‐K. Were diagnostic tests used in outcome assessment clinically useful? (by outcome) | 2 = optimal | |
| M‐L. Was the surveillance active and of clinically appropriate duration? | 2 = active surveillance and appropriate duration (>three weeks) | |
| D8. Were point estimates and measures of variability presented for the primary outcome measures? | 2 = point estimates and measures of variability presented | |
| T. Was the compliance rate in each group unlikely to cause bias? | 2 = compliance well described and accounted for in analysis | |
| X. Was a predefined set of diagnostic criteria provided for the included participants? | 2 = clear description of diagnosis as well as diagnostic criteria were provided, or clear diagnostic exclusion criteria were provided | |
| In this Table, items beginning with 'D' denote items from the Delphi‐list, while those beginning with 'M' denote items taken from the Cochrane Bone, Joint and Muscle Trauma Group methodological quality assessment tool and 'T' denotes the item from the Maastricht‐Amsterdam consensus list for Methodological Quality Assessment. In view of the diversity of diagnostic terms used for PFPS, one more item was added for scoring whether a predefined set of diagnostic criteria was provided in the study. This criterion is denoted with 'X'. | ||
| Study ID | Outcome measure | Instrument | Weeks | N exercise | Change (%) or N | N no exercise | Change (%) or N | Mean diff. (95% CI) | Stat. sign.? |
| Clark 2000 | Pain | VAS (0‐100 mm) | 13 | 32 | ‐34.4 ±41.6 (45%)* | 39 | ‐26.8 ±43.8 (43%)* | ‐7.6 (‐28 ‐ 12.9) | no |
| 52 | 22 | ‐39.8 (52%)* | 27 | ‐17.0 (21%)* | Not reported† | yes | |||
| Function | WOMAC | 13 | 32 | ‐11.7 ±12.4 (48%)* | 39 | ‐13.4 ±14.2 (33%)* | 1.7 (‐4.7 ‐ 8.1) | no | |
| 52 | 22 | ‐9.4 (38%)* | 27 | ‐6.4 (21%)* | Not reported | no | |||
| Patient | Discharge from | 13 | 40 | 39* | 31 | 21* | OR = 1.90 | yes | |
| Recovery | No longer troubled | 52 | 22 | 9 | 27 | 5 | OR = 2.21 | no | |
| Recovery | Discontinuing therapy | 52 | 22 | 18 | 27 | 19 | OR = 1.16 | no | |
| McMullen 1990 | Pain | VAS (0‐10 cm) | 4 | "No change" | "No change" | no | |||
| Function | Overall activity level (CRS) | 4 | 11 | Medium effect size | 9 | Small effect size | yes | ||
| Isokinetic vs control | 4 | 9 | Medium effect size | yes | |||||
| Timm 1998 | Pain | VAS (0‐10 cm) | 4 | 50 | ‐2.96 (47%)* | 50 | +0.20 (0.03%) | ‐3.16† | yes |
| Function | KPFS | 4 | 50 | +45.04 (108%)* | 50 | ‐0.22 (0.01%) | 45.26† | yes | |
| * = significant | VAS=Visual Analog Scale | RR=Relative Risk |
| Study ID | Outcome | Instrument | Weeks | N open chain | Change (%) | N closed chain | Change (%) | Mean diff. (95% CI) | Stat. sign.? |
| Witvrouw 2000 | Pain | VAS (0‐100 mm) | 5 | 30 | ‐11.5 (‐46%)* | 30 | ‐11.0 (‐46%)* | 0.5 | no |
| 13 | 30 | ‐16.1 (‐64%)* | 30 | ‐13.3 (‐56%)* | 2.8 | no | |||
| VAS (0‐100 mm) | 5 | 30 | ‐17.0 (‐31%)* | 30 | ‐15.0 (‐27%)* | 2 | no | ||
| 13 | 30 | ‐15.0 (‐28%)* | 30 | ‐25.0 (‐45%)* | ‐10 | no | |||
| Function | KPFS | 5 | 30 | +12 (18%)* | 30 | +15 (22%)* | 3 | no | |
| 13 | 30 | +16 (24%)* | 30 | +19 (28%)* | 3 | no | |||
| N asymptomatic | 5 | 30 | +5 (83%)* | 30 | +7 (117%)* | RR = 1.52 | no | ||
| 13 | 30 | +10 (167%)* | 30 | +11 (183%)* | RR = 1.16 | no | |||
| N asymptomatic | 5 | 30 | +12 (109%)* | 30 | +10 (125%)* | RR = 0.75 | no | ||
| 13 | 30 | +11 (100%)* | 30 | +14 (175%)* | RR = 1.51 | no | |||
| N asymptomatic | 5 | 30 | +11 (138%)* | 30 | +7 (140%)* | RR = 0.53 | no | ||
| 13 | 30 | +15 (188%)* | 30 | +15 (300%)* | RR = 1.00 | no | |||
| Wijnen 1996 | Pain | VAS (0‐10) | 6 | 7 | ‐1.2 (‐23%) | 8 | ‐1.9 (‐30%) | 0.3 (‐2.66 ‐ 3.26) | no |
| VAS (0‐10) | 6 | 7 | ‐0.5 (‐10%) | 8 | ‐2.7 (‐59%) | ‐2.4 (‐10.6 ‐ 5.84) | no | ||
| VAS (0‐10) | 6 | 7 | +0.4 (7%) | 8 | ‐2.6 (‐34%) | ‐0.9 (‐2.30 ‐ 0.50) | no | ||
| Function | KPFS | 6 | 7 | +9.5 (15%) | 8 | +25.7 (44%) | 9.9 (‐2.32 ‐ 22.12) | no | |
| Ranawat scale | 6 | 7 | +6.3 (8%) | 8 | +20.6 (28%) | 9.7 (‐3.72 ‐ 23.12) | no | ||
| Satisfaction | VAS (0‐10) | 6 | 7 | 4.3 | 8 | 7.6 | 3.3 (0.32 ‐ 6.28)† | yes? | |
| VAS (0‐10) | 6 | 7 | 3.4 | 8 | 6.1 | 2.7 (0.24 ‐ 5.46) | no | ||
| Stiene 1996 | Function | Retro‐step | 8 | 12 | +1.8 (72%) | 11 | +15.4 (481%)* | 13.6† | yes |
| 52 | 12 | +4.2 (168%) | 11 | +24.1 (753%)* | 19.9† | yes | |||
| Gaffney 1992 | Pain | VAS (0‐10) | 6 | ? | ‐3.17 (55%)* | ? | ‐3.21 (53%)* | 0.04 | no |
| Function | N improved | 6 | 32 | 15 (47%)* | 28 | 18 (64%)* | RR = 1.37 | no | |
| Satisfaction | N treatment succes | 6 | 32 | 24 (75%)* | 28 | 25 (89%)* | RR = 1.19 | no | |
| Colòn 1988 | Pain | N improved > 50% | 6‐8 | 11 | 9 (82%)* | 14 | 13 (93%)* | RR = 1.13 | no |
| * = significant | VAS=Visual Analog Scale |
| Outcome or subgroup title | No. of studies | No. of participants | Statistical method | Effect size |
| 1 Pain, continuous data Show forest plot | 2 | Mean Difference (IV, Random, 95% CI) | Totals not selected | |
| 1.1 VAS: 1 month | 1 | Mean Difference (IV, Random, 95% CI) | 0.0 [0.0, 0.0] | |
| 1.2 VAS: 3 months | 1 | Mean Difference (IV, Random, 95% CI) | 0.0 [0.0, 0.0] | |
| 1.3 VAS: 12 months | 1 | Mean Difference (IV, Random, 95% CI) | 0.0 [0.0, 0.0] | |
| 2 Function, continuous data Show forest plot | 3 | Mean Difference (IV, Random, 95% CI) | Totals not selected | |
| 2.1 Cincinnatti overall activity level: 1 month, static exercise versus no exercise | 1 | Mean Difference (IV, Random, 95% CI) | 0.0 [0.0, 0.0] | |
| 2.2 Cincinnatti overall activity level: 1 month, isokinetic exercise versus no exercise | 1 | Mean Difference (IV, Random, 95% CI) | 0.0 [0.0, 0.0] | |
| 2.3 Kujala Patellofemoral Scale: 1 month | 1 | Mean Difference (IV, Random, 95% CI) | 0.0 [0.0, 0.0] | |
| 2.4 100 ‐ WOMAC = inversed WOMAC scale: 3 months | 1 | Mean Difference (IV, Random, 95% CI) | 0.0 [0.0, 0.0] | |
| 2.5 100 ‐ WOMAC = inversed WOMAC scale: 12 months | 1 | Mean Difference (IV, Random, 95% CI) | 0.0 [0.0, 0.0] | |
| 3 Recovery, dichotomous data Show forest plot | 1 | Risk Ratio (M‐H, Random, 95% CI) | Totals not selected | |
| 3.1 Number of patients discharged from therapy because of patient's satisfaction, 3 months | 1 | Risk Ratio (M‐H, Random, 95% CI) | 0.0 [0.0, 0.0] | |
| 3.2 Number of patients no longer troubled by symptoms, 12 months | 1 | Risk Ratio (M‐H, Random, 95% CI) | 0.0 [0.0, 0.0] | |
| 3.3 Number of patients discontinuing therapy after 12 months | 1 | Risk Ratio (M‐H, Random, 95% CI) | 0.0 [0.0, 0.0] | |
| Outcome or subgroup title | No. of studies | No. of participants | Statistical method | Effect size |
| 1 Pain, continuous data Show forest plot | 3 | Mean Difference (IV, Random, 95% CI) | Totals not selected | |
| 1.1 VAS: 6 weeks | 1 | Mean Difference (IV, Random, 95% CI) | 0.0 [0.0, 0.0] | |
| 1.2 VAS walking stairs: 6 weeks | 1 | Mean Difference (IV, Random, 95% CI) | 0.0 [0.0, 0.0] | |
| 1.3 VAS sitting with knees bent: 6 weeks | 1 | Mean Difference (IV, Random, 95% CI) | 0.0 [0.0, 0.0] | |
| 1.4 VAS bending knees: 6 weeks | 1 | Mean Difference (IV, Random, 95% CI) | 0.0 [0.0, 0.0] | |
| 1.5 VAS during triple jump test: 5 weeks | 1 | Mean Difference (IV, Random, 95% CI) | 0.0 [0.0, 0.0] | |
| 1.6 VAS during daily activity: 5 weeks | 1 | Mean Difference (IV, Random, 95% CI) | 0.0 [0.0, 0.0] | |
| 1.7 VAS during triple jump test: 3 months | 1 | Mean Difference (IV, Random, 95% CI) | 0.0 [0.0, 0.0] | |
| 1.8 VAS during daily activity: 3 months | 1 | Mean Difference (IV, Random, 95% CI) | 0.0 [0.0, 0.0] | |
| 2 Pain, dichotomous data Show forest plot | 1 | Risk Ratio (M‐H, Random, 95% CI) | Totals not selected | |
| 2.1 >50% improvement: 6‐8 weeks | 1 | Risk Ratio (M‐H, Random, 95% CI) | 0.0 [0.0, 0.0] | |
| 3 Function, continuous data Show forest plot | 3 | Mean Difference (IV, Random, 95% CI) | Totals not selected | |
| 3.1 Kujala Patellofemoral Scale: ± 6 weeks | 2 | Mean Difference (IV, Random, 95% CI) | 0.0 [0.0, 0.0] | |
| 3.2 Kujala Patellofemoral Scale: 3 months | 1 | Mean Difference (IV, Random, 95% CI) | 0.0 [0.0, 0.0] | |
| 3.3 Number of retro‐step repetitions until painful: 8 weeks | 1 | Mean Difference (IV, Random, 95% CI) | 0.0 [0.0, 0.0] | |
| 3.4 Number of retro‐step repetitions until painful: 1 year | 1 | Mean Difference (IV, Random, 95% CI) | 0.0 [0.0, 0.0] | |
| 4 Function, dichotomous data Show forest plot | 2 | Risk Ratio (M‐H, Random, 95% CI) | Totals not selected | |
| 4.1 Overall assessment of function ‐ number of patients improved: 6 weeks | 1 | Risk Ratio (M‐H, Random, 95% CI) | 0.0 [0.0, 0.0] | |
| 4.2 Asymptomatic patients in unilateral squat test: 5 weeks | 1 | Risk Ratio (M‐H, Random, 95% CI) | 0.0 [0.0, 0.0] | |
| 4.3 Asymptomatic patients in step up test: 5 weeks | 1 | Risk Ratio (M‐H, Random, 95% CI) | 0.0 [0.0, 0.0] | |
| 4.4 Asymptomatic patients in step down test: 5 weeks | 1 | Risk Ratio (M‐H, Random, 95% CI) | 0.0 [0.0, 0.0] | |
| 4.5 Asymptomatic patients in unilateral squat test: 3 months | 1 | Risk Ratio (M‐H, Random, 95% CI) | 0.0 [0.0, 0.0] | |
| 4.6 Asymptomatic patients in step up test: 3 months | 1 | Risk Ratio (M‐H, Random, 95% CI) | 0.0 [0.0, 0.0] | |
| 4.7 Asymptomatic patients in step down test: 3 months | 1 | Risk Ratio (M‐H, Random, 95% CI) | 0.0 [0.0, 0.0] | |
| 5 Function, categorical data Show forest plot | Other data | No numeric data | ||
| 5.1 Function Index Questionnaire: 6 months | Other data | No numeric data | ||
| 5.2 Function Index Questionnaire: 12 months | Other data | No numeric data | ||
| 6 Global assessment, 11‐point scale, continuous data Show forest plot | 1 | Mean Difference (IV, Random, 95% CI) | Totals not selected | |
| 6.1 Satisfaction with therapy: 6 weeks | 1 | Mean Difference (IV, Random, 95% CI) | 0.0 [0.0, 0.0] | |
| 6.2 Satisfaction with recovery: 6 weeks | 1 | Mean Difference (IV, Random, 95% CI) | 0.0 [0.0, 0.0] | |
| 7 Global assessments, dichotomous data Show forest plot | 1 | Risk Ratio (M‐H, Random, 95% CI) | Totals not selected | |
| 7.1 Treatment success: 6 weeks | 1 | Risk Ratio (M‐H, Random, 95% CI) | 0.0 [0.0, 0.0] | |