Scolaris Content Display Scolaris Content Display

Methodological quality graph: review authors' judgements about each methodological quality item presented as percentages across all included studies.
Figuras y tablas -
Figure 1

Methodological quality graph: review authors' judgements about each methodological quality item presented as percentages across all included studies.

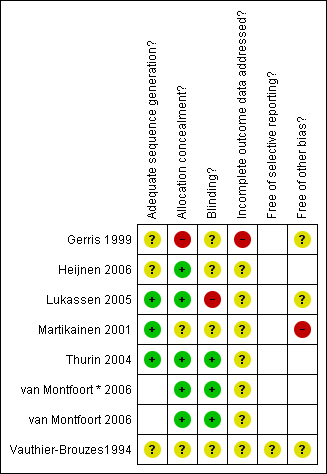
Methodological quality summary: review authors' judgements about each methodological quality item for each included study.
Figuras y tablas -
Figure 2

Methodological quality summary: review authors' judgements about each methodological quality item for each included study.

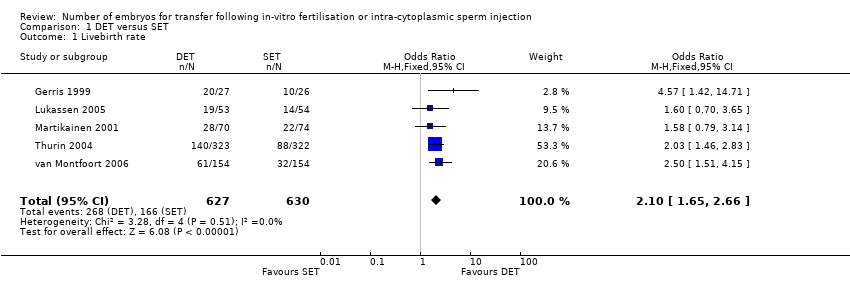
Comparison 1 DET versus SET, Outcome 1 Livebirth rate.
Figuras y tablas -
Analysis 1.1

Comparison 1 DET versus SET, Outcome 1 Livebirth rate.

Comparison 1 DET versus SET, Outcome 2 Clinical pregnancy rate.
Figuras y tablas -
Analysis 1.2

Comparison 1 DET versus SET, Outcome 2 Clinical pregnancy rate.

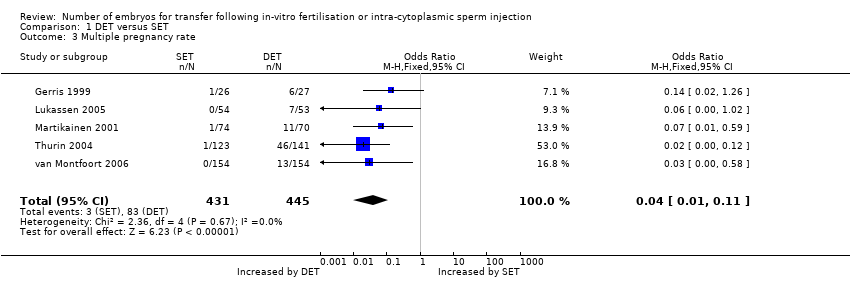
Comparison 1 DET versus SET, Outcome 3 Multiple pregnancy rate.
Figuras y tablas -
Analysis 1.3

Comparison 1 DET versus SET, Outcome 3 Multiple pregnancy rate.

Comparison 1 DET versus SET, Outcome 4 Miscarriage rate.
Figuras y tablas -
Analysis 1.4

Comparison 1 DET versus SET, Outcome 4 Miscarriage rate.

Comparison 2 DET versus SET plus1FZET, Outcome 1 Livebirth rate.
Figuras y tablas -
Analysis 2.1

Comparison 2 DET versus SET plus1FZET, Outcome 1 Livebirth rate.

Comparison 2 DET versus SET plus1FZET, Outcome 2 Clinical pregnancy rate.
Figuras y tablas -
Analysis 2.2

Comparison 2 DET versus SET plus1FZET, Outcome 2 Clinical pregnancy rate.

Comparison 2 DET versus SET plus1FZET, Outcome 3 Multiple pregnancy rate.
Figuras y tablas -
Analysis 2.3

Comparison 2 DET versus SET plus1FZET, Outcome 3 Multiple pregnancy rate.

Comparison 2 DET versus SET plus1FZET, Outcome 4 Cumulative livebirth rate.
Figuras y tablas -
Analysis 2.4

Comparison 2 DET versus SET plus1FZET, Outcome 4 Cumulative livebirth rate.

Comparison 3 DET versus two fresh cycles of SET, Outcome 1 Livebirth rate.
Figuras y tablas -
Analysis 3.1

Comparison 3 DET versus two fresh cycles of SET, Outcome 1 Livebirth rate.

Comparison 3 DET versus two fresh cycles of SET, Outcome 2 Clinical pregnancy rate.
Figuras y tablas -
Analysis 3.2

Comparison 3 DET versus two fresh cycles of SET, Outcome 2 Clinical pregnancy rate.

Comparison 3 DET versus two fresh cycles of SET, Outcome 3 Multiple pregnancy rate.
Figuras y tablas -
Analysis 3.3

Comparison 3 DET versus two fresh cycles of SET, Outcome 3 Multiple pregnancy rate.

Comparison 3 DET versus two fresh cycles of SET, Outcome 4 Miscarriage rate.
Figuras y tablas -
Analysis 3.4

Comparison 3 DET versus two fresh cycles of SET, Outcome 4 Miscarriage rate.

Comparison 3 DET versus two fresh cycles of SET, Outcome 5 Cumulative livebirth rate.
Figuras y tablas -
Analysis 3.5

Comparison 3 DET versus two fresh cycles of SET, Outcome 5 Cumulative livebirth rate.

Comparison 4 DET versus TET, Outcome 1 Live birth rate.
Figuras y tablas -
Analysis 4.1

Comparison 4 DET versus TET, Outcome 1 Live birth rate.

Comparison 4 DET versus TET, Outcome 2 Clinical pregnancy rate.
Figuras y tablas -
Analysis 4.2

Comparison 4 DET versus TET, Outcome 2 Clinical pregnancy rate.

Comparison 4 DET versus TET, Outcome 3 Multiple pregnancy rate.
Figuras y tablas -
Analysis 4.3

Comparison 4 DET versus TET, Outcome 3 Multiple pregnancy rate.

Comparison 4 DET versus TET, Outcome 4 Cumulative livebirth rate.
Figuras y tablas -
Analysis 4.4

Comparison 4 DET versus TET, Outcome 4 Cumulative livebirth rate.

Comparison 5 DET versus FET, Outcome 1 Livebirth rate.
Figuras y tablas -
Analysis 5.1

Comparison 5 DET versus FET, Outcome 1 Livebirth rate.

Comparison 5 DET versus FET, Outcome 2 Clinical pregnancy rate.
Figuras y tablas -
Analysis 5.2

Comparison 5 DET versus FET, Outcome 2 Clinical pregnancy rate.

Comparison 5 DET versus FET, Outcome 3 Multiple pregnancy rate.
Figuras y tablas -
Analysis 5.3

Comparison 5 DET versus FET, Outcome 3 Multiple pregnancy rate.

Table 1. Prognostic factors in included studies

Study ID

Age

Duration of inf

Previous failed cycle

Frozen cycles

Prim/Sec infertility

FSH

Quality of embryo

Gerris 1999

less than 34 years.

Average duration of infertility 3.5 years.

First IVF/ICSI cycle.

Not included

unclear

not mentioned

good

Heijnen 2007

38 ‐ 45 years

Average duration of infertility in DET group was 3.7(+/‐ 2.5) and in TET group was 3.2(+/‐ 2.4)

First cycle and previous successful cycle

Not included

yes

not mentioned

good

Lukassen 2005

<35 years

First IVF/ICSI cycle or after previous successful cycle .

Not included

yes

FSH < 10IU/L.

good

Martikainen 2001

various, no age criteria, ranged between 22‐40 years

not stated

women who had / not had more than one previous failed treatment.

Frozen cycles included

yes, but not mentioned

not mentioned

good

Thurin 2004

<36 years

0‐12 years

First or second IVF cycle

Frozen cycles included

yes

not mentioned

good, blastocysts included

van Montfoort 2006

Various ages, no criteria

SET‐ 3.3+/‐1.8, DET‐ 3.3+/‐ 2.1

First IVF cycle

Not included

yes

not mentioned

good

Vauthier‐Brouzes 1994

<=35 years

Not mentioned

First or previous successful cycle

Frozen cycles included

yes

not mentioned

good

Figuras y tablas -
Table 1. Prognostic factors in included studies
Comparison 1. DET versus SET

Outcome or subgroup title

No. of studies

No. of participants

Statistical method

Effect size

1 Livebirth rate Show forest plot

5

1257

Odds Ratio (M‐H, Fixed, 95% CI)

2.10 [1.65, 2.66]

2 Clinical pregnancy rate Show forest plot

5

1257

Odds Ratio (M‐H, Fixed, 95% CI)

2.21 [1.75, 2.79]

3 Multiple pregnancy rate Show forest plot

5

876

Odds Ratio (M‐H, Fixed, 95% CI)

0.04 [0.01, 0.11]

4 Miscarriage rate Show forest plot

3

1097

Odds Ratio (M‐H, Fixed, 95% CI)

1.18 [0.75, 1.86]

Figuras y tablas -
Comparison 1. DET versus SET
Comparison 2. DET versus SET plus1FZET

Outcome or subgroup title

No. of studies

No. of participants

Statistical method

Effect size

1 Livebirth rate Show forest plot

1

645

Odds Ratio (M‐H, Fixed, 95% CI)

1.24 [0.90, 1.70]

2 Clinical pregnancy rate Show forest plot

1

645

Odds Ratio (M‐H, Fixed, 95% CI)

0.78 [0.58, 1.07]

3 Multiple pregnancy rate Show forest plot

1

264

Odds Ratio (M‐H, Fixed, 95% CI)

0.02 [0.00, 0.12]

4 Cumulative livebirth rate Show forest plot

1

645

Odds Ratio (M‐H, Fixed, 95% CI)

0.81 [0.59, 1.11]

Figuras y tablas -
Comparison 2. DET versus SET plus1FZET
Comparison 3. DET versus two fresh cycles of SET

Outcome or subgroup title

No. of studies

No. of participants

Statistical method

Effect size

1 Livebirth rate Show forest plot

1

107

Odds Ratio (M‐H, Fixed, 95% CI)

1.23 [0.56, 2.69]

2 Clinical pregnancy rate Show forest plot

1

107

Odds Ratio (M‐H, Fixed, 95% CI)

1.4 [0.65, 3.00]

3 Multiple pregnancy rate Show forest plot

1

107

Odds Ratio (M‐H, Fixed, 95% CI)

0.06 [0.00, 1.02]

4 Miscarriage rate Show forest plot

1

107

Odds Ratio (M‐H, Fixed, 95% CI)

1.67 [0.51, 5.48]

5 Cumulative livebirth rate Show forest plot

1

107

Odds Ratio (M‐H, Fixed, 95% CI)

1.23 [0.56, 2.69]

Figuras y tablas -
Comparison 3. DET versus two fresh cycles of SET
Comparison 4. DET versus TET

Outcome or subgroup title

No. of studies

No. of participants

Statistical method

Effect size

1 Live birth rate Show forest plot

1

45

Odds Ratio (M‐H, Fixed, 95% CI)

0.4 [0.09, 1.85]

2 Clinical pregnancy rate Show forest plot

1

45

Odds Ratio (M‐H, Fixed, 95% CI)

1.17 [0.32, 4.25]

3 Multiple pregnancy rate Show forest plot

1

45

Odds Ratio (M‐H, Fixed, 95% CI)

0.17 [0.01, 3.85]

4 Cumulative livebirth rate Show forest plot

1

90

Odds Ratio (M‐H, Fixed, 95% CI)

0.77 [0.33, 1.81]

4.1 DET+DET versus TET+TET

1

45

Odds Ratio (M‐H, Fixed, 95% CI)

0.77 [0.22, 2.65]

4.2 DET+DET+DET versus TET+TET+TET

1

45

Odds Ratio (M‐H, Fixed, 95% CI)

0.77 [0.24, 2.52]

Figuras y tablas -
Comparison 4. DET versus TET
Comparison 5. DET versus FET

Outcome or subgroup title

No. of studies

No. of participants

Statistical method

Effect size

1 Livebirth rate Show forest plot

1

56

Odds Ratio (M‐H, Fixed, 95% CI)

0.35 [0.11, 1.05]

2 Clinical pregnancy rate Show forest plot

1

56

Odds Ratio (M‐H, Fixed, 95% CI)

0.75 [0.26, 2.16]

3 Multiple pregnancy rate Show forest plot

1

56

Odds Ratio (M‐H, Fixed, 95% CI)

0.44 [0.10, 1.97]

Figuras y tablas -
Comparison 5. DET versus FET