| 1 Participants receiving red blood cell transfusions Show forest plot | 30 | 3069 | Risk Ratio (M‐H, Fixed, 95% CI) | 0.67 [0.62, 0.73] |
|
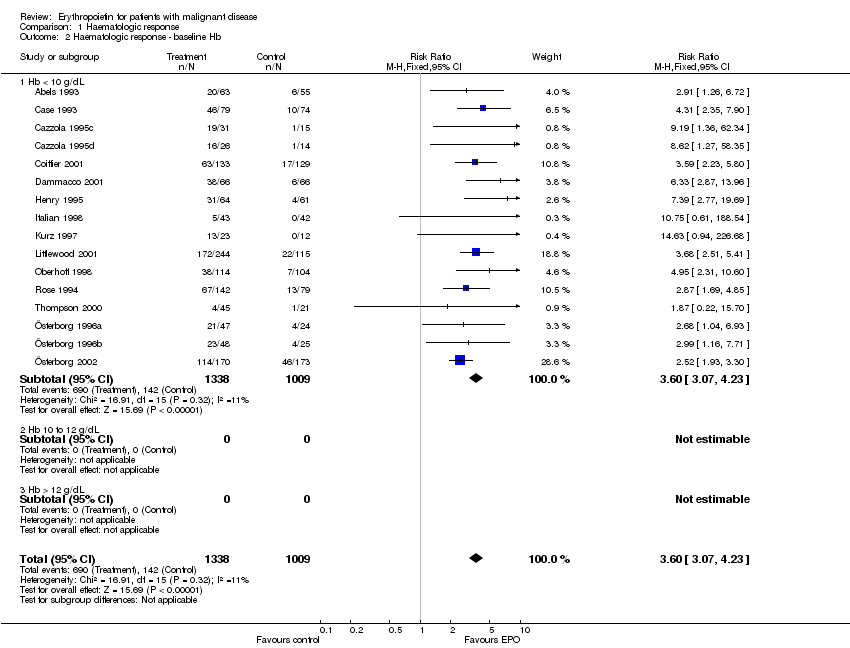
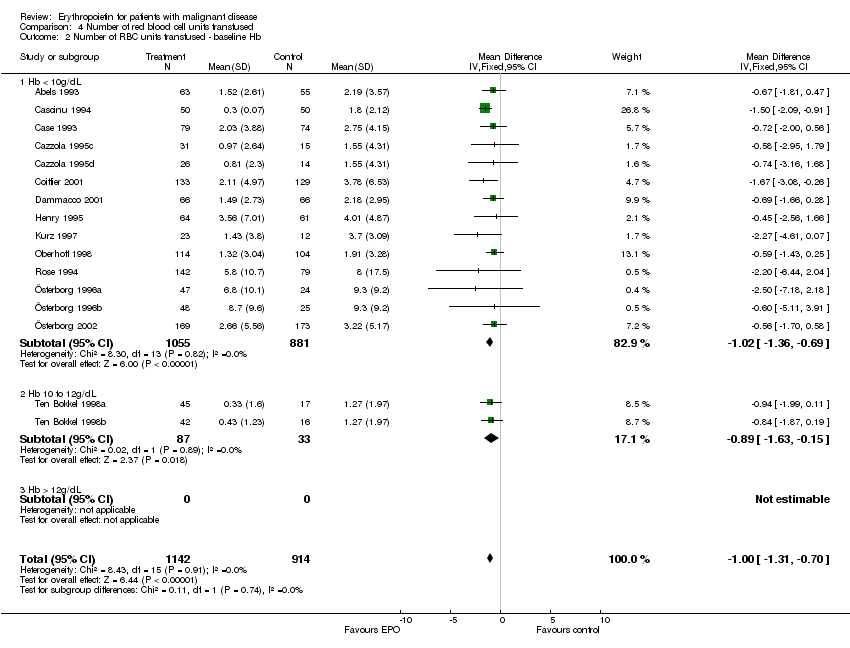
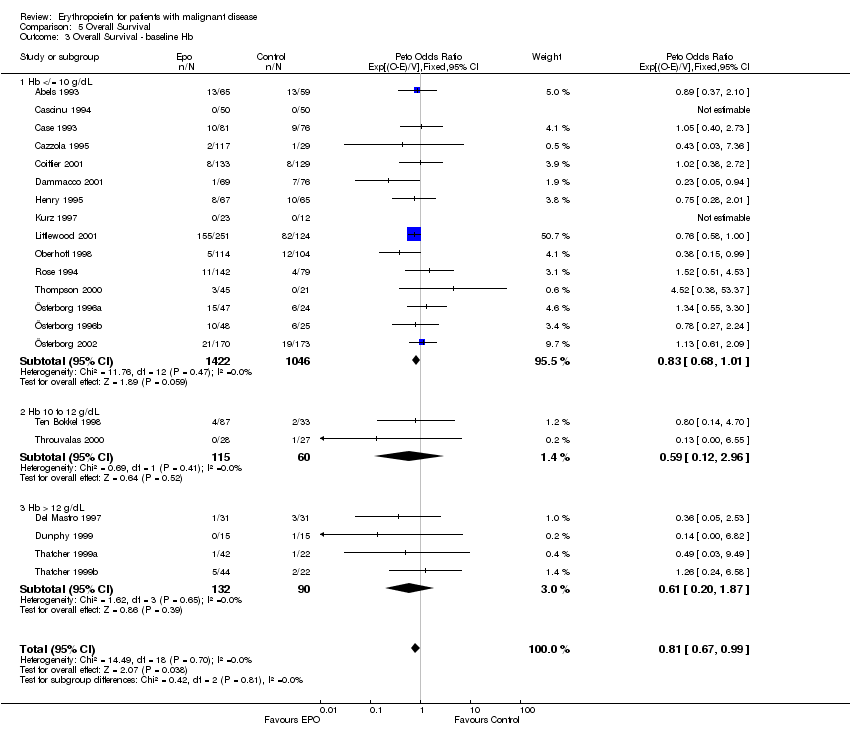
| 2 Participants receiving red blood cell transfusions ‐ baseline Hb Show forest plot | 30 | 3069 | Risk Ratio (M‐H, Fixed, 95% CI) | 0.67 [0.62, 0.73] |
|
| 2.1 Hb < 10 g/dL | 17 | 2475 | Risk Ratio (M‐H, Fixed, 95% CI) | 0.71 [0.66, 0.78] |
| 2.2 Hb 10 to 12 g/dL | 6 | 292 | Risk Ratio (M‐H, Fixed, 95% CI) | 0.33 [0.23, 0.47] |
| 2.3 Hb > 12 g/dL | 7 | 302 | Risk Ratio (M‐H, Fixed, 95% CI) | 0.56 [0.40, 0.80] |
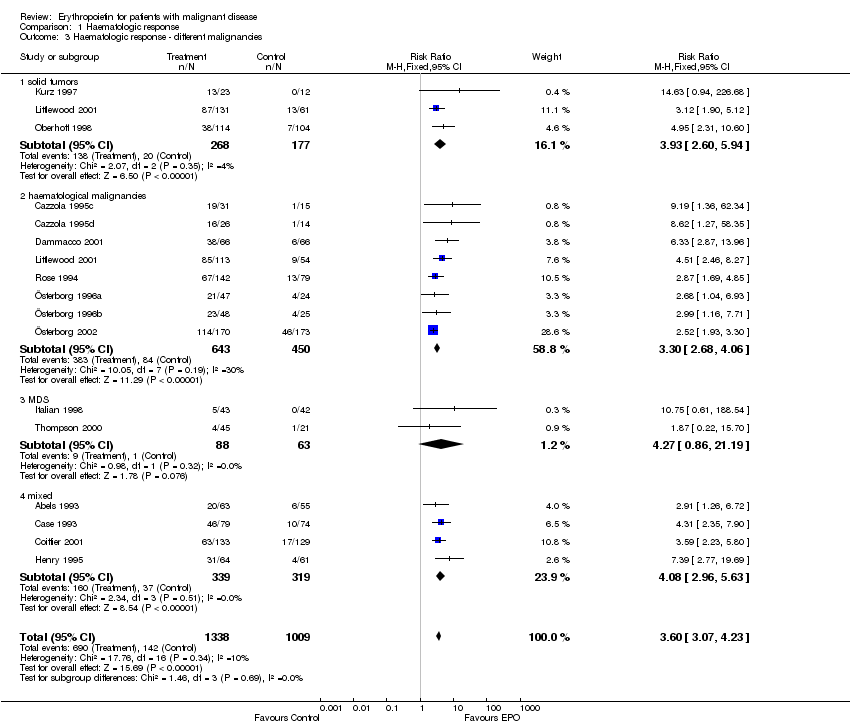
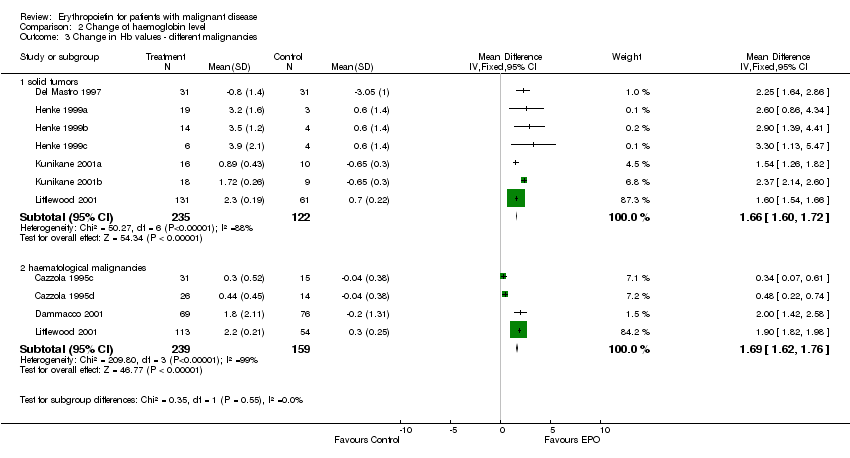
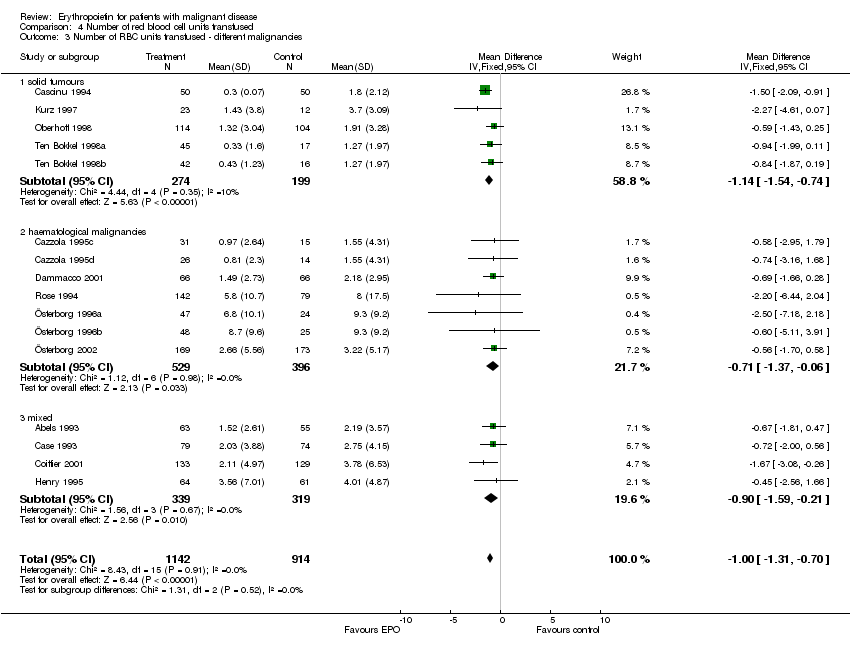
| 3 Participants receiving red blood cell transfusions ‐ different malignancies Show forest plot | 30 | 3069 | Risk Ratio (M‐H, Fixed, 95% CI) | 0.67 [0.62, 0.73] |
|
| 3.1 solid tumors | 16 | 1095 | Risk Ratio (M‐H, Fixed, 95% CI) | 0.49 [0.41, 0.59] |
| 3.3 haematological malignancies | 8 | 1111 | Risk Ratio (M‐H, Fixed, 95% CI) | 0.74 [0.66, 0.84] |
| 3.4 MDS | 2 | 151 | Risk Ratio (M‐H, Fixed, 95% CI) | 0.80 [0.68, 0.96] |
| 3.5 mixed | 5 | 712 | Risk Ratio (M‐H, Fixed, 95% CI) | 0.73 [0.62, 0.86] |
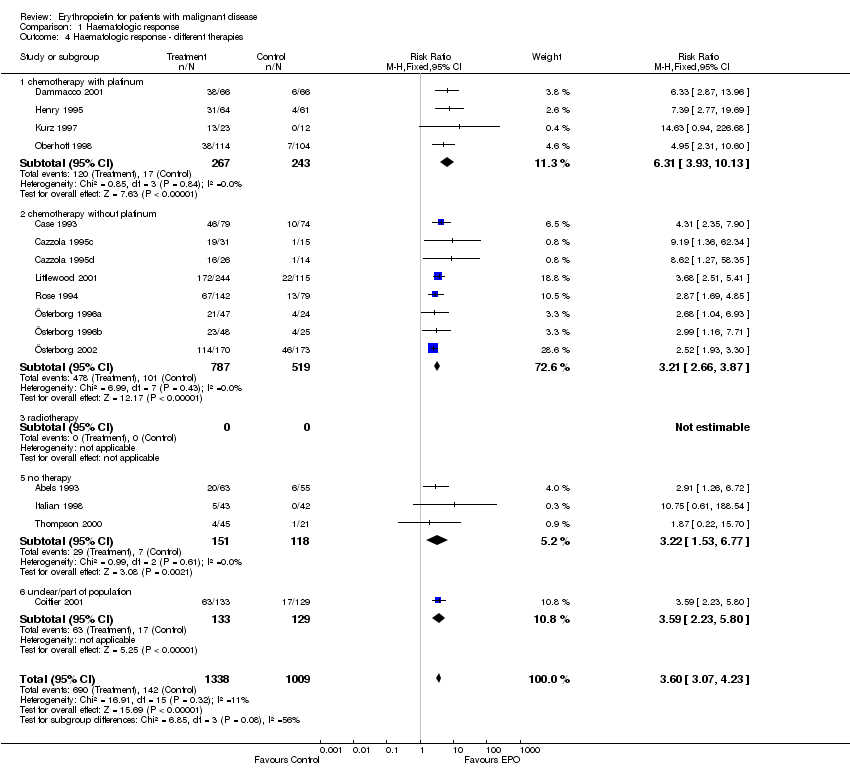
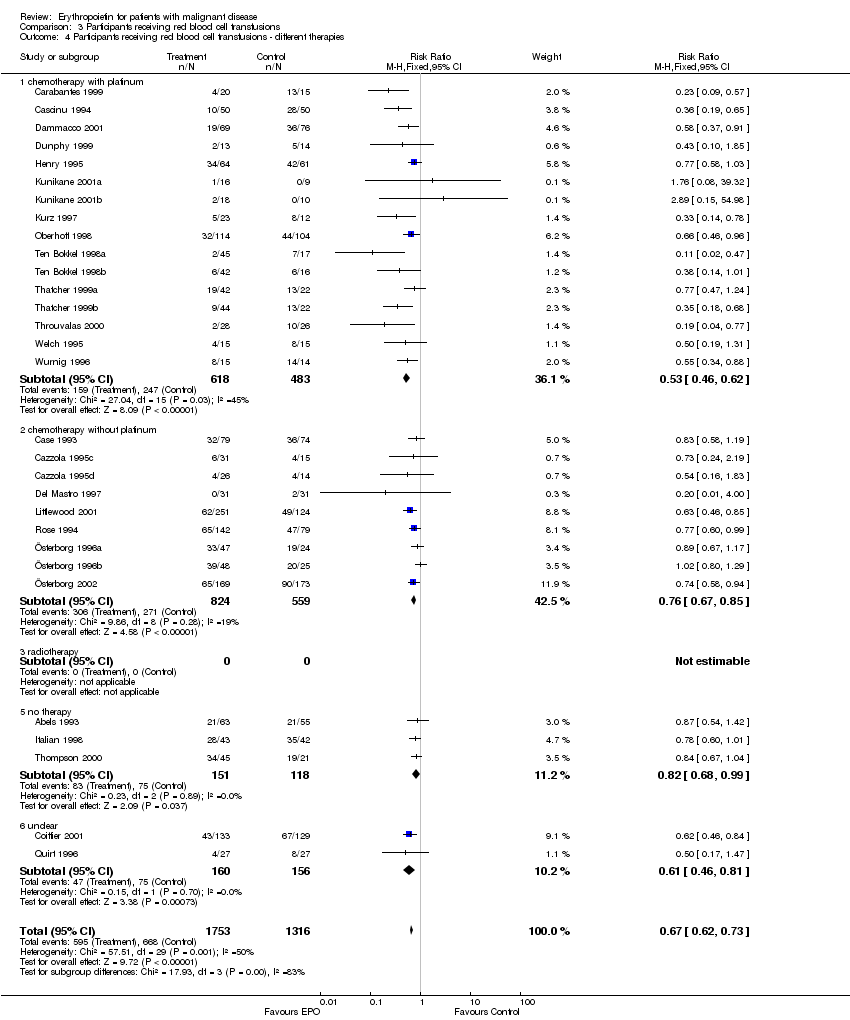
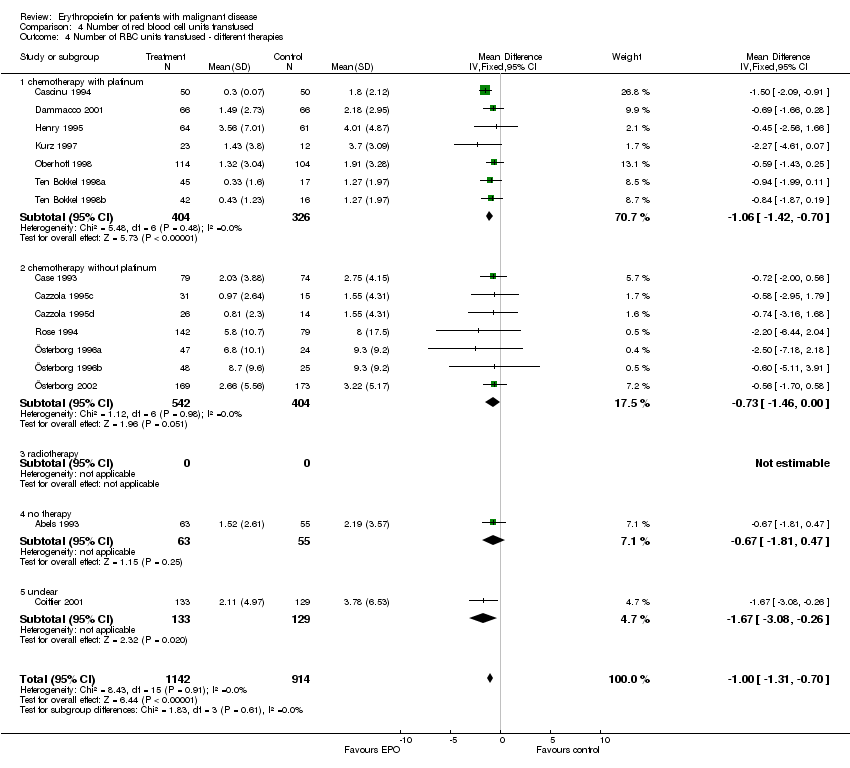
| 4 Participants receiving red blood cell transfusions ‐ different therapies Show forest plot | 30 | 3069 | Risk Ratio (M‐H, Fixed, 95% CI) | 0.67 [0.62, 0.73] |
|
| 4.1 chemotherapy with platinum | 16 | 1101 | Risk Ratio (M‐H, Fixed, 95% CI) | 0.53 [0.46, 0.62] |
| 4.2 chemotherapy without platinum | 9 | 1383 | Risk Ratio (M‐H, Fixed, 95% CI) | 0.76 [0.67, 0.85] |
| 4.3 radiotherapy | 0 | 0 | Risk Ratio (M‐H, Fixed, 95% CI) | 0.0 [0.0, 0.0] |
| 4.5 no therapy | 3 | 269 | Risk Ratio (M‐H, Fixed, 95% CI) | 0.82 [0.68, 0.99] |
| 4.6 unclear | 2 | 316 | Risk Ratio (M‐H, Fixed, 95% CI) | 0.61 [0.46, 0.81] |
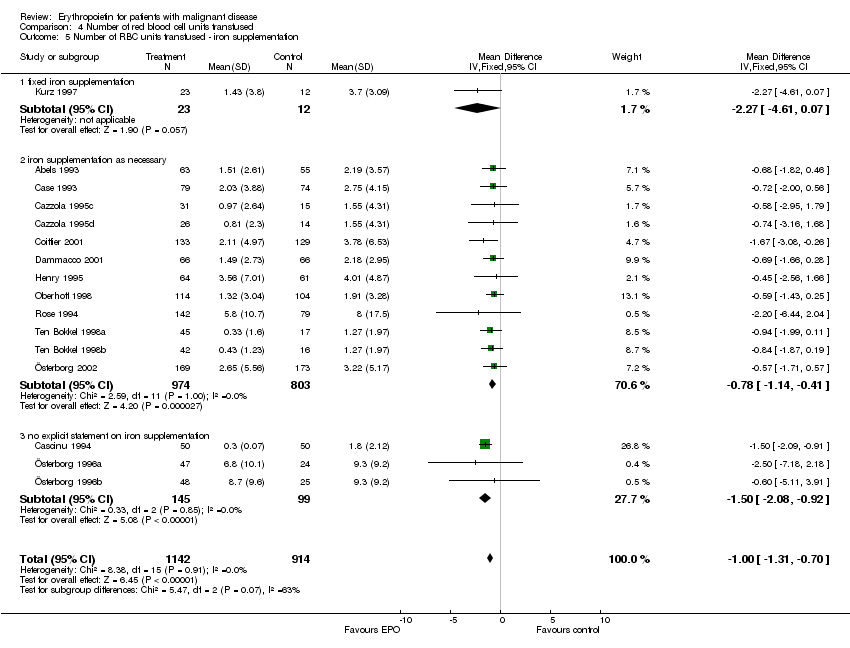
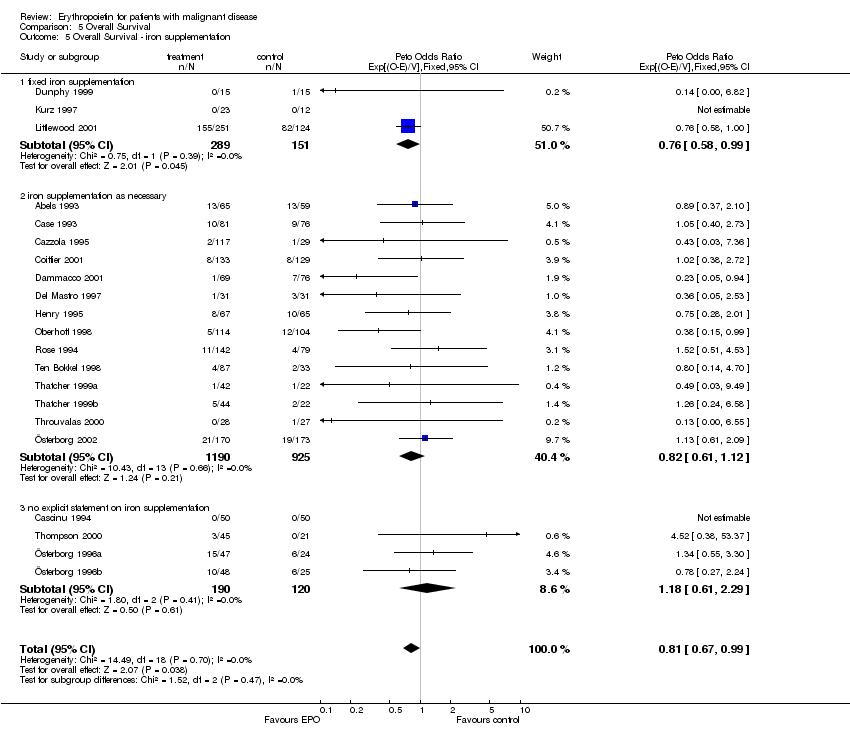
| 5 Participants receiving red blood cell transfusions ‐ iron supplementation Show forest plot | 30 | 3069 | Risk Ratio (M‐H, Fixed, 95% CI) | 0.67 [0.62, 0.73] |
|
| 5.1 fixed iron supplementation | 3 | 437 | Risk Ratio (M‐H, Fixed, 95% CI) | 0.57 [0.43, 0.76] |
| 5.2 iron supplementation as necessary | 18 | 2151 | Risk Ratio (M‐H, Fixed, 95% CI) | 0.68 [0.61, 0.75] |
| 5.3 no explicit statement on iron supplementation | 9 | 481 | Risk Ratio (M‐H, Fixed, 95% CI) | 0.69 [0.59, 0.80] |
| 6 Participants receiving red blood cell transfusions ‐ G‐CSF supplementation Show forest plot | 30 | 3069 | Risk Ratio (M‐H, Fixed, 95% CI) | 0.67 [0.62, 0.73] |
|
| 6.1 G‐CSF supplementation | 2 | 128 | Risk Ratio (M‐H, Fixed, 95% CI) | 0.78 [0.61, 0.99] |
| 6.2 no G‐CSF supplementation | 28 | 2941 | Risk Ratio (M‐H, Fixed, 95% CI) | 0.66 [0.61, 0.72] |
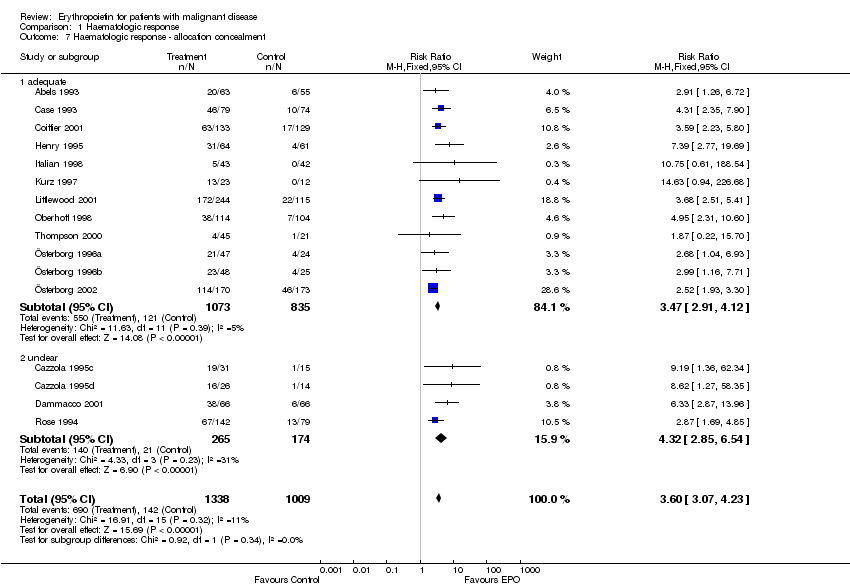
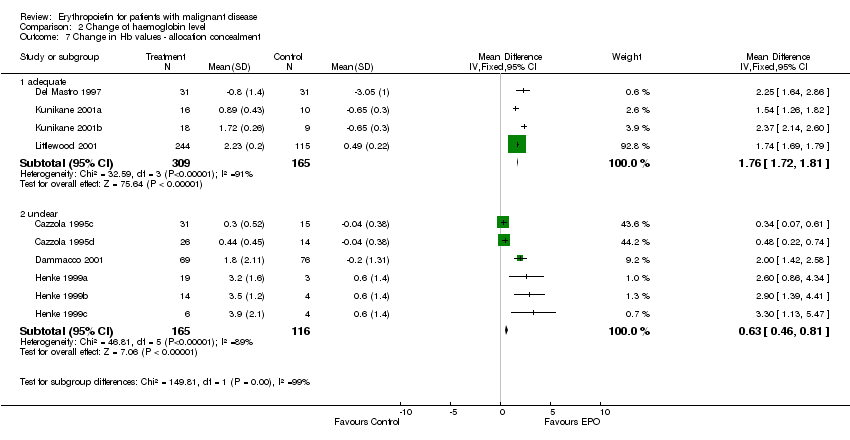
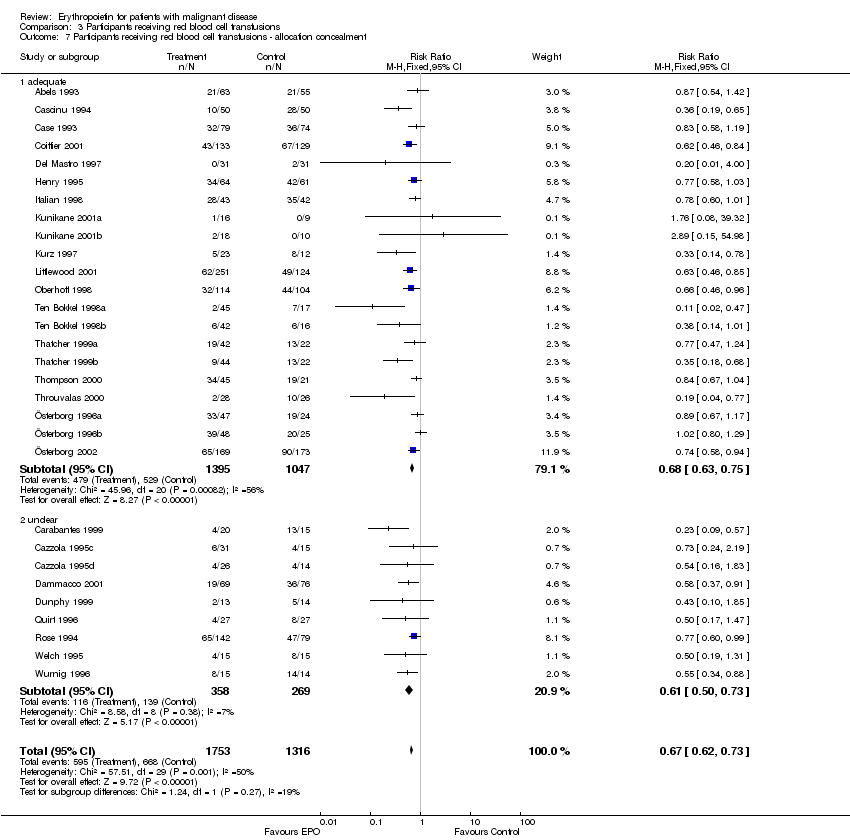
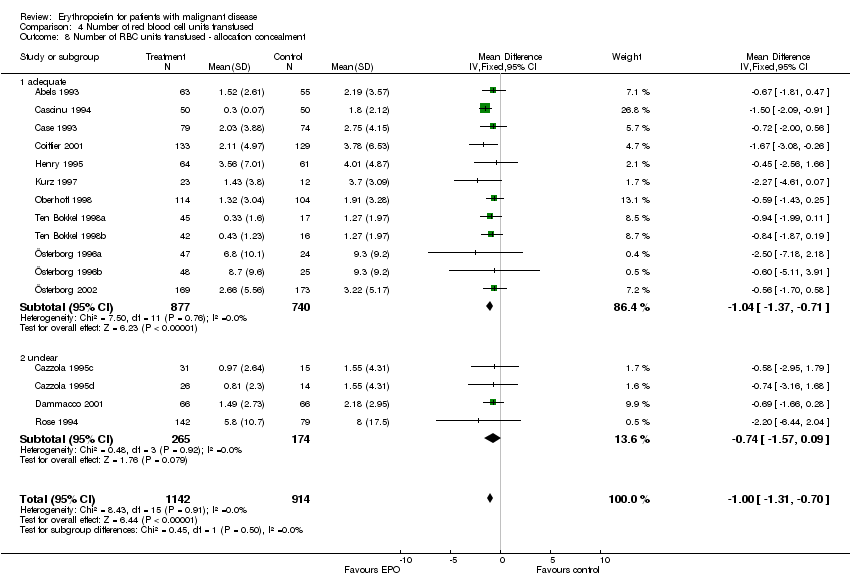
| 7 Participants receiving red blood cell transfusions ‐ allocation concealment Show forest plot | 30 | 3069 | Risk Ratio (M‐H, Fixed, 95% CI) | 0.67 [0.62, 0.73] |
|
| 7.1 adequate | 21 | 2442 | Risk Ratio (M‐H, Fixed, 95% CI) | 0.68 [0.63, 0.75] |
| 7.2 unclear | 9 | 627 | Risk Ratio (M‐H, Fixed, 95% CI) | 0.61 [0.50, 0.73] |
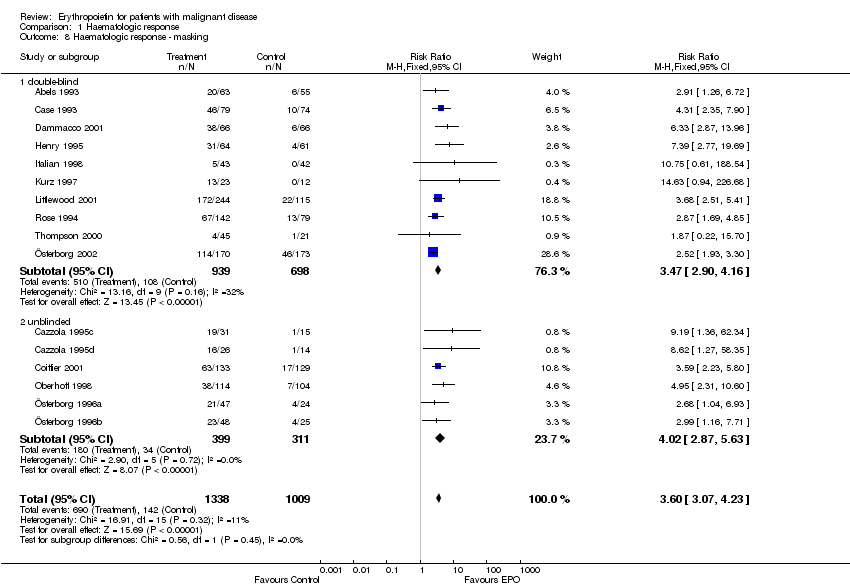
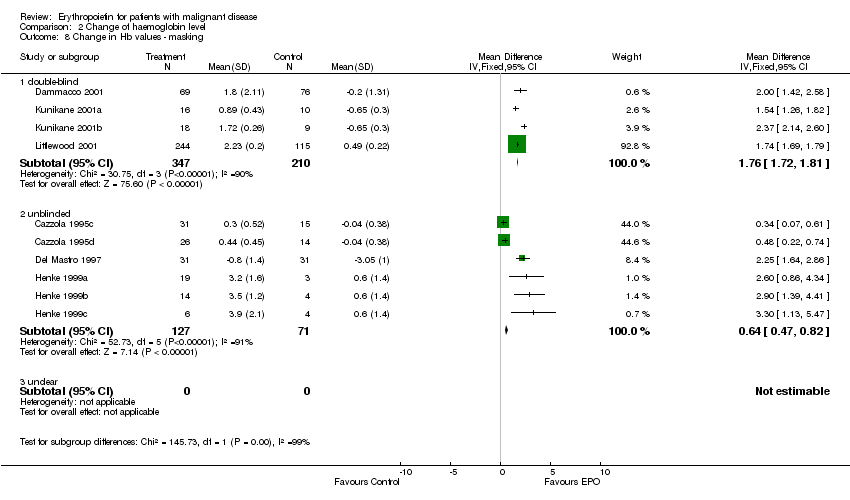
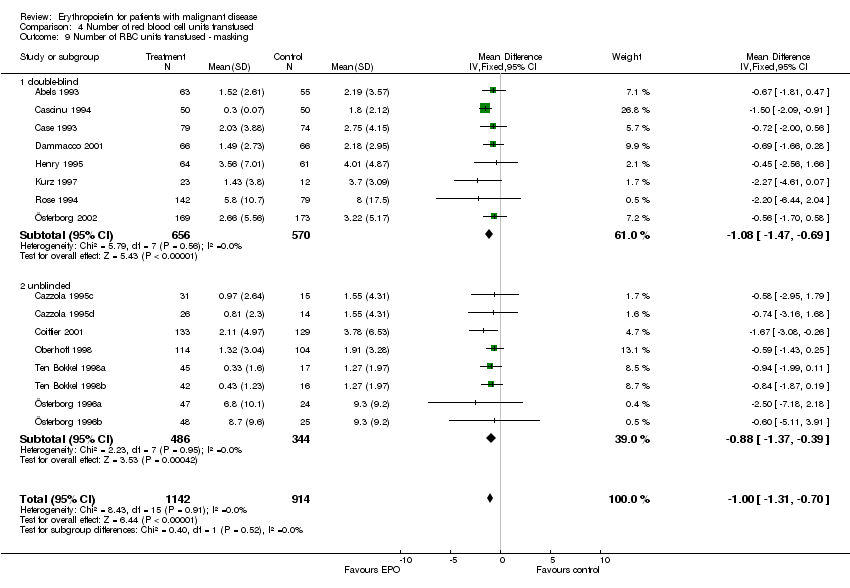
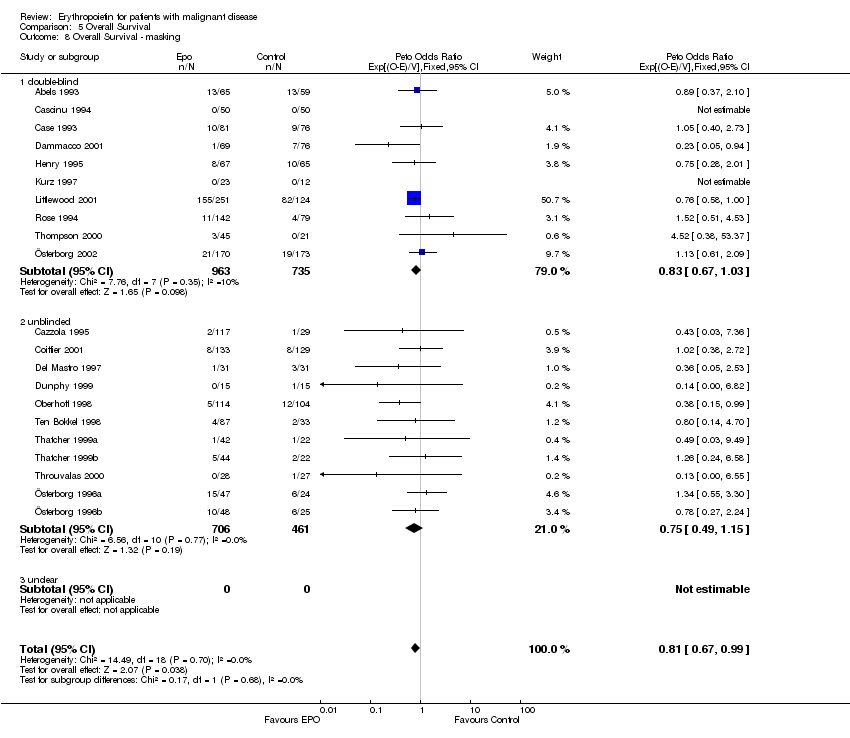
| 8 Participants receiving red blood cell transfusions ‐ masking Show forest plot | 30 | 3069 | Risk Ratio (M‐H, Fixed, 95% CI) | 0.67 [0.62, 0.73] |
|
| 8.1 double‐blind | 15 | 1901 | Risk Ratio (M‐H, Fixed, 95% CI) | 0.70 [0.64, 0.78] |
| 8.2 unblinded | 15 | 1168 | Risk Ratio (M‐H, Fixed, 95% CI) | 0.61 [0.53, 0.70] |
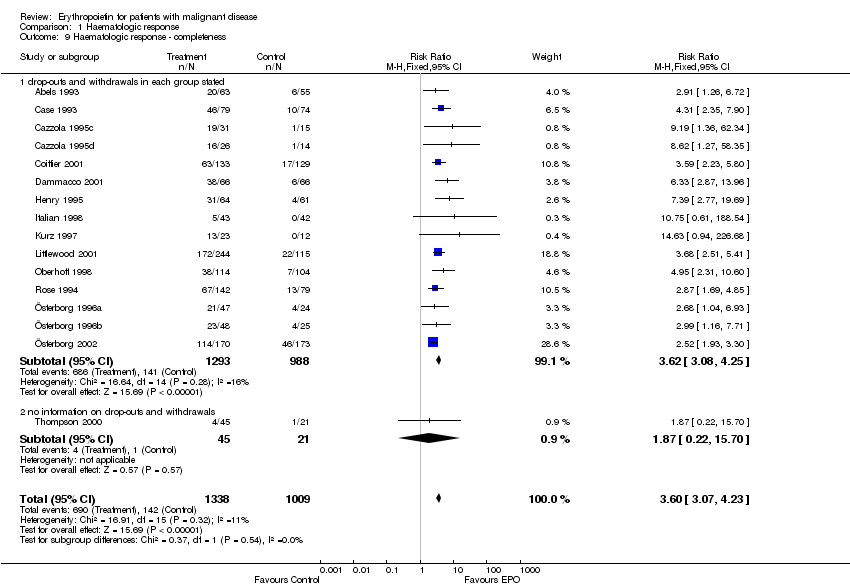
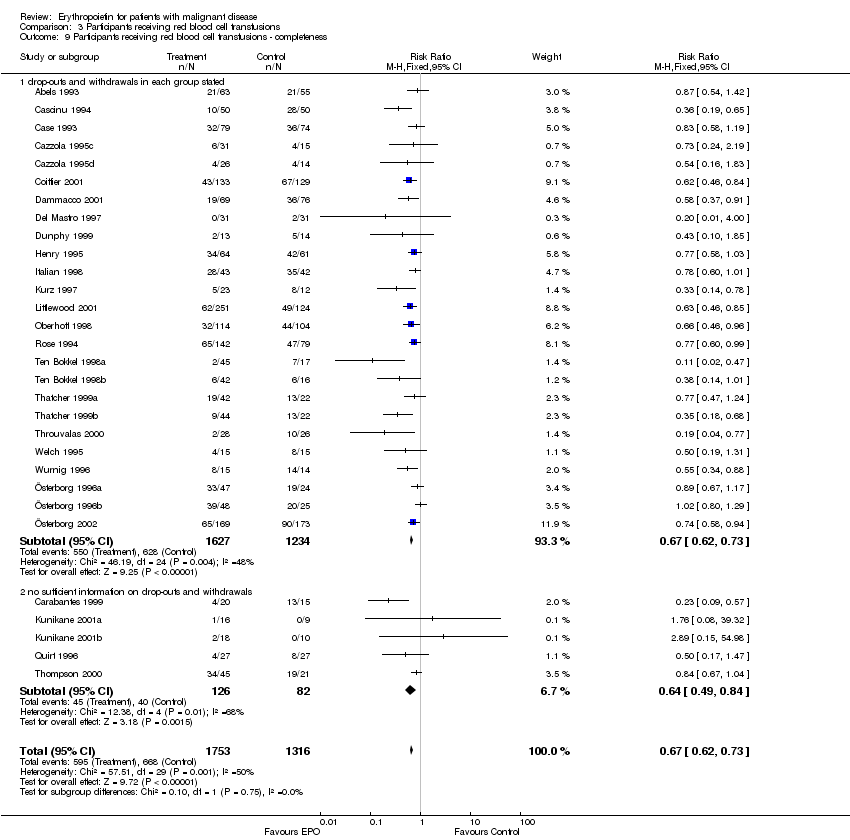
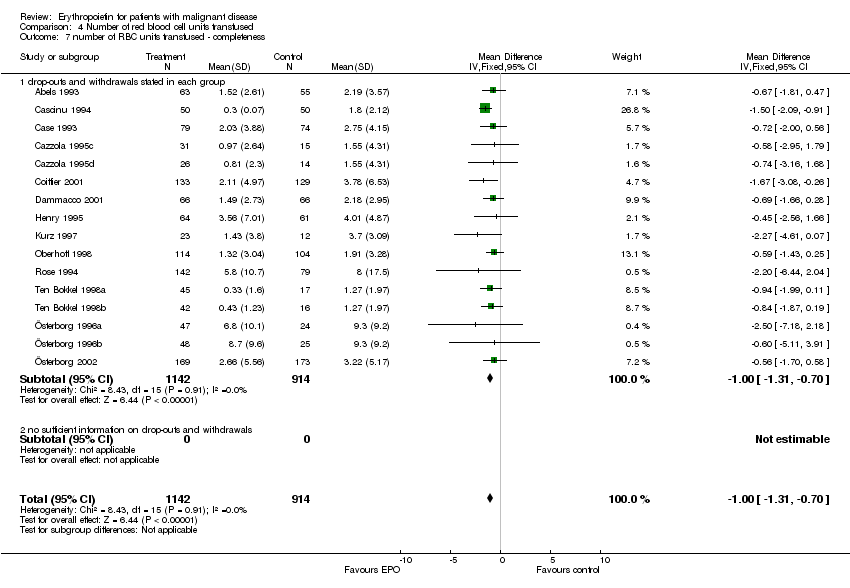
| 9 Participants receiving red blood cell transfusions ‐ completeness Show forest plot | 30 | 3069 | Risk Ratio (M‐H, Fixed, 95% CI) | 0.67 [0.62, 0.73] |
|
| 9.1 drop‐outs and withdrawals in each group stated | 25 | 2861 | Risk Ratio (M‐H, Fixed, 95% CI) | 0.67 [0.62, 0.73] |
| 9.2 no sufficient information on drop‐outs and withdrawals | 5 | 208 | Risk Ratio (M‐H, Fixed, 95% CI) | 0.64 [0.49, 0.84] |
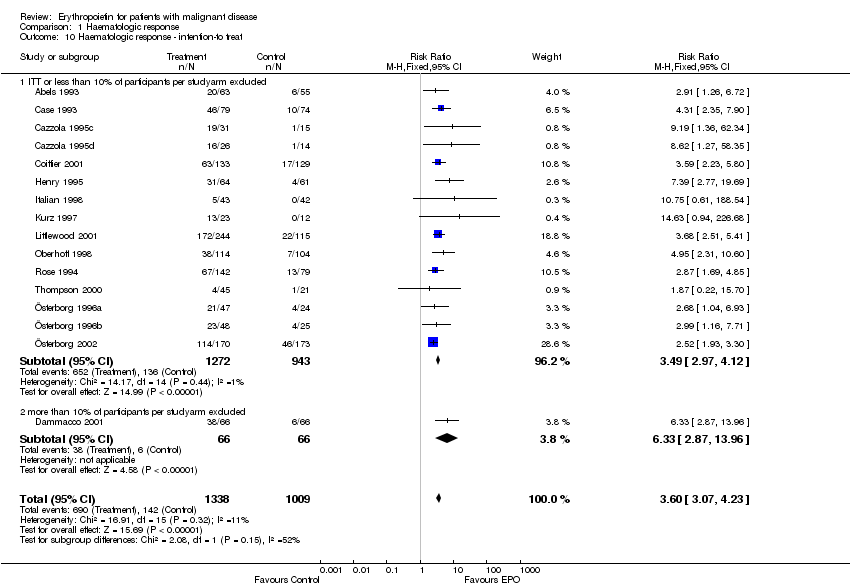
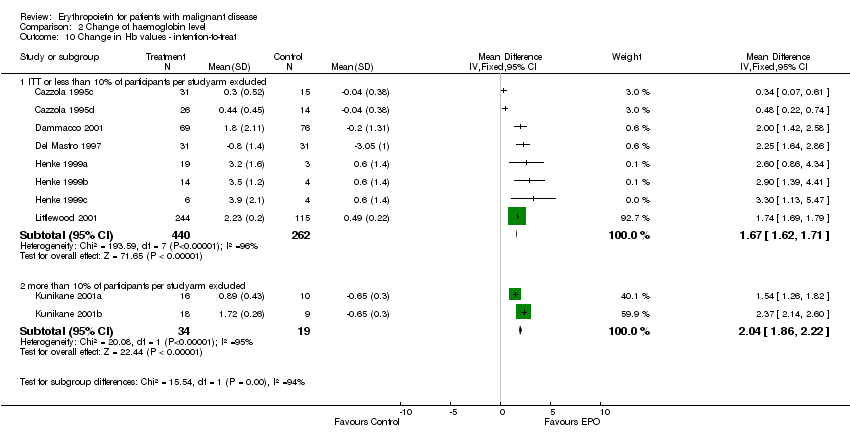
| 10 Participants receiving red blood cell transfusions ‐ intention‐to treat Show forest plot | 30 | 3069 | Risk Ratio (M‐H, Fixed, 95% CI) | 0.67 [0.62, 0.73] |
|
| 10.1 ITT or less than 10% of participants per studyarm excluded | 28 | 3016 | Risk Ratio (M‐H, Fixed, 95% CI) | 0.67 [0.61, 0.72] |
| 10.2 more than 10% of participants per studyarm excluded | 2 | 53 | Risk Ratio (M‐H, Fixed, 95% CI) | 2.33 [0.28, 19.54] |
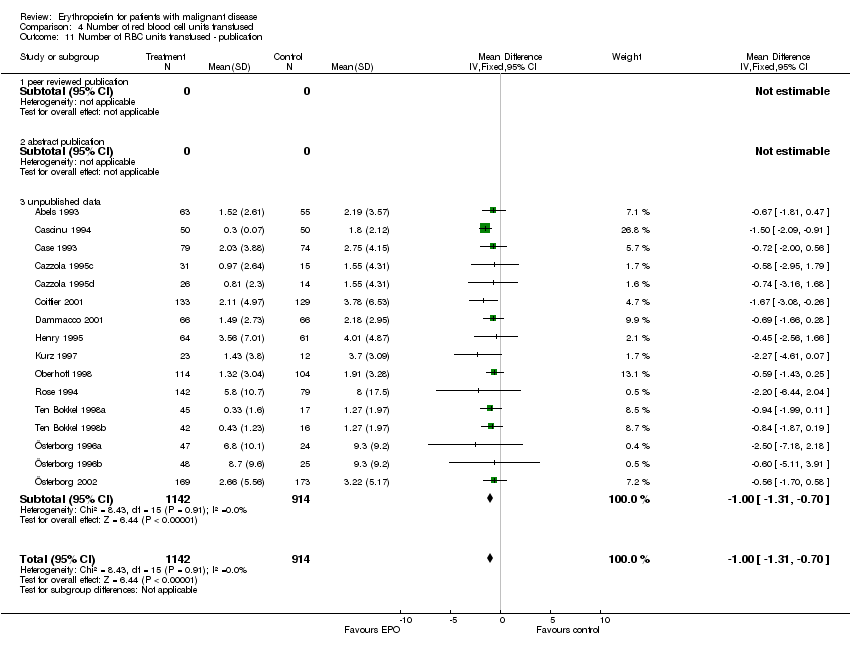
| 11 Participants receiving red blood cell transfusions ‐ publication Show forest plot | 30 | 3069 | Risk Ratio (M‐H, Fixed, 95% CI) | 0.67 [0.62, 0.73] |
|
| 11.1 fulltext publication | 18 | 1401 | Risk Ratio (M‐H, Fixed, 95% CI) | 0.63 [0.55, 0.72] |
| 11.2 abstract publication | 3 | 143 | Risk Ratio (M‐H, Fixed, 95% CI) | 0.28 [0.15, 0.52] |
| 11.3 unpublished data | 9 | 1525 | Risk Ratio (M‐H, Fixed, 95% CI) | 0.73 [0.66, 0.81] |
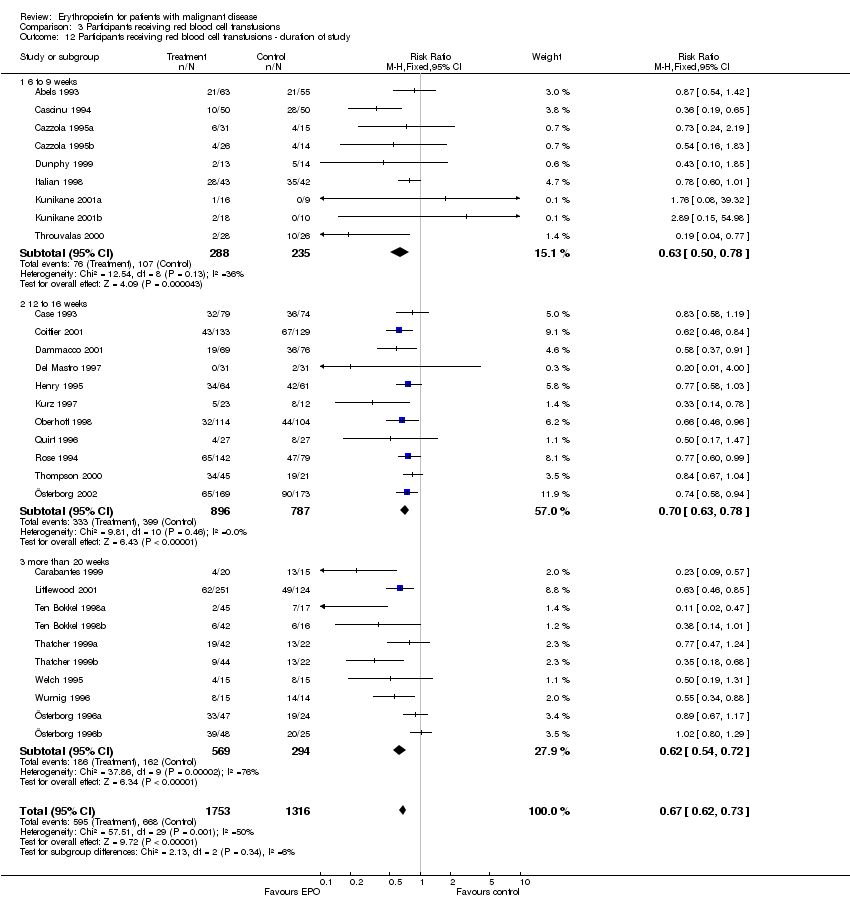
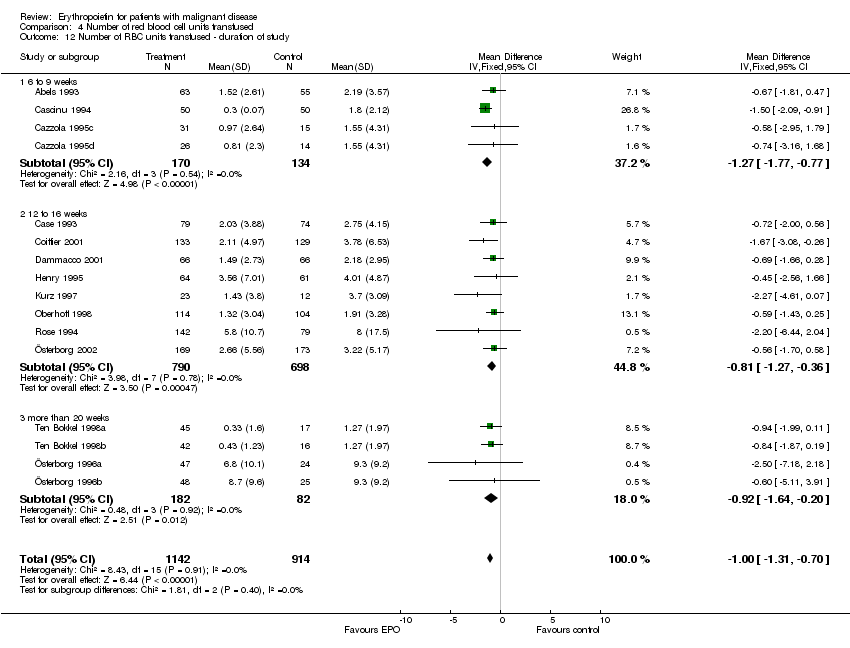
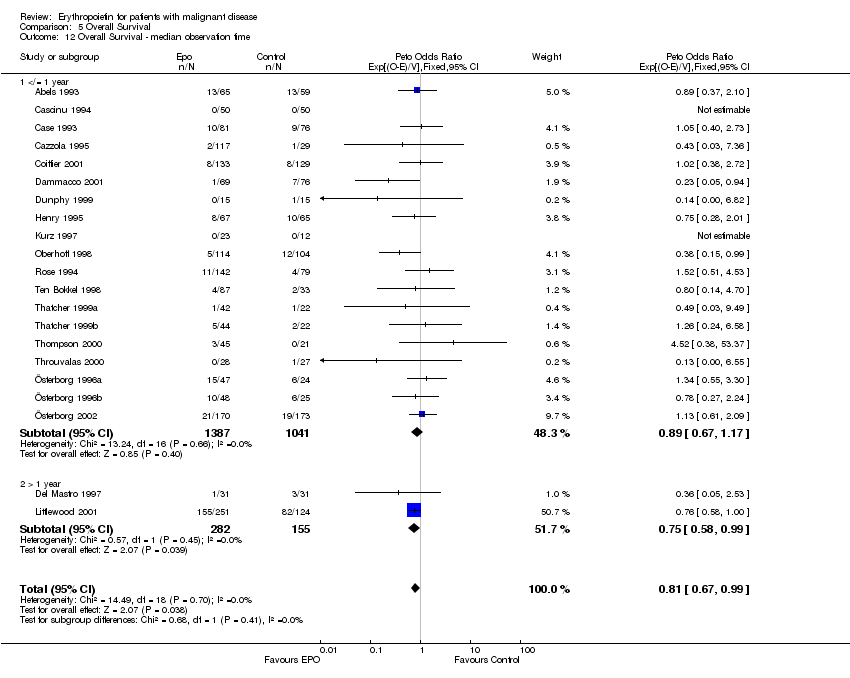
| 12 Participants receiving red blood cell transfusions ‐ duration of study Show forest plot | 30 | 3069 | Risk Ratio (M‐H, Fixed, 95% CI) | 0.67 [0.62, 0.73] |
|
| 12.1 6 to 9 weeks | 9 | 523 | Risk Ratio (M‐H, Fixed, 95% CI) | 0.63 [0.50, 0.78] |
| 12.2 12 to 16 weeks | 11 | 1683 | Risk Ratio (M‐H, Fixed, 95% CI) | 0.70 [0.63, 0.78] |
| 12.3 more than 20 weeks | 10 | 863 | Risk Ratio (M‐H, Fixed, 95% CI) | 0.62 [0.54, 0.72] |
| 13 Participants receiving red blood cell transfusions ‐ including/excluding the first 4 weeks ‐ version 1 Show forest plot | 30 | | Risk Ratio (M‐H, Fixed, 95% CI) | Subtotals only |
|
| 13.1 first 4 weeks included | 28 | 2549 | Risk Ratio (M‐H, Fixed, 95% CI) | 0.68 [0.62, 0.74] |
| 13.2 first 4 weeks excluded | 13 | 1858 | Risk Ratio (M‐H, Fixed, 95% CI) | 0.59 [0.52, 0.67] |
| 13.3 the first 4 weeks | 12 | 298 | Risk Ratio (M‐H, Fixed, 95% CI) | 0.97 [0.70, 1.33] |
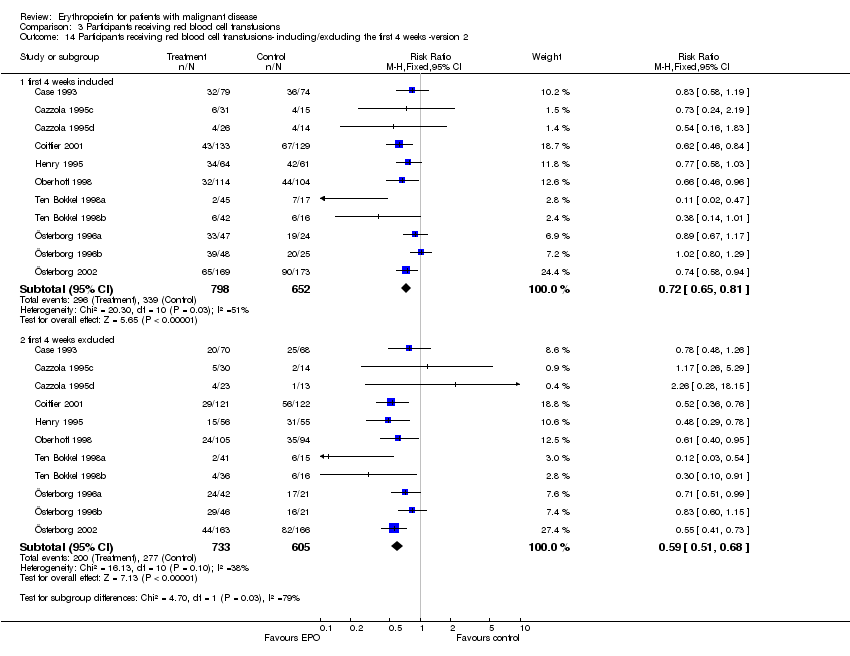
| 14 Participants receiving red blood cell transfusions‐ including/excluding the first 4 weeks ‐version 2 Show forest plot | 11 | | Risk Ratio (M‐H, Fixed, 95% CI) | Subtotals only |
|
| 14.1 first 4 weeks included | 11 | 1450 | Risk Ratio (M‐H, Fixed, 95% CI) | 0.72 [0.65, 0.81] |
| 14.2 first 4 weeks excluded | 11 | 1338 | Risk Ratio (M‐H, Fixed, 95% CI) | 0.59 [0.51, 0.68] |