Estrategias para el tratamiento de la disfunción sexual inducida por la medicación antidepresiva
Appendices
Appendix 1. CCDANCTR‐References Register
| Sexual dysfunction | ||
| 1. | Free‐text: | ((sex* and (disorder* or disturb* or dysfunction* or function or “side effect*” or “adverse effect*” or “adverse event*”)) or (sex* and (desire or thoughts or excitement)) or arous* or ejaculat* or erectile or erection* or impoten* or orgasm* or anorgasm* or hyperorgasm* or libido or hyposexual* or psychosexual) |
| Antidepressants | ||
| 2. | Free‐text: | (antidepress* or anti‐depress* or “anti depress*” or MAOI* or “monoamine oxidase inhibit*” or ((serotonin or norepinephrine or noradrenaline or neurotransmitt* or dopamine*) and (uptake or reuptake or re‐uptake)) or SSRI* or SNRI* or TCA* or tricyclic* or tetracyclic* or heterocyclic* or pharmacotherap*) |
| 3. | Free‐text: | (Agomelatine or Alnespirone or Amoxapine or Amfebutamone or Amiflamine or Amineptine or Amitriptylin* or Amitriptylinoxide or Amoxapine or Aripiprazole or Atomoxetine or Tomoxetine or Befloxatone or Benactyzine or Binospirone or Brofaromine or Bupropion or Butriptylin* or Cianopramine or Cilobamine or Cimoxatone or Citalopram or (Chlorimipramin* or Clomipramin* or Chlomipramin* or Clorimipramine) or Clorgyline or Clovoxamine or (CX157 or Tyrima) or Dapoxetine or Deanol or Dibenzepin or Demexiptilin* or Deprenyl or Desipramine or Desvenlafaxine or Dibenzepin or Dimetacrin* or (Dosulepin or Dothiepin) or Doxepin or Duloxetine or DVS‐233 or Enilospirone or Eptapirone or Escitalopram or Etoperidone or Femoxetine or Fluotracen or Fluoxetine or Furazolidone or Fluvoxamine or Harmaline or Harmine or Hyperforin or (Hypericum or (John* and Wort) or “WS 5570” or “WS 5572” or “LI 160” or LoHyp‐57) or Idazoxan or Imipramin* or Iprindole or Iproniazid* or Ipsapirone or Imipraminoxide or Isocarboxazid* or Lesopitron or Levomilnacipran or Lithium or Lofepramin* or (“Lu AA21004” or Vortioxetine) or “Lu AA24530” or LY2216684 or Maprotiline or Medifoxamine or Melitracen or Metapramine or Methylphenidate or Mianserin or Milnacipran or Minaprine or Mirtazapine or Moclobemide or Nefazodone or Nialamide or Nitroxazepine or Nomifensine or Nortriptyline or Noxiptilin* or Opipramol or Paroxetine or Phenelzine or Pipofezin* or Piribedil or Pirlindole or Pivagabine or Pizotyline or Propizepine or (Protriptylin* or Pertofrane) or Quinupramine or Quipazine or Reboxetine or Ritanserin or Rolipram or Scopolamine or Selegiline or Sertraline or (Setiptiline or Teciptiline) or Tandospirone or Tetrindole or Thiazesim or Thozalinone or Tianeptin* or Toloxatone or Tranylcypromine or Trazodone or Trimipramine or 5‐Hydroxytryptophan or 5‐HT or Tryptophan or Hydroxytryptophan or Venlafaxine or Viloxazine or Vilazodone or Viqualine or Zalospirone or Zimeldine) |
| 4. | Free‐text: | (Alaproclate or Caroxazone or Diclofensine or Fenfluramine or Fluparoxan or Norfenfluramine or Pheniprazine) |
| 5. | Keywords: | (depress* and “drug therap*”) |
| 6. |
| or/2‐5 |
| 7. |
| (1 and 6) |
Appendix 2. CENTRAL, CINAHL, EMBASE, MEDLINE, PsycINFO: original search strategy
The Cochrane Central Register of Controlled Trials (CENTRAL Issue 2, 2004) was searched using the following search terms:
#1(sexual* and dysfunction*)
#2 psychosexual
#3 orgasm*
#4 impoten*
#5 erecti*
#6 priapism
#7 libido
#8 frigid*
#9 vaginism*
#10 lubricat*
#11 dyspareun*
#12 anorgasm*
#13 hyperorgasm*
#14 (hypoactive and (sexual and desire)
#15 (sexual* and unresponsive*)
#16 (#1 or #2 or #3 or #4 or #5 or #6 or #7 or #8 or #9 or #10 or #11 or #12 or #13 or #14 or #15 )
#17 sr‐depressn
#18 (#16 not #17).
CINAHL (1982‐March Week 4 2004) was searched with the following terms:
1 exp Dyspareunia/
2 exp Penile erection/
3 exp orgasm/
4 priap$.mp. [mp=title, cinahl subject heading, abstract,
instrumentation]
5 lubricat$.mp. [mp=title, cinahl subject heading, abstract,
instrumentation]
6 (sexual adj dysfunct$).mp. [mp=title, cinahl subject
heading, abstract, instrumentation]
7 (sexual adj problem$).mp. [mp=title, cinahl subject
heading, abstract, instrumentation]
8 (sexual adj arousal).mp. [mp=title, cinahl subject heading,
abstract, instrumentation]
9 (sexual adj satisf$).mp. [mp=title, cinahl subject heading,
abstract, instrumentation]
10 1 or 2 or 3 or 4 or 5 or 6 or 7 or 8 or 9
11 exp Sexual dysfunction/
12 exp Impotence/
13 11 or 12
14 10 not 13
EMBASE (1980‐2004 Week 13) was searched with the following terms:
1 exp controlled study/
2 exp clinical trial/
3 exp major clinical study/
4 exp randomized controlled trial/
5 exp double blind procedure/
6 exp clinical article/
7 random$.mp.
8 trial$.mp.
9 study.mp.
10 studi$.mp.
11 compar$.mp.
12 control$.mp.
13 follow$.mp.
14 placebo$.mp.
15 ((dingl$ or doubl$ or trebl$ or tripl$) adj25 (blind$ or
mask$ or dummy)).mp. [mp=title, abstract, heading word,
trade name, manufacturer name]
16 1 or 2 or 3 or 4 or 5 or 6 or 7 or 8 or 9 or 10 or 11 or 12
or 13 or 14 or 15
17 (animal or non‐human).mp.
18 human.mp.
19 17 not 18
20 16 not 19
21 exp Dyspareunia/
22 exp Priapism/
23 exp Libido/
24 exp orgasm/
25 exp penis erection/
26 lubricat$.mp. [mp=title, abstract, heading word, trade
name, manufacturer name]
27 (sexual adj dysfunct$).mp. [mp=title, abstract, heading
word, trade name, manufacturer name]
28 (sexual adj problem$).mp. [mp=title, abstract, heading
word, trade name, manufacturer name]
29 (sexual adj arousal).mp. [mp=title, abstract, heading word,
trade name, manufacturer name]
30 (sexual adj satisf$).mp. [mp=title, abstract, heading word,
trade name, manufacturer name]
31 21 or 22 or 23 or 24 or 25 or 26 or 27 or 28 or 29 or 30
32 exp Sexual dysfunction/
33 exp Impotence/
34 32 or 33
35 31 not 34
36 20 and 35
Medline (1966‐June Week 4 2004) was searched with the following terms:
1 exp Dyspareunia/
2 exp Priapism/
3 libido.mp. [mp=title, abstract, registry number word, mesh
subject heading]
4 orgasm$.mp. [mp=title, abstract, registry number word, mesh
subject heading]
5 erecti$.mp. [mp=title, abstract, registry number word, mesh
subject heading]
6 lubricat$.mp. [mp=title, abstract, registry number word,
mesh subject heading]
7 (sexual adj dysfunct$).mp. [mp=title, abstract, registry
number word, mesh subject heading]
8 (sexual adj problem$).mp. [mp=title, abstract, registry
number word, mesh subject heading]
9 (sexual adj arousal).mp. [mp=title, abstract, registry
number word, mesh subject heading]
10 (sexual adj satisf$).mp. [mp=title, abstract, registry
number word, mesh subject heading]
11 1 or 2 or 3 or 4 or 5 or 6 or 7 or 8 or 9 or 10
12 exp impotence/ or exp sexual dysfunctions, psychological/
13 11 not 10
14 11 not 12
15 exp Sex disorders/
16 11 or 15
17 16 not 12
18 ("randomized controlled trial" or "controlled clinical
trial").pt.
19 17 and 18
PsycINFO (1984‐ March Week 4 2004) was searched with the following terms:
1 exp dyspareunia/
2 exp libido/
3 exp orgasm/
4 exp "erection (penis)"/
5 lubricat$.mp. [mp=title, abstract, heading word, table of
contents, key phrase identifiers]
6 (sexual adj dysfunct$).mp. [mp=title, abstract, heading
word, table of contents, key phrase identifiers]
7 (sexual adj problem$).mp. [mp=title, abstract, heading
word, table of contents, key phrase identifiers]
8 (sexual adj arousal).mp. [mp=title, abstract, heading word,
table of contents, key phrase identifiers]
9 (sexual adj satisf$).mp. [mp=title, abstract, heading word,
table of contents, key phrase identifiers]
10 1 or 2 or 3 or 4 or 5 or 6 or 7 or 8 or 9
11 exp impotence/
12 10 not 11

Study flow diagram
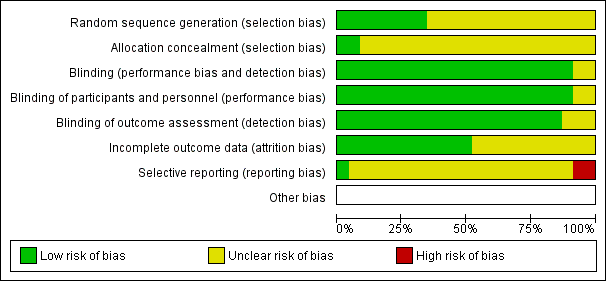
Risk of bias graph: review authors' judgements about each risk of bias item presented as percentages across all included studies.

Risk of bias summary: review authors' judgements about each risk of bias item for each included study.

Forest plot of comparison 1: sildenafil vs placebo, outcome: 1.1 endpoint International Index of Erectile Function (IIEF) scores

Forest plot of comparison 1: sildenafil vs placebo, outcome: 1.5 endpoint Arizona Sexual Experience Scale (ASEX) total scores
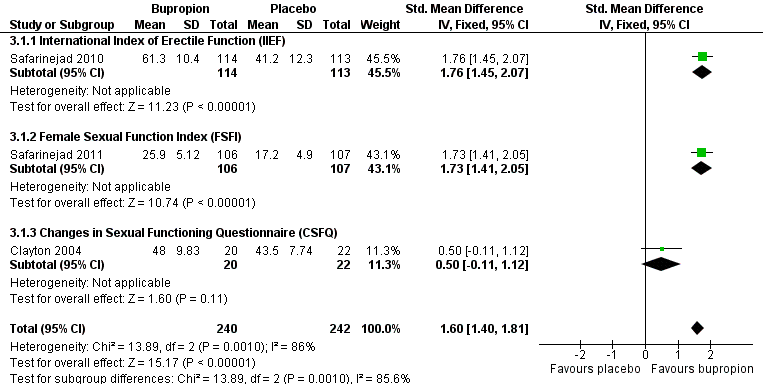
Forest plot of comparison 3: bupropion vs placebo, outcome: 3.1 endpoint scale total scores
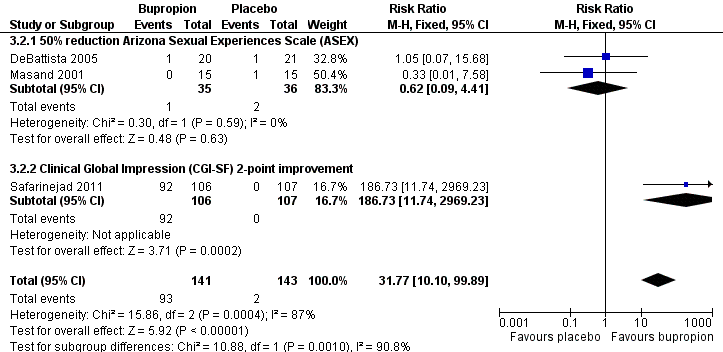
Forest plot of comparison 3: bupropion vs placebo, outcome: 3.2 response (as defined by study)

Comparison 1 Sildenafil vs placebo, Outcome 1 Endpoint International Index of Erectile Function (IIEF) scores.
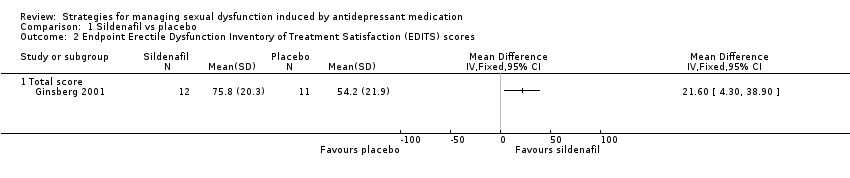
Comparison 1 Sildenafil vs placebo, Outcome 2 Endpoint Erectile Dysfunction Inventory of Treatment Satisfaction (EDITS) scores.
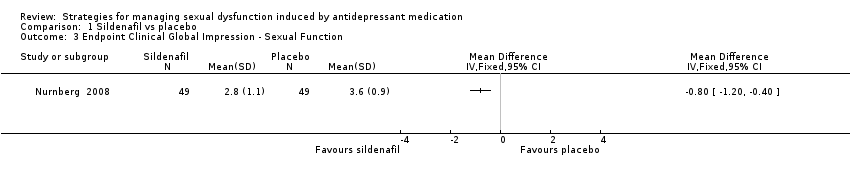
Comparison 1 Sildenafil vs placebo, Outcome 3 Endpoint Clinical Global Impression ‐ Sexual Function.
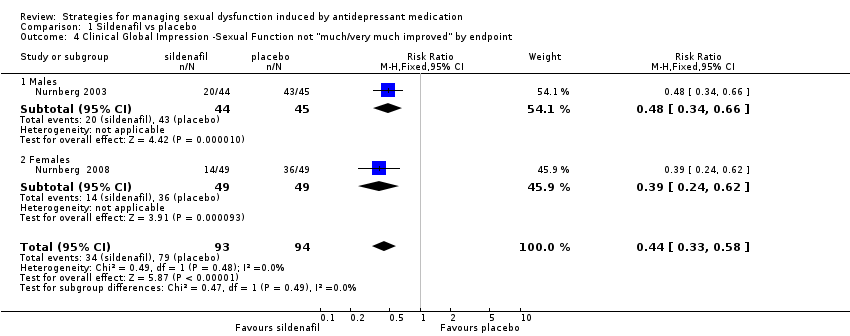
Comparison 1 Sildenafil vs placebo, Outcome 4 Clinical Global Impression ‐Sexual Function not "much/very much improved" by endpoint.
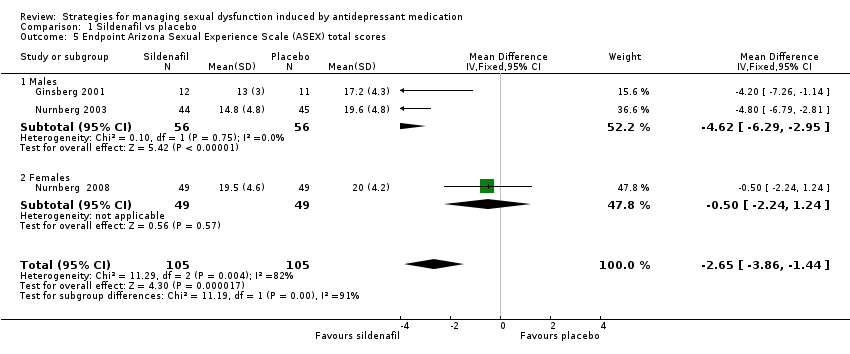
Comparison 1 Sildenafil vs placebo, Outcome 5 Endpoint Arizona Sexual Experience Scale (ASEX) total scores.

Comparison 1 Sildenafil vs placebo, Outcome 6 Males: endpoint Arizona Sexual Experience Scale scores.
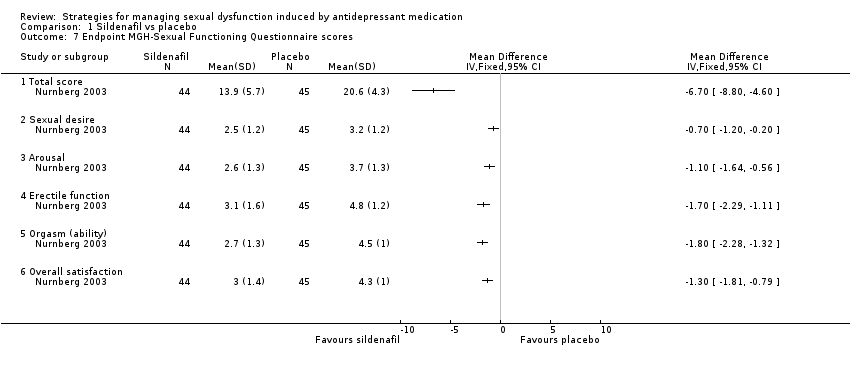
Comparison 1 Sildenafil vs placebo, Outcome 7 Endpoint MGH‐Sexual Functioning Questionnaire scores.

Comparison 1 Sildenafil vs placebo, Outcome 8 Sexual dysfunction defined by Arizona Sexual Experience Scale at trial endpoint.

Comparison 1 Sildenafil vs placebo, Outcome 9 Dropouts.
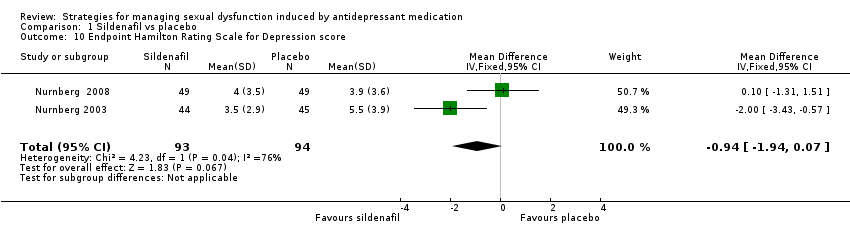
Comparison 1 Sildenafil vs placebo, Outcome 10 Endpoint Hamilton Rating Scale for Depression score.
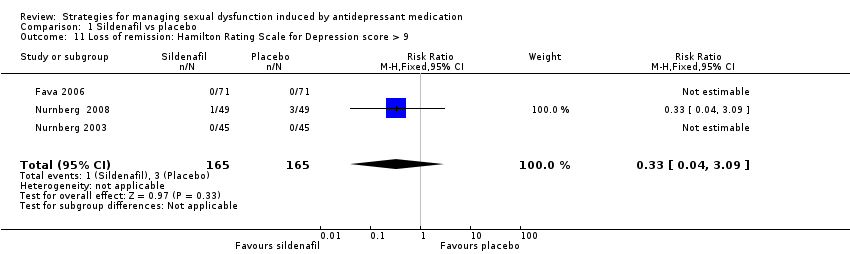
Comparison 1 Sildenafil vs placebo, Outcome 11 Loss of remission: Hamilton Rating Scale for Depression score > 9.

Comparison 1 Sildenafil vs placebo, Outcome 12 Global Efficacy Questionnaire (questions 1 & 2).

Comparison 1 Sildenafil vs placebo, Outcome 13 Global efficacy questionnaire (question 3).

Comparison 1 Sildenafil vs placebo, Outcome 14 Endpoint Sexual Function Questionnaire (SFQ).

Comparison 1 Sildenafil vs placebo, Outcome 15 UNM Sexual Function Inventory.

Comparison 1 Sildenafil vs placebo, Outcome 16 Females: endpoint Arizona Sexual Experience Scale scores.
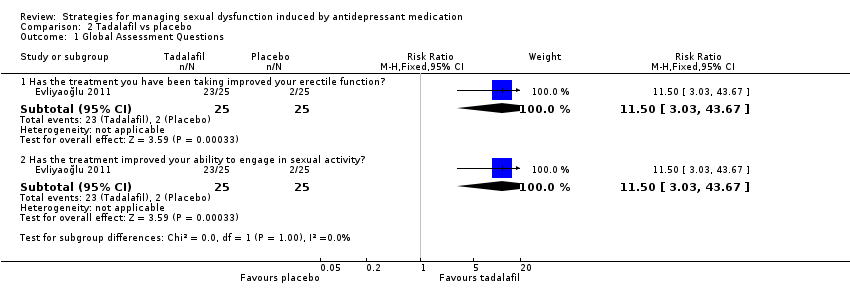
Comparison 2 Tadalafil vs placebo, Outcome 1 Global Assessment Questions.

Comparison 2 Tadalafil vs placebo, Outcome 2 Endpoint Sexual Encounter Profile (SEP).
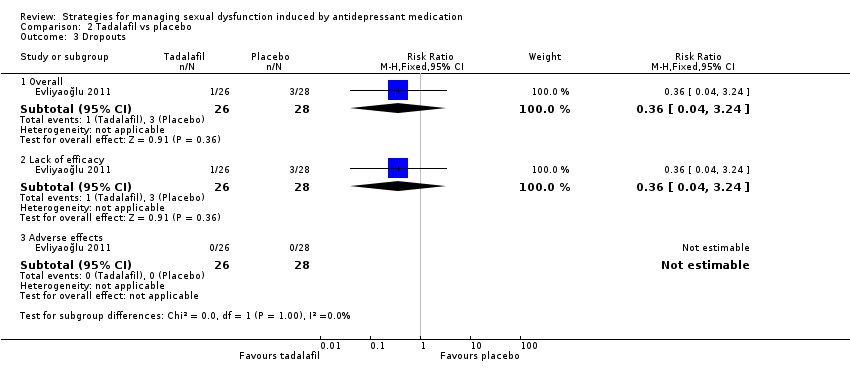
Comparison 2 Tadalafil vs placebo, Outcome 3 Dropouts.

Comparison 3 Bupropion vs placebo, Outcome 1 Endpoint scale total scores.
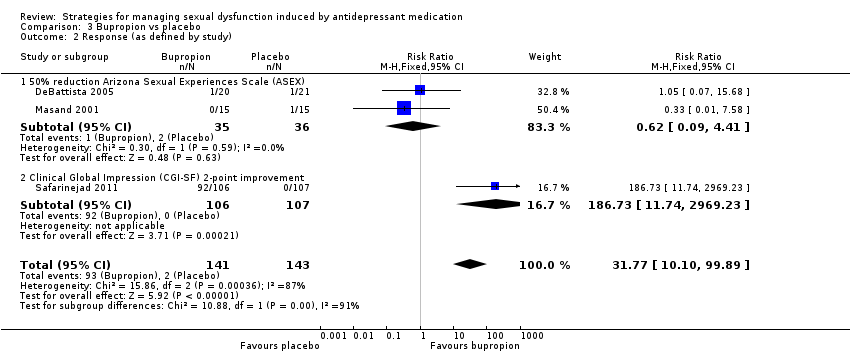
Comparison 3 Bupropion vs placebo, Outcome 2 Response (as defined by study).

Comparison 3 Bupropion vs placebo, Outcome 3 Endpoint International Index of Erectile Function (IIEF).
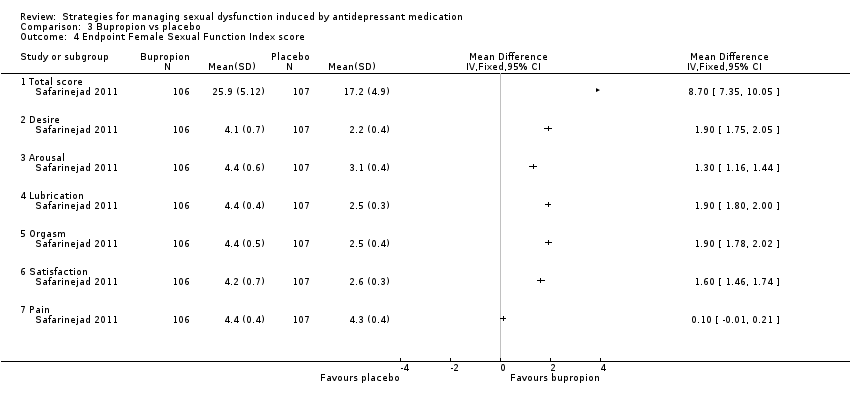
Comparison 3 Bupropion vs placebo, Outcome 4 Endpoint Female Sexual Function Index score.

Comparison 3 Bupropion vs placebo, Outcome 5 Endpoint Changes in Sexual Functioning Questionnaire score.
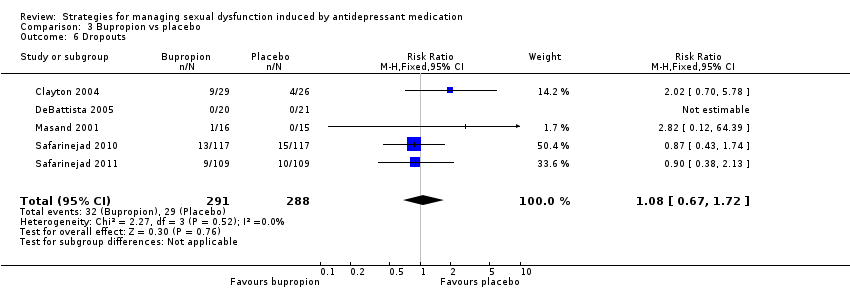
Comparison 3 Bupropion vs placebo, Outcome 6 Dropouts.
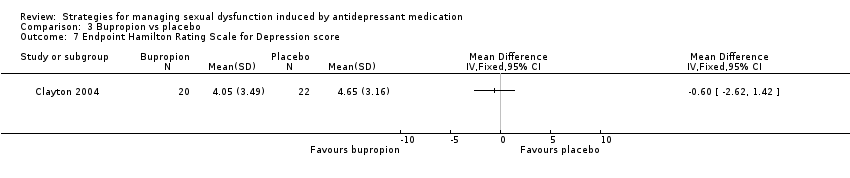
Comparison 3 Bupropion vs placebo, Outcome 7 Endpoint Hamilton Rating Scale for Depression score.

Comparison 3 Bupropion vs placebo, Outcome 8 Endpoint Clinical Global Impression (CGI ‐ SF).

Comparison 3 Bupropion vs placebo, Outcome 9 Endpoint ASEX.
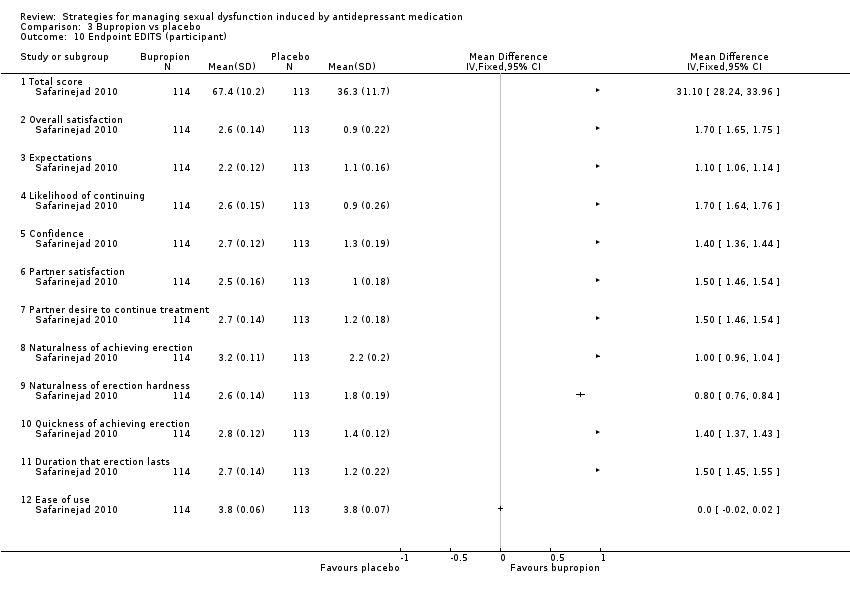
Comparison 3 Bupropion vs placebo, Outcome 10 Endpoint EDITS (participant).

Comparison 3 Bupropion vs placebo, Outcome 11 Endpoint EDITS (partner).
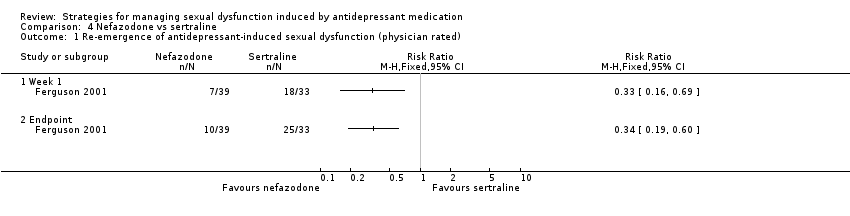
Comparison 4 Nefazodone vs sertraline, Outcome 1 Re‐emergence of antidepressant‐induced sexual dysfunction (physician rated).

Comparison 4 Nefazodone vs sertraline, Outcome 2 Overall degree of sexual satisfaction (participant rated).

Comparison 4 Nefazodone vs sertraline, Outcome 3 Dropouts.
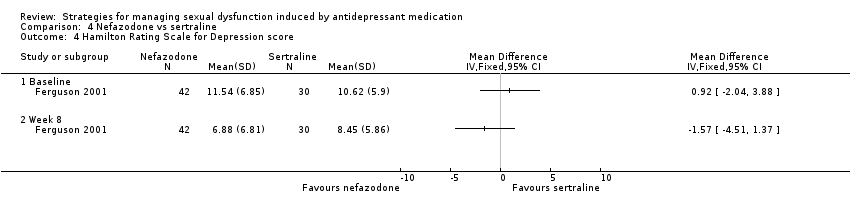
Comparison 4 Nefazodone vs sertraline, Outcome 4 Hamilton Rating Scale for Depression score.

Comparison 5 Ginkgo biloba vs placebo, Outcome 1 Endpoint sexual function ratings (investigator questionnaire).

Comparison 5 Ginkgo biloba vs placebo, Outcome 2 Sexual Dysfunction Scale (investigator developed).

Comparison 5 Ginkgo biloba vs placebo, Outcome 3 Dropouts.

Comparison 6 Granisetron vs placebo, Outcome 1 Change from baseline on Sexual Side Effects Scale (SSES) total score.
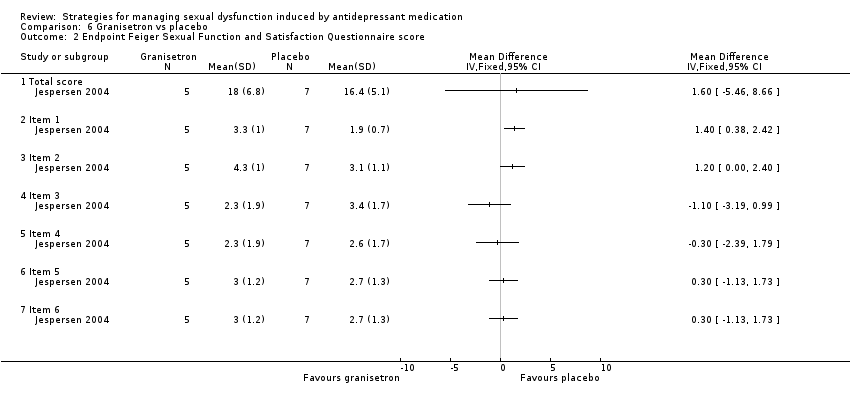
Comparison 6 Granisetron vs placebo, Outcome 2 Endpoint Feiger Sexual Function and Satisfaction Questionnaire score.
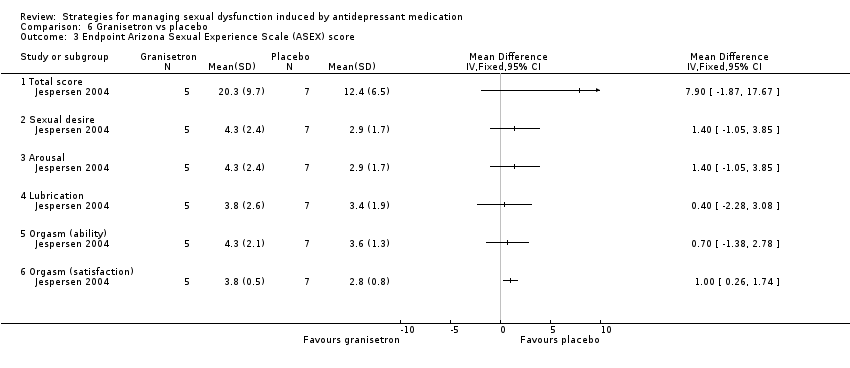
Comparison 6 Granisetron vs placebo, Outcome 3 Endpoint Arizona Sexual Experience Scale (ASEX) score.

Comparison 6 Granisetron vs placebo, Outcome 4 Dropouts.

Comparison 6 Granisetron vs placebo, Outcome 5 Recurrence of mood symptoms.
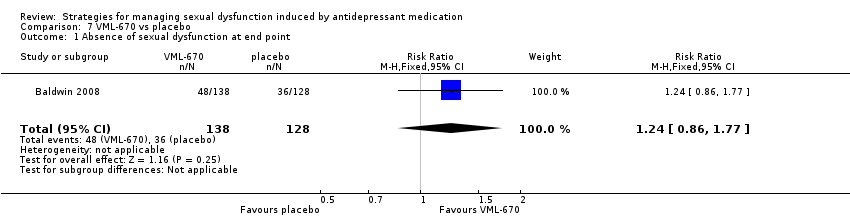
Comparison 7 VML‐670 vs placebo, Outcome 1 Absence of sexual dysfunction at end point.

Comparison 7 VML‐670 vs placebo, Outcome 2 'Improved' or 'much improved' on Clinical Global Impression.
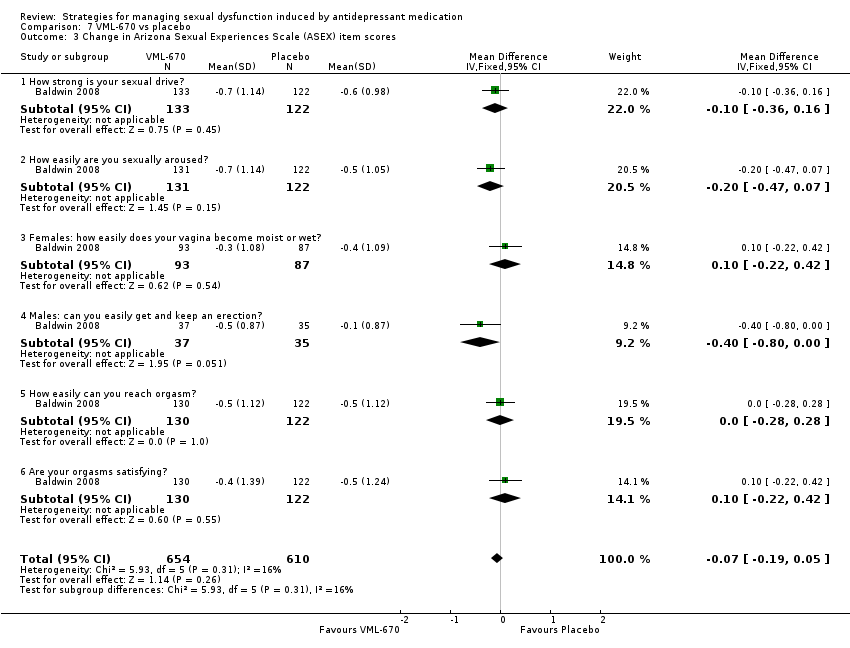
Comparison 7 VML‐670 vs placebo, Outcome 3 Change in Arizona Sexual Experiences Scale (ASEX) item scores.
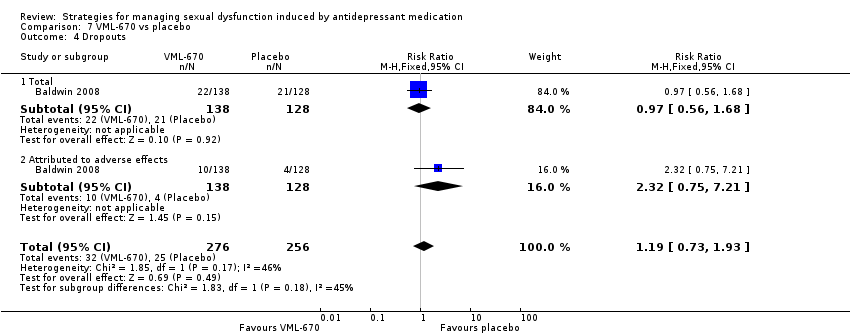
Comparison 7 VML‐670 vs placebo, Outcome 4 Dropouts.

Comparison 8 Buspirone vs placebo, Outcome 1 Change in patient‐rated visual analogue scales.
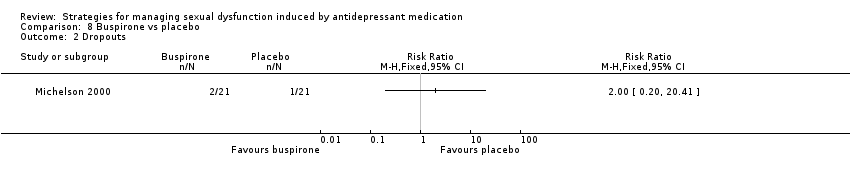
Comparison 8 Buspirone vs placebo, Outcome 2 Dropouts.
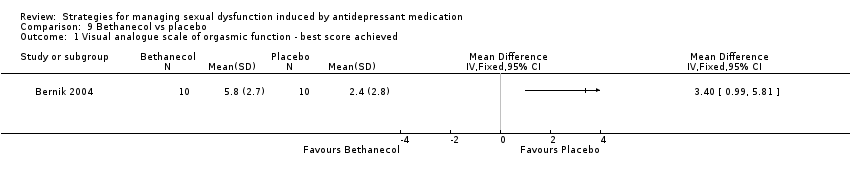
Comparison 9 Bethanecol vs placebo, Outcome 1 Visual analogue scale of orgasmic function ‐ best score achieved.
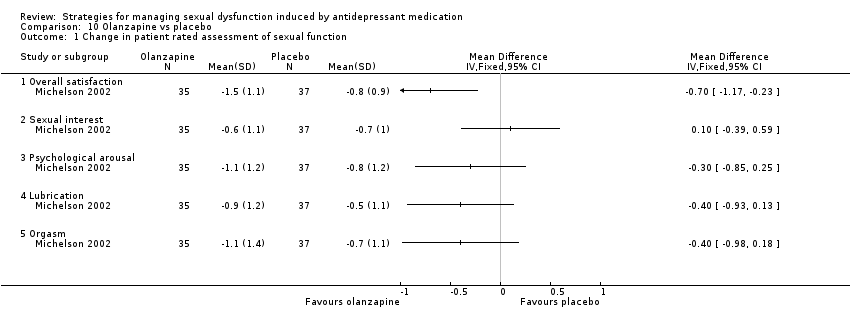
Comparison 10 Olanzapine vs placebo, Outcome 1 Change in patient rated assessment of sexual function.
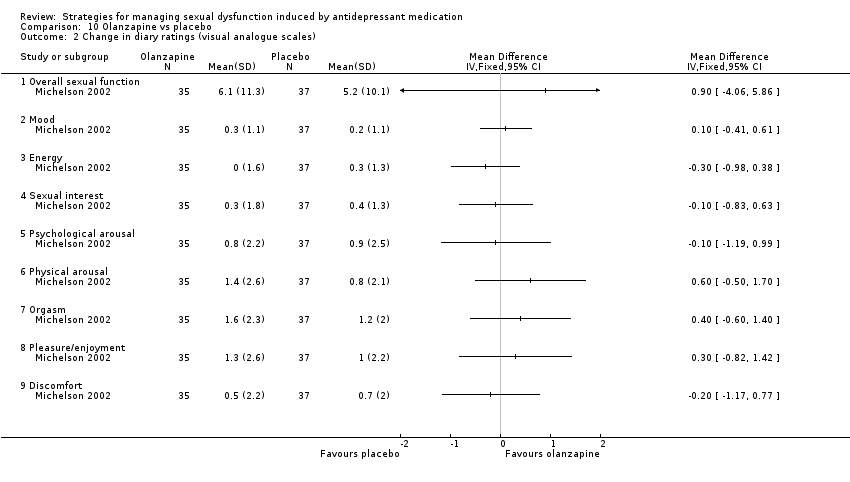
Comparison 10 Olanzapine vs placebo, Outcome 2 Change in diary ratings (visual analogue scales).
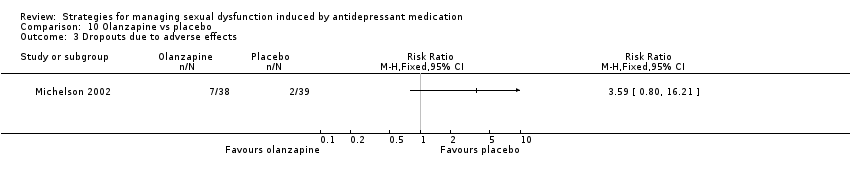
Comparison 10 Olanzapine vs placebo, Outcome 3 Dropouts due to adverse effects.

Comparison 11 Mirtazapine vs placebo, Outcome 1 Change in patient rated assessment of sexual function.
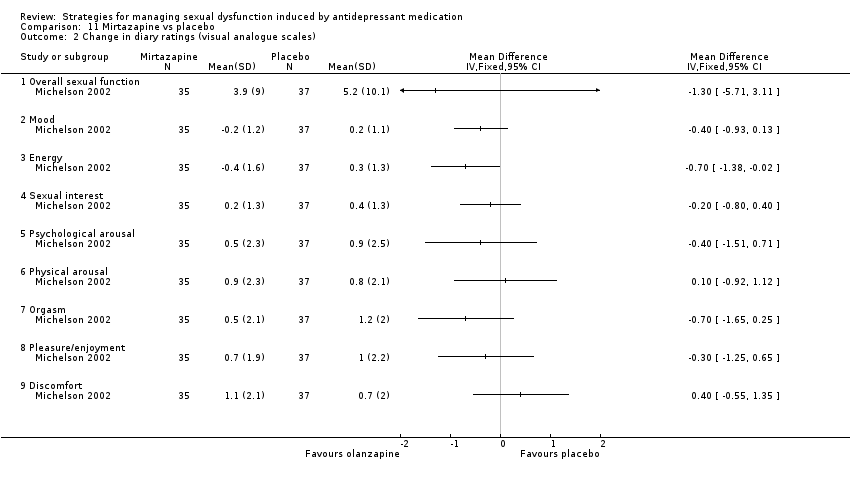
Comparison 11 Mirtazapine vs placebo, Outcome 2 Change in diary ratings (visual analogue scales).

Comparison 11 Mirtazapine vs placebo, Outcome 3 Endpoint modified Kinsey Structured Interview.

Comparison 11 Mirtazapine vs placebo, Outcome 4 Dropouts.
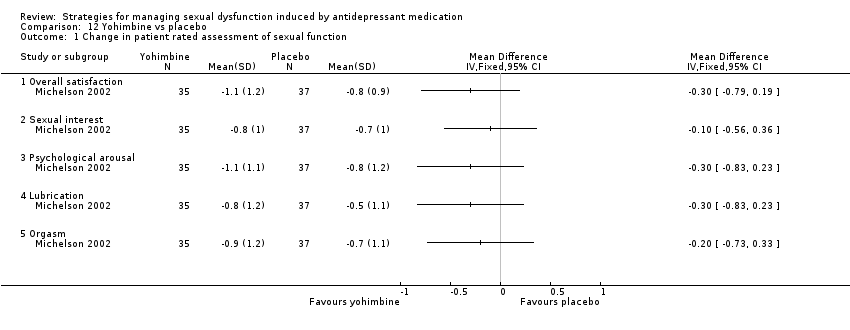
Comparison 12 Yohimbine vs placebo, Outcome 1 Change in patient rated assessment of sexual function.
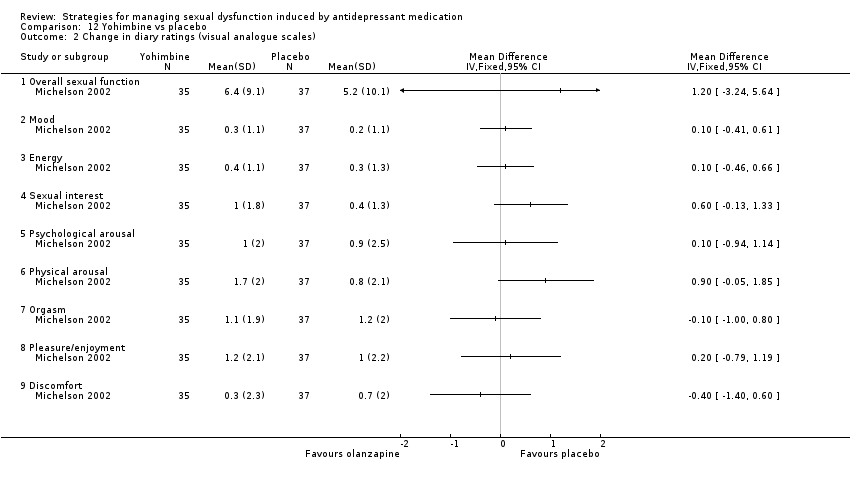
Comparison 12 Yohimbine vs placebo, Outcome 2 Change in diary ratings (visual analogue scales).

Comparison 12 Yohimbine vs placebo, Outcome 3 Dropouts.
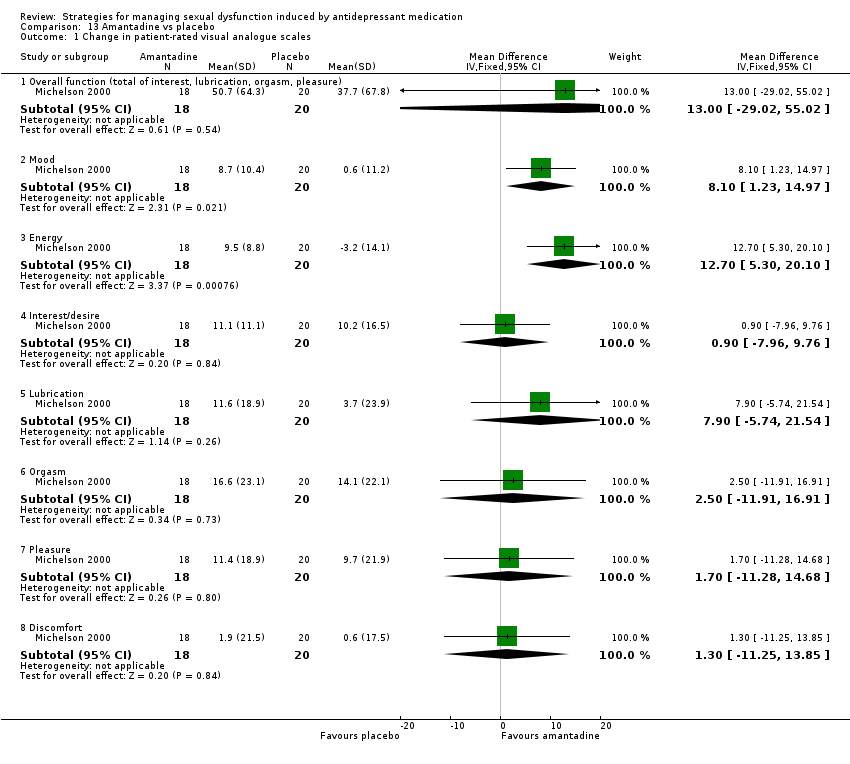
Comparison 13 Amantadine vs placebo, Outcome 1 Change in patient‐rated visual analogue scales.
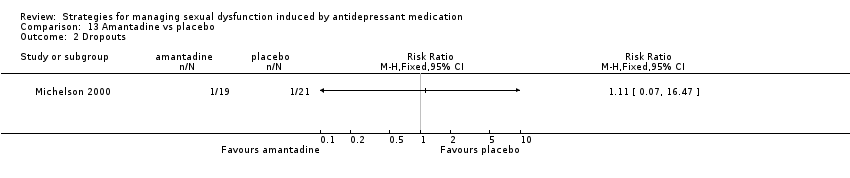
Comparison 13 Amantadine vs placebo, Outcome 2 Dropouts.

Comparison 14 ephedrine vs placebo, Outcome 1 Endpoint Brief Index of Sexual Functioning for Women (BISF‐W).

Comparison 15 Maca root: high vs low dose, Outcome 1 Endpoint Arizona Sexual Experiences Scale (ASEX) score.
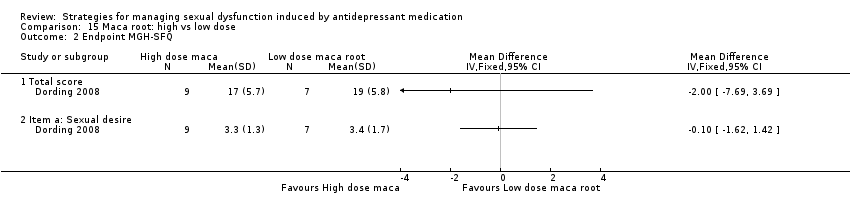
Comparison 15 Maca root: high vs low dose, Outcome 2 Endpoint MGH‐SFQ.
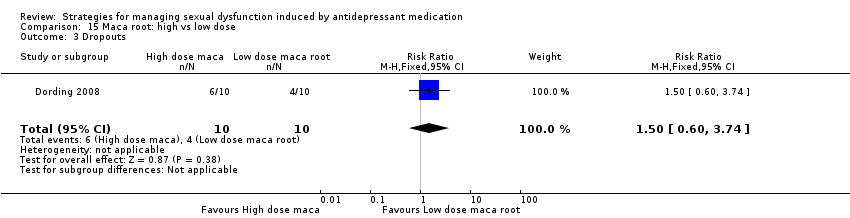
Comparison 15 Maca root: high vs low dose, Outcome 3 Dropouts.

Comparison 15 Maca root: high vs low dose, Outcome 4 Endpoint ratings of psychiatric symptoms.
| Sildenafil compared with placebo for antidepressant‐induced sexual dysfunction | ||||||
| Patient or population: people with antidepressant‐induced sexual dysfunction Settings: outpatient Intervention: sildenafil Comparison: placebo | ||||||
| Outcomes | Illustrative comparative risks* (95% CI) | Relative effect | No of Participants | Quality of the evidence | Comments | |
| Assumed risk | Corresponding risk | |||||
| Placebo | Sildenafil | |||||
| Endpoint International Index of Erectile Function (IIEF) total scores (The IIEF is a self‐report measure with 15 questions examining erectile function, orgasmic function, sexual desire, and intercourse satisfaction. Maximum possible score 75) | The mean IIEF score ranged across control groups from | The mean IIEF score in the intervention groups was | 112 men | ⊕⊕⊕⊕ | ||
| Endpoint International Index of Erectile Function (IIEF) scores ‐ question 3: ability to achieve erection (Maximum score 5) | The mean score in control groups was 3.1 | The mean score in the intervention groups was | 231 men | ⊕⊕⊕⊕ | ||
| Endpoint International Index of Erectile Function (IIEF) scores ‐ intercourse satisfaction (questions 6, 7, 8) (Maximum score 15) | The mean score in the control group was 7.2 | The mean score in the intervention group was | 89 men | ⊕⊕⊕⊝ | ||
| Clinical Global Impression ‐Sexual Function not "much/very much improved" by endpoint | Male population | RR 0.44 (0.33 to 0.58) | 187 | ⊕⊕⊕⊝ | ||
| 956 per 1000 | 459 per 1000 | |||||
| Female population | ||||||
| 735 per 1000 | 287 per 1000 | |||||
| Dropouts (People leaving the trial early) | Low risk population | RR 0.68 (0.41 to 1.14) | 353 | ⊕⊕⊕⊕ | ||
| 90 per 1000 | 61 per 1000 | |||||
| Medium risk population | ||||||
| 250 per 1000 | 170 per 1000 | |||||
| High risk population | ||||||
| 360 per 1000 | 245 per 1000 | |||||
| Global Efficacy Questionnaire (questions 1 & 2) (Questions assessing improvement attributed to medication compared to having no treatment at all) | Improvement in erections | RR 2.50 (1.67 to 3.73) and RR 2.55 (1.71 to 3.80) | 284 men | ⊕⊕⊕⊝ | ||
| 282 per 1000 | 705 per 1000 | |||||
| Improvement in ability to have sexual intercourse | ||||||
| 282 per 1000 | 719 per 1000 | |||||
| *The basis for the assumed risk (e.g. the median control group risk across studies) is provided in footnotes. The corresponding risk (and its 95% confidence interval) is based on the assumed risk in the comparison group and the relative effect of the intervention (and its 95% CI). | ||||||
| GRADE Working Group grades of evidence | ||||||
| The evidence for effects based on single trials is rated as moderate quality since further trial data may well change the estimate. | ||||||
| Bupropion compared with placebo for antidepressant‐induced sexual dysfunction | ||||||
| Patient or population: people with antidepressant‐induced sexual dysfunction Settings: outpatients Intervention: bupropion (doses of 150 mg daily and 150 mg twice daily) Comparison: placebo | ||||||
| Outcomes | Illustrative comparative risks* (95% CI) | Relative effect | No of Participants | Quality of the evidence | Comments | |
| Assumed risk | Corresponding risk | |||||
| Placebo | Bupropion | |||||
| Endpoint scale total scores (150 mg twice daily dose) (Scales of sexual functioning. As studies used different scales to assess sexual functioning, differences are expressed as standardised mean differences (SMD)) | The mean value with this analysis is in effect zero | The mean score in the intervention groups was 1.60 higher (1.40 to 1.81) | 482 | ⊕⊕⊕⊝ | ||
| 50% reduction in score on the Arizona Sexual Experiences Scale (ASEX) (150 mg once daily dose) (The ASEX is a 5‐item self‐report inventory of sexual function) | Lower risk population | RR 0.62 (0.09 to 4.41) | 71 | ⊕⊕⊕⊝ | ||
| 47 per 1000 | 29 per 1000 | |||||
| Higher risk population | ||||||
| 67 per 1000 | 41 per 1000 | |||||
| Dropouts (People leaving the trial early) | Lower risk population | RR 1.08 (0.67 to 1.72) | 579 | ⊕⊕⊕⊕ | ||
| 90 per 1000 | 97 per 1000 | |||||
| Higher risk population | ||||||
| 150 per 1000 | 162 per 1000 | |||||
| *The basis for the assumed risk (e.g. the median control group risk across studies) is provided in footnotes. The corresponding risk (and its 95% confidence interval) is based on the assumed risk in the comparison group and the relative effect of the intervention (and its 95% CI). | ||||||
| GRADE Working Group grades of evidence | ||||||
| 1 Unexplained inconsistency in effects between studies reduces confidence in this effect | ||||||
| Outcome or subgroup title | No. of studies | No. of participants | Statistical method | Effect size |
| 1 Endpoint International Index of Erectile Function (IIEF) scores Show forest plot | 3 | Mean Difference (IV, Fixed, 95% CI) | Subtotals only | |
| 1.1 Total score | 2 | 112 | Mean Difference (IV, Fixed, 95% CI) | 19.36 [15.00, 23.72] |
| 1.2 Erectile function (questions 1‐5,15) | 1 | 89 | Mean Difference (IV, Fixed, 95% CI) | 10.0 [7.39, 12.61] |
| 1.3 Question 3: ability to achieve erection | 2 | 231 | Mean Difference (IV, Fixed, 95% CI) | 1.04 [0.65, 1.44] |
| 1.4 Question 4: ability to maintain erection | 2 | 231 | Mean Difference (IV, Fixed, 95% CI) | 1.18 [0.78, 1.59] |
| 1.5 Intercourse satisfaction (questions 6, 7, 8) | 1 | 89 | Mean Difference (IV, Fixed, 95% CI) | 3.50 [2.48, 4.52] |
| 1.6 Orgasmic function (questions 9, 10) | 1 | 89 | Mean Difference (IV, Fixed, 95% CI) | 2.5 [1.36, 3.64] |
| 1.7 Sexual desire (questions 11, 12) | 1 | 89 | Mean Difference (IV, Fixed, 95% CI) | 0.5 [‐0.38, 1.38] |
| 1.8 Overall satisfaction (questions 13,14) | 1 | 89 | Mean Difference (IV, Fixed, 95% CI) | 1.80 [0.86, 2.74] |
| 2 Endpoint Erectile Dysfunction Inventory of Treatment Satisfaction (EDITS) scores Show forest plot | 1 | Mean Difference (IV, Fixed, 95% CI) | Totals not selected | |
| 2.1 Total score | 1 | Mean Difference (IV, Fixed, 95% CI) | 0.0 [0.0, 0.0] | |
| 3 Endpoint Clinical Global Impression ‐ Sexual Function Show forest plot | 1 | Mean Difference (IV, Fixed, 95% CI) | Totals not selected | |
| 4 Clinical Global Impression ‐Sexual Function not "much/very much improved" by endpoint Show forest plot | 2 | 187 | Risk Ratio (M‐H, Fixed, 95% CI) | 0.44 [0.33, 0.58] |
| 4.1 Males | 1 | 89 | Risk Ratio (M‐H, Fixed, 95% CI) | 0.48 [0.34, 0.66] |
| 4.2 Females | 1 | 98 | Risk Ratio (M‐H, Fixed, 95% CI) | 0.39 [0.24, 0.62] |
| 5 Endpoint Arizona Sexual Experience Scale (ASEX) total scores Show forest plot | 3 | 210 | Mean Difference (IV, Fixed, 95% CI) | ‐2.65 [‐3.86, ‐1.44] |
| 5.1 Males | 2 | 112 | Mean Difference (IV, Fixed, 95% CI) | ‐4.62 [‐6.29, ‐2.95] |
| 5.2 Females | 1 | 98 | Mean Difference (IV, Fixed, 95% CI) | ‐0.5 [‐2.24, 1.24] |
| 6 Males: endpoint Arizona Sexual Experience Scale scores Show forest plot | 2 | Mean Difference (IV, Fixed, 95% CI) | Subtotals only | |
| 6.1 Total score | 2 | 112 | Mean Difference (IV, Fixed, 95% CI) | ‐4.62 [‐6.29, ‐2.95] |
| 6.2 Sexual desire | 1 | 89 | Mean Difference (IV, Fixed, 95% CI) | ‐0.60 [‐1.08, ‐0.12] |
| 6.3 Arousal | 1 | 89 | Mean Difference (IV, Fixed, 95% CI) | ‐0.60 [‐1.06, ‐0.14] |
| 6.4 Erectile function | 1 | 89 | Mean Difference (IV, Fixed, 95% CI) | ‐1.20 [‐1.66, ‐0.74] |
| 6.5 Orgasm (ability) | 1 | 89 | Mean Difference (IV, Fixed, 95% CI) | ‐1.40 [‐1.90, ‐0.90] |
| 6.6 Orgasm (satisfaction) | 1 | 89 | Mean Difference (IV, Fixed, 95% CI) | ‐1.0 [‐1.58, ‐0.42] |
| 7 Endpoint MGH‐Sexual Functioning Questionnaire scores Show forest plot | 1 | Mean Difference (IV, Fixed, 95% CI) | Totals not selected | |
| 7.1 Total score | 1 | Mean Difference (IV, Fixed, 95% CI) | 0.0 [0.0, 0.0] | |
| 7.2 Sexual desire | 1 | Mean Difference (IV, Fixed, 95% CI) | 0.0 [0.0, 0.0] | |
| 7.3 Arousal | 1 | Mean Difference (IV, Fixed, 95% CI) | 0.0 [0.0, 0.0] | |
| 7.4 Erectile function | 1 | Mean Difference (IV, Fixed, 95% CI) | 0.0 [0.0, 0.0] | |
| 7.5 Orgasm (ability) | 1 | Mean Difference (IV, Fixed, 95% CI) | 0.0 [0.0, 0.0] | |
| 7.6 Overall satisfaction | 1 | Mean Difference (IV, Fixed, 95% CI) | 0.0 [0.0, 0.0] | |
| 8 Sexual dysfunction defined by Arizona Sexual Experience Scale at trial endpoint Show forest plot | 1 | Risk Ratio (M‐H, Fixed, 95% CI) | Totals not selected | |
| 9 Dropouts Show forest plot | 4 | 353 | Risk Ratio (M‐H, Fixed, 95% CI) | 0.68 [0.41, 1.14] |
| 10 Endpoint Hamilton Rating Scale for Depression score Show forest plot | 2 | 187 | Mean Difference (IV, Fixed, 95% CI) | ‐0.94 [‐1.94, 0.07] |
| 11 Loss of remission: Hamilton Rating Scale for Depression score > 9 Show forest plot | 3 | 330 | Risk Ratio (M‐H, Fixed, 95% CI) | 0.33 [0.04, 3.09] |
| 12 Global Efficacy Questionnaire (questions 1 & 2) Show forest plot | 1 | 284 | Risk Ratio (M‐H, Fixed, 95% CI) | 2.53 [1.90, 3.35] |
| 12.1 Improvement in erections | 1 | 142 | Risk Ratio (M‐H, Fixed, 95% CI) | 2.5 [1.67, 3.73] |
| 12.2 Improvement in ability to have sexual intercourse | 1 | 142 | Risk Ratio (M‐H, Fixed, 95% CI) | 2.55 [1.71, 3.80] |
| 13 Global efficacy questionnaire (question 3) Show forest plot | 1 | 129 | Mean Difference (IV, Fixed, 95% CI) | 1.2 [0.65, 1.75] |
| 13.1 Question 3: Frequency of erection that allowed satisfactory sexual intercourse | 1 | 129 | Mean Difference (IV, Fixed, 95% CI) | 1.2 [0.65, 1.75] |
| 14 Endpoint Sexual Function Questionnaire (SFQ) Show forest plot | 1 | Mean Difference (IV, Fixed, 95% CI) | Totals not selected | |
| 14.1 Desire | 1 | Mean Difference (IV, Fixed, 95% CI) | 0.0 [0.0, 0.0] | |
| 14.2 Arousal‐sensation | 1 | Mean Difference (IV, Fixed, 95% CI) | 0.0 [0.0, 0.0] | |
| 14.3 Arousal‐lubrication | 1 | Mean Difference (IV, Fixed, 95% CI) | 0.0 [0.0, 0.0] | |
| 14.4 Orgasm | 1 | Mean Difference (IV, Fixed, 95% CI) | 0.0 [0.0, 0.0] | |
| 14.5 Enjoyment | 1 | Mean Difference (IV, Fixed, 95% CI) | 0.0 [0.0, 0.0] | |
| 14.6 Pain | 1 | Mean Difference (IV, Fixed, 95% CI) | 0.0 [0.0, 0.0] | |
| 14.7 Partner | 1 | Mean Difference (IV, Fixed, 95% CI) | 0.0 [0.0, 0.0] | |
| 15 UNM Sexual Function Inventory Show forest plot | 1 | Mean Difference (IV, Fixed, 95% CI) | Totals not selected | |
| 15.1 Total score | 1 | Mean Difference (IV, Fixed, 95% CI) | 0.0 [0.0, 0.0] | |
| 15.2 Desire | 1 | Mean Difference (IV, Fixed, 95% CI) | 0.0 [0.0, 0.0] | |
| 15.3 Sexual arousal | 1 | Mean Difference (IV, Fixed, 95% CI) | 0.0 [0.0, 0.0] | |
| 15.4 Lubrication | 1 | Mean Difference (IV, Fixed, 95% CI) | 0.0 [0.0, 0.0] | |
| 15.5 Ability to reach orgasm | 1 | Mean Difference (IV, Fixed, 95% CI) | 0.0 [0.0, 0.0] | |
| 15.6 Overall satisfaction | 1 | Mean Difference (IV, Fixed, 95% CI) | 0.0 [0.0, 0.0] | |
| 16 Females: endpoint Arizona Sexual Experience Scale scores Show forest plot | 1 | Mean Difference (IV, Fixed, 95% CI) | Totals not selected | |
| 16.1 Total score | 1 | Mean Difference (IV, Fixed, 95% CI) | 0.0 [0.0, 0.0] | |
| 16.2 Sexual desire | 1 | Mean Difference (IV, Fixed, 95% CI) | 0.0 [0.0, 0.0] | |
| 16.3 Arousal | 1 | Mean Difference (IV, Fixed, 95% CI) | 0.0 [0.0, 0.0] | |
| 16.4 Orgasm (ability) | 1 | Mean Difference (IV, Fixed, 95% CI) | 0.0 [0.0, 0.0] | |
| 16.5 Orgasm (satisfaction) | 1 | Mean Difference (IV, Fixed, 95% CI) | 0.0 [0.0, 0.0] | |
| 16.6 Lubrication | 1 | Mean Difference (IV, Fixed, 95% CI) | 0.0 [0.0, 0.0] | |
| Outcome or subgroup title | No. of studies | No. of participants | Statistical method | Effect size |
| 1 Global Assessment Questions Show forest plot | 1 | Risk Ratio (M‐H, Fixed, 95% CI) | Subtotals only | |
| 1.1 Has the treatment you have been taking improved your erectile function? | 1 | 50 | Risk Ratio (M‐H, Fixed, 95% CI) | 11.5 [3.03, 43.67] |
| 1.2 Has the treatment improved your ability to engage in sexual activity? | 1 | 50 | Risk Ratio (M‐H, Fixed, 95% CI) | 11.5 [3.03, 43.67] |
| 2 Endpoint Sexual Encounter Profile (SEP) Show forest plot | 1 | Risk Ratio (M‐H, Fixed, 95% CI) | Subtotals only | |
| 2.1 Question 2: Were you able to insert your penis into your partner's vagina? | 1 | 50 | Risk Ratio (M‐H, Fixed, 95% CI) | 2.33 [0.68, 8.01] |
| 2.2 Question 3: Did your erection last long enough for you to have successful intercourse? | 1 | 50 | Risk Ratio (M‐H, Fixed, 95% CI) | 6.0 [0.78, 46.29] |
| 2.3 Question 4: Were you satisfied with the hardness of your erection? | 1 | 50 | Risk Ratio (M‐H, Fixed, 95% CI) | 6.0 [0.78, 46.29] |
| 2.4 Question 5: Were you satisfied overall with this sexual experience? | 1 | 50 | Risk Ratio (M‐H, Fixed, 95% CI) | 6.0 [0.78, 46.29] |
| 3 Dropouts Show forest plot | 1 | Risk Ratio (M‐H, Fixed, 95% CI) | Subtotals only | |
| 3.1 Overall | 1 | 54 | Risk Ratio (M‐H, Fixed, 95% CI) | 0.36 [0.04, 3.24] |
| 3.2 Lack of efficacy | 1 | 54 | Risk Ratio (M‐H, Fixed, 95% CI) | 0.36 [0.04, 3.24] |
| 3.3 Adverse effects | 1 | 54 | Risk Ratio (M‐H, Fixed, 95% CI) | 0.0 [0.0, 0.0] |
| Outcome or subgroup title | No. of studies | No. of participants | Statistical method | Effect size |
| 1 Endpoint scale total scores Show forest plot | 3 | 482 | Std. Mean Difference (IV, Fixed, 95% CI) | 1.60 [1.40, 1.81] |
| 1.1 International Index of Erectile Function (IIEF) | 1 | 227 | Std. Mean Difference (IV, Fixed, 95% CI) | 1.76 [1.45, 2.07] |
| 1.2 Female Sexual Function Index (FSFI) | 1 | 213 | Std. Mean Difference (IV, Fixed, 95% CI) | 1.73 [1.41, 2.05] |
| 1.3 Changes in Sexual Functioning Questionnaire (CSFQ) | 1 | 42 | Std. Mean Difference (IV, Fixed, 95% CI) | 0.50 [‐0.11, 1.12] |
| 2 Response (as defined by study) Show forest plot | 3 | 284 | Risk Ratio (M‐H, Fixed, 95% CI) | 31.77 [10.10, 99.89] |
| 2.1 50% reduction Arizona Sexual Experiences Scale (ASEX) | 2 | 71 | Risk Ratio (M‐H, Fixed, 95% CI) | 0.62 [0.09, 4.41] |
| 2.2 Clinical Global Impression (CGI‐SF) 2‐point improvement | 1 | 213 | Risk Ratio (M‐H, Fixed, 95% CI) | 186.73 [11.74, 2969.23] |
| 3 Endpoint International Index of Erectile Function (IIEF) Show forest plot | 1 | Mean Difference (IV, Fixed, 95% CI) | Subtotals only | |
| 3.1 Total score | 1 | 227 | Mean Difference (IV, Fixed, 95% CI) | 20.10 [17.14, 23.06] |
| 3.2 Erectile function | 1 | 227 | Mean Difference (IV, Fixed, 95% CI) | 9.30 [8.18, 10.42] |
| 3.3 Orgasmic function | 1 | 227 | Mean Difference (IV, Fixed, 95% CI) | 2.70 [2.15, 3.25] |
| 3.4 Sexual desire | 1 | 227 | Mean Difference (IV, Fixed, 95% CI) | 2.10 [1.76, 2.44] |
| 3.5 Intercourse satisfaction | 1 | 227 | Mean Difference (IV, Fixed, 95% CI) | 3.6 [3.00, 4.20] |
| 3.6 Overall satisfaction | 1 | 227 | Mean Difference (IV, Fixed, 95% CI) | 2.60 [1.99, 3.21] |
| 4 Endpoint Female Sexual Function Index score Show forest plot | 1 | Mean Difference (IV, Fixed, 95% CI) | Totals not selected | |
| 4.1 Total score | 1 | Mean Difference (IV, Fixed, 95% CI) | 0.0 [0.0, 0.0] | |
| 4.2 Desire | 1 | Mean Difference (IV, Fixed, 95% CI) | 0.0 [0.0, 0.0] | |
| 4.3 Arousal | 1 | Mean Difference (IV, Fixed, 95% CI) | 0.0 [0.0, 0.0] | |
| 4.4 Lubrication | 1 | Mean Difference (IV, Fixed, 95% CI) | 0.0 [0.0, 0.0] | |
| 4.5 Orgasm | 1 | Mean Difference (IV, Fixed, 95% CI) | 0.0 [0.0, 0.0] | |
| 4.6 Satisfaction | 1 | Mean Difference (IV, Fixed, 95% CI) | 0.0 [0.0, 0.0] | |
| 4.7 Pain | 1 | Mean Difference (IV, Fixed, 95% CI) | 0.0 [0.0, 0.0] | |
| 5 Endpoint Changes in Sexual Functioning Questionnaire score Show forest plot | 1 | Mean Difference (IV, Fixed, 95% CI) | Totals not selected | |
| 5.1 Total score | 1 | Mean Difference (IV, Fixed, 95% CI) | 0.0 [0.0, 0.0] | |
| 5.2 Desire/interest | 1 | Mean Difference (IV, Fixed, 95% CI) | 0.0 [0.0, 0.0] | |
| 5.3 Desire/frequency | 1 | Mean Difference (IV, Fixed, 95% CI) | 0.0 [0.0, 0.0] | |
| 5.4 Arousal/excitement | 1 | Mean Difference (IV, Fixed, 95% CI) | 0.0 [0.0, 0.0] | |
| 5.5 Completion/orgasm | 1 | Mean Difference (IV, Fixed, 95% CI) | 0.0 [0.0, 0.0] | |
| 6 Dropouts Show forest plot | 5 | 579 | Risk Ratio (M‐H, Fixed, 95% CI) | 1.08 [0.67, 1.72] |
| 7 Endpoint Hamilton Rating Scale for Depression score Show forest plot | 1 | Mean Difference (IV, Fixed, 95% CI) | Totals not selected | |
| 8 Endpoint Clinical Global Impression (CGI ‐ SF) Show forest plot | 2 | 440 | Mean Difference (IV, Fixed, 95% CI) | ‐1.74 [‐1.87, ‐1.61] |
| 8.1 Male | 1 | 227 | Mean Difference (IV, Fixed, 95% CI) | ‐1.5 [‐1.80, ‐1.20] |
| 8.2 Female | 1 | 213 | Mean Difference (IV, Fixed, 95% CI) | ‐1.80 [‐1.95, ‐1.65] |
| 9 Endpoint ASEX Show forest plot | 1 | Mean Difference (IV, Fixed, 95% CI) | Totals not selected | |
| 9.1 Total score | 1 | Mean Difference (IV, Fixed, 95% CI) | 0.0 [0.0, 0.0] | |
| 9.2 Erectile function | 1 | Mean Difference (IV, Fixed, 95% CI) | 0.0 [0.0, 0.0] | |
| 9.3 Sexual desire | 1 | Mean Difference (IV, Fixed, 95% CI) | 0.0 [0.0, 0.0] | |
| 9.4 Arousal | 1 | Mean Difference (IV, Fixed, 95% CI) | 0.0 [0.0, 0.0] | |
| 9.5 Ability to reach orgasm | 1 | Mean Difference (IV, Fixed, 95% CI) | 0.0 [0.0, 0.0] | |
| 9.6 Satisfaction with orgasm | 1 | Mean Difference (IV, Fixed, 95% CI) | 0.0 [0.0, 0.0] | |
| 10 Endpoint EDITS (participant) Show forest plot | 1 | Mean Difference (IV, Fixed, 95% CI) | Totals not selected | |
| 10.1 Total score | 1 | Mean Difference (IV, Fixed, 95% CI) | 0.0 [0.0, 0.0] | |
| 10.2 Overall satisfaction | 1 | Mean Difference (IV, Fixed, 95% CI) | 0.0 [0.0, 0.0] | |
| 10.3 Expectations | 1 | Mean Difference (IV, Fixed, 95% CI) | 0.0 [0.0, 0.0] | |
| 10.4 Likelihood of continuing | 1 | Mean Difference (IV, Fixed, 95% CI) | 0.0 [0.0, 0.0] | |
| 10.5 Confidence | 1 | Mean Difference (IV, Fixed, 95% CI) | 0.0 [0.0, 0.0] | |
| 10.6 Partner satisfaction | 1 | Mean Difference (IV, Fixed, 95% CI) | 0.0 [0.0, 0.0] | |
| 10.7 Partner desire to continue treatment | 1 | Mean Difference (IV, Fixed, 95% CI) | 0.0 [0.0, 0.0] | |
| 10.8 Naturalness of achieving erection | 1 | Mean Difference (IV, Fixed, 95% CI) | 0.0 [0.0, 0.0] | |
| 10.9 Naturalness of erection hardness | 1 | Mean Difference (IV, Fixed, 95% CI) | 0.0 [0.0, 0.0] | |
| 10.10 Quickness of achieving erection | 1 | Mean Difference (IV, Fixed, 95% CI) | 0.0 [0.0, 0.0] | |
| 10.11 Duration that erection lasts | 1 | Mean Difference (IV, Fixed, 95% CI) | 0.0 [0.0, 0.0] | |
| 10.12 Ease of use | 1 | Mean Difference (IV, Fixed, 95% CI) | 0.0 [0.0, 0.0] | |
| 11 Endpoint EDITS (partner) Show forest plot | 1 | Mean Difference (IV, Fixed, 95% CI) | Totals not selected | |
| 11.1 Total score | 1 | Mean Difference (IV, Fixed, 95% CI) | 0.0 [0.0, 0.0] | |
| 11.2 Overall satisfaction | 1 | Mean Difference (IV, Fixed, 95% CI) | 0.0 [0.0, 0.0] | |
| 11.3 Expectations | 1 | Mean Difference (IV, Fixed, 95% CI) | 0.0 [0.0, 0.0] | |
| 11.4 Sexual desirability | 1 | Mean Difference (IV, Fixed, 95% CI) | 0.0 [0.0, 0.0] | |
| 11.5 Participant's feelings about continuing treatment | 1 | Mean Difference (IV, Fixed, 95% CI) | 0.0 [0.0, 0.0] | |
| 11.6 Duration that erection lasts | 1 | Mean Difference (IV, Fixed, 95% CI) | 0.0 [0.0, 0.0] | |
| Outcome or subgroup title | No. of studies | No. of participants | Statistical method | Effect size |
| 1 Re‐emergence of antidepressant‐induced sexual dysfunction (physician rated) Show forest plot | 1 | Risk Ratio (M‐H, Fixed, 95% CI) | Totals not selected | |
| 1.1 Week 1 | 1 | Risk Ratio (M‐H, Fixed, 95% CI) | 0.0 [0.0, 0.0] | |
| 1.2 Endpoint | 1 | Risk Ratio (M‐H, Fixed, 95% CI) | 0.0 [0.0, 0.0] | |
| 2 Overall degree of sexual satisfaction (participant rated) Show forest plot | 1 | Mean Difference (IV, Fixed, 95% CI) | Totals not selected | |
| 2.1 Baseline | 1 | Mean Difference (IV, Fixed, 95% CI) | 0.0 [0.0, 0.0] | |
| 2.2 Week 8 | 1 | Mean Difference (IV, Fixed, 95% CI) | 0.0 [0.0, 0.0] | |
| 2.3 Last rating recorded | 1 | Mean Difference (IV, Fixed, 95% CI) | 0.0 [0.0, 0.0] | |
| 3 Dropouts Show forest plot | 1 | Risk Ratio (M‐H, Fixed, 95% CI) | Totals not selected | |
| 3.1 Overall | 1 | Risk Ratio (M‐H, Fixed, 95% CI) | 0.0 [0.0, 0.0] | |
| 3.2 Attributed to adverse effects | 1 | Risk Ratio (M‐H, Fixed, 95% CI) | 0.0 [0.0, 0.0] | |
| 4 Hamilton Rating Scale for Depression score Show forest plot | 1 | Mean Difference (IV, Fixed, 95% CI) | Totals not selected | |
| 4.1 Baseline | 1 | Mean Difference (IV, Fixed, 95% CI) | 0.0 [0.0, 0.0] | |
| 4.2 Week 8 | 1 | Mean Difference (IV, Fixed, 95% CI) | 0.0 [0.0, 0.0] | |
| Outcome or subgroup title | No. of studies | No. of participants | Statistical method | Effect size |
| 1 Endpoint sexual function ratings (investigator questionnaire) Show forest plot | 1 | Mean Difference (IV, Fixed, 95% CI) | Totals not selected | |
| 1.1 Sexual desire | 1 | Mean Difference (IV, Fixed, 95% CI) | 0.0 [0.0, 0.0] | |
| 1.2 Overall sexual function | 1 | Mean Difference (IV, Fixed, 95% CI) | 0.0 [0.0, 0.0] | |
| 1.3 Erection maintenance time | 1 | Mean Difference (IV, Fixed, 95% CI) | 0.0 [0.0, 0.0] | |
| 1.4 Orgasm frequency | 1 | Mean Difference (IV, Fixed, 95% CI) | 0.0 [0.0, 0.0] | |
| 1.5 Satisfaction to orgasm | 1 | Mean Difference (IV, Fixed, 95% CI) | 0.0 [0.0, 0.0] | |
| 2 Sexual Dysfunction Scale (investigator developed) Show forest plot | 1 | Mean Difference (IV, Fixed, 95% CI) | Totals not selected | |
| 2.1 Baseline | 1 | Mean Difference (IV, Fixed, 95% CI) | 0.0 [0.0, 0.0] | |
| 2.2 Week 12 | 1 | Mean Difference (IV, Fixed, 95% CI) | 0.0 [0.0, 0.0] | |
| 3 Dropouts Show forest plot | 1 | Risk Ratio (M‐H, Fixed, 95% CI) | Totals not selected | |
| Outcome or subgroup title | No. of studies | No. of participants | Statistical method | Effect size |
| 1 Change from baseline on Sexual Side Effects Scale (SSES) total score Show forest plot | 1 | Mean Difference (IV, Fixed, 95% CI) | Totals not selected | |
| 2 Endpoint Feiger Sexual Function and Satisfaction Questionnaire score Show forest plot | 1 | Mean Difference (IV, Fixed, 95% CI) | Totals not selected | |
| 2.1 Total score | 1 | Mean Difference (IV, Fixed, 95% CI) | 0.0 [0.0, 0.0] | |
| 2.2 Item 1 | 1 | Mean Difference (IV, Fixed, 95% CI) | 0.0 [0.0, 0.0] | |
| 2.3 Item 2 | 1 | Mean Difference (IV, Fixed, 95% CI) | 0.0 [0.0, 0.0] | |
| 2.4 Item 3 | 1 | Mean Difference (IV, Fixed, 95% CI) | 0.0 [0.0, 0.0] | |
| 2.5 Item 4 | 1 | Mean Difference (IV, Fixed, 95% CI) | 0.0 [0.0, 0.0] | |
| 2.6 Item 5 | 1 | Mean Difference (IV, Fixed, 95% CI) | 0.0 [0.0, 0.0] | |
| 2.7 Item 6 | 1 | Mean Difference (IV, Fixed, 95% CI) | 0.0 [0.0, 0.0] | |
| 3 Endpoint Arizona Sexual Experience Scale (ASEX) score Show forest plot | 1 | Mean Difference (IV, Fixed, 95% CI) | Totals not selected | |
| 3.1 Total score | 1 | Mean Difference (IV, Fixed, 95% CI) | 0.0 [0.0, 0.0] | |
| 3.2 Sexual desire | 1 | Mean Difference (IV, Fixed, 95% CI) | 0.0 [0.0, 0.0] | |
| 3.3 Arousal | 1 | Mean Difference (IV, Fixed, 95% CI) | 0.0 [0.0, 0.0] | |
| 3.4 Lubrication | 1 | Mean Difference (IV, Fixed, 95% CI) | 0.0 [0.0, 0.0] | |
| 3.5 Orgasm (ability) | 1 | Mean Difference (IV, Fixed, 95% CI) | 0.0 [0.0, 0.0] | |
| 3.6 Orgasm (satisfaction) | 1 | Mean Difference (IV, Fixed, 95% CI) | 0.0 [0.0, 0.0] | |
| 4 Dropouts Show forest plot | 1 | Risk Ratio (M‐H, Fixed, 95% CI) | Totals not selected | |
| 5 Recurrence of mood symptoms Show forest plot | 1 | 43 | Risk Ratio (M‐H, Fixed, 95% CI) | 2.87 [0.12, 66.75] |
| Outcome or subgroup title | No. of studies | No. of participants | Statistical method | Effect size |
| 1 Absence of sexual dysfunction at end point Show forest plot | 1 | 266 | Risk Ratio (M‐H, Fixed, 95% CI) | 1.24 [0.86, 1.77] |
| 2 'Improved' or 'much improved' on Clinical Global Impression Show forest plot | 1 | 266 | Risk Ratio (M‐H, Fixed, 95% CI) | 1.24 [0.71, 2.17] |
| 3 Change in Arizona Sexual Experiences Scale (ASEX) item scores Show forest plot | 1 | 1264 | Mean Difference (IV, Fixed, 95% CI) | ‐0.07 [‐0.19, 0.05] |
| 3.1 How strong is your sexual drive? | 1 | 255 | Mean Difference (IV, Fixed, 95% CI) | ‐0.10 [‐0.36, 0.16] |
| 3.2 How easily are you sexually aroused? | 1 | 253 | Mean Difference (IV, Fixed, 95% CI) | ‐0.20 [‐0.47, 0.07] |
| 3.3 Females: how easily does your vagina become moist or wet? | 1 | 180 | Mean Difference (IV, Fixed, 95% CI) | 0.10 [‐0.22, 0.42] |
| 3.4 Males: can you easily get and keep an erection? | 1 | 72 | Mean Difference (IV, Fixed, 95% CI) | ‐0.4 [‐0.80, 0.00] |
| 3.5 How easily can you reach orgasm? | 1 | 252 | Mean Difference (IV, Fixed, 95% CI) | 0.0 [‐0.28, 0.28] |
| 3.6 Are your orgasms satisfying? | 1 | 252 | Mean Difference (IV, Fixed, 95% CI) | 0.10 [‐0.22, 0.42] |
| 4 Dropouts Show forest plot | 1 | 532 | Risk Ratio (M‐H, Fixed, 95% CI) | 1.19 [0.73, 1.93] |
| 4.1 Total | 1 | 266 | Risk Ratio (M‐H, Fixed, 95% CI) | 0.97 [0.56, 1.68] |
| 4.2 Attributed to adverse effects | 1 | 266 | Risk Ratio (M‐H, Fixed, 95% CI) | 2.32 [0.75, 7.21] |
| Outcome or subgroup title | No. of studies | No. of participants | Statistical method | Effect size |
| 1 Change in patient‐rated visual analogue scales Show forest plot | 1 | Mean Difference (IV, Fixed, 95% CI) | Subtotals only | |
| 1.1 Overall function (total of interest, lubrication, orgasm, pleasure) | 1 | 39 | Mean Difference (IV, Fixed, 95% CI) | 3.10 [‐38.33, 44.53] |
| 1.2 Mood | 1 | 39 | Mean Difference (IV, Fixed, 95% CI) | 0.80 [‐7.61, 9.21] |
| 1.3 Energy | 1 | 39 | Mean Difference (IV, Fixed, 95% CI) | 5.30 [‐3.88, 14.48] |
| 1.4 Interest/desire | 1 | 39 | Mean Difference (IV, Fixed, 95% CI) | 2.70 [‐7.99, 13.39] |
| 1.5 Lubrication | 1 | 39 | Mean Difference (IV, Fixed, 95% CI) | 9.90 [‐3.65, 23.45] |
| 1.6 Orgasm | 1 | 39 | Mean Difference (IV, Fixed, 95% CI) | ‐6.3 [‐19.98, 7.38] |
| 1.7 Pleasure | 1 | 39 | Mean Difference (IV, Fixed, 95% CI) | ‐3.20 [‐15.53, 9.13] |
| 1.8 Discomfort | 1 | 39 | Mean Difference (IV, Fixed, 95% CI) | 7.00 [‐3.15, 17.15] |
| 2 Dropouts Show forest plot | 1 | Risk Ratio (M‐H, Fixed, 95% CI) | Totals not selected | |
| Outcome or subgroup title | No. of studies | No. of participants | Statistical method | Effect size |
| 1 Visual analogue scale of orgasmic function ‐ best score achieved Show forest plot | 1 | Mean Difference (IV, Fixed, 95% CI) | Totals not selected | |
| Outcome or subgroup title | No. of studies | No. of participants | Statistical method | Effect size |
| 1 Change in patient rated assessment of sexual function Show forest plot | 1 | Mean Difference (IV, Fixed, 95% CI) | Totals not selected | |
| 1.1 Overall satisfaction | 1 | Mean Difference (IV, Fixed, 95% CI) | 0.0 [0.0, 0.0] | |
| 1.2 Sexual interest | 1 | Mean Difference (IV, Fixed, 95% CI) | 0.0 [0.0, 0.0] | |
| 1.3 Psychological arousal | 1 | Mean Difference (IV, Fixed, 95% CI) | 0.0 [0.0, 0.0] | |
| 1.4 Lubrication | 1 | Mean Difference (IV, Fixed, 95% CI) | 0.0 [0.0, 0.0] | |
| 1.5 Orgasm | 1 | Mean Difference (IV, Fixed, 95% CI) | 0.0 [0.0, 0.0] | |
| 2 Change in diary ratings (visual analogue scales) Show forest plot | 1 | Mean Difference (IV, Fixed, 95% CI) | Totals not selected | |
| 2.1 Overall sexual function | 1 | Mean Difference (IV, Fixed, 95% CI) | 0.0 [0.0, 0.0] | |
| 2.2 Mood | 1 | Mean Difference (IV, Fixed, 95% CI) | 0.0 [0.0, 0.0] | |
| 2.3 Energy | 1 | Mean Difference (IV, Fixed, 95% CI) | 0.0 [0.0, 0.0] | |
| 2.4 Sexual interest | 1 | Mean Difference (IV, Fixed, 95% CI) | 0.0 [0.0, 0.0] | |
| 2.5 Psychological arousal | 1 | Mean Difference (IV, Fixed, 95% CI) | 0.0 [0.0, 0.0] | |
| 2.6 Physical arousal | 1 | Mean Difference (IV, Fixed, 95% CI) | 0.0 [0.0, 0.0] | |
| 2.7 Orgasm | 1 | Mean Difference (IV, Fixed, 95% CI) | 0.0 [0.0, 0.0] | |
| 2.8 Pleasure/enjoyment | 1 | Mean Difference (IV, Fixed, 95% CI) | 0.0 [0.0, 0.0] | |
| 2.9 Discomfort | 1 | Mean Difference (IV, Fixed, 95% CI) | 0.0 [0.0, 0.0] | |
| 3 Dropouts due to adverse effects Show forest plot | 1 | Risk Ratio (M‐H, Fixed, 95% CI) | Totals not selected | |
| Outcome or subgroup title | No. of studies | No. of participants | Statistical method | Effect size |
| 1 Change in patient rated assessment of sexual function Show forest plot | 1 | Mean Difference (IV, Fixed, 95% CI) | Totals not selected | |
| 1.1 Overall satisfaction | 1 | Mean Difference (IV, Fixed, 95% CI) | 0.0 [0.0, 0.0] | |
| 1.2 Sexual interest | 1 | Mean Difference (IV, Fixed, 95% CI) | 0.0 [0.0, 0.0] | |
| 1.3 Psychological arousal | 1 | Mean Difference (IV, Fixed, 95% CI) | 0.0 [0.0, 0.0] | |
| 1.4 Lubrication | 1 | Mean Difference (IV, Fixed, 95% CI) | 0.0 [0.0, 0.0] | |
| 1.5 Orgasm | 1 | Mean Difference (IV, Fixed, 95% CI) | 0.0 [0.0, 0.0] | |
| 2 Change in diary ratings (visual analogue scales) Show forest plot | 1 | Mean Difference (IV, Fixed, 95% CI) | Totals not selected | |
| 2.1 Overall sexual function | 1 | Mean Difference (IV, Fixed, 95% CI) | 0.0 [0.0, 0.0] | |
| 2.2 Mood | 1 | Mean Difference (IV, Fixed, 95% CI) | 0.0 [0.0, 0.0] | |
| 2.3 Energy | 1 | Mean Difference (IV, Fixed, 95% CI) | 0.0 [0.0, 0.0] | |
| 2.4 Sexual interest | 1 | Mean Difference (IV, Fixed, 95% CI) | 0.0 [0.0, 0.0] | |
| 2.5 Psychological arousal | 1 | Mean Difference (IV, Fixed, 95% CI) | 0.0 [0.0, 0.0] | |
| 2.6 Physical arousal | 1 | Mean Difference (IV, Fixed, 95% CI) | 0.0 [0.0, 0.0] | |
| 2.7 Orgasm | 1 | Mean Difference (IV, Fixed, 95% CI) | 0.0 [0.0, 0.0] | |
| 2.8 Pleasure/enjoyment | 1 | Mean Difference (IV, Fixed, 95% CI) | 0.0 [0.0, 0.0] | |
| 2.9 Discomfort | 1 | Mean Difference (IV, Fixed, 95% CI) | 0.0 [0.0, 0.0] | |
| 3 Endpoint modified Kinsey Structured Interview Show forest plot | 1 | 75 | Mean Difference (IV, Fixed, 95% CI) | 0.60 [0.19, 1.01] |
| 3.1 Sexual satisfaction | 1 | 75 | Mean Difference (IV, Fixed, 95% CI) | 0.60 [0.19, 1.01] |
| 4 Dropouts Show forest plot | 1 | Risk Ratio (M‐H, Fixed, 95% CI) | Totals not selected | |
| 4.1 Attributed to adverse effects | 1 | Risk Ratio (M‐H, Fixed, 95% CI) | 0.0 [0.0, 0.0] | |
| Outcome or subgroup title | No. of studies | No. of participants | Statistical method | Effect size |
| 1 Change in patient rated assessment of sexual function Show forest plot | 1 | Mean Difference (IV, Fixed, 95% CI) | Totals not selected | |
| 1.1 Overall satisfaction | 1 | Mean Difference (IV, Fixed, 95% CI) | 0.0 [0.0, 0.0] | |
| 1.2 Sexual interest | 1 | Mean Difference (IV, Fixed, 95% CI) | 0.0 [0.0, 0.0] | |
| 1.3 Psychological arousal | 1 | Mean Difference (IV, Fixed, 95% CI) | 0.0 [0.0, 0.0] | |
| 1.4 Lubrication | 1 | Mean Difference (IV, Fixed, 95% CI) | 0.0 [0.0, 0.0] | |
| 1.5 Orgasm | 1 | Mean Difference (IV, Fixed, 95% CI) | 0.0 [0.0, 0.0] | |
| 2 Change in diary ratings (visual analogue scales) Show forest plot | 1 | Mean Difference (IV, Fixed, 95% CI) | Totals not selected | |
| 2.1 Overall sexual function | 1 | Mean Difference (IV, Fixed, 95% CI) | 0.0 [0.0, 0.0] | |
| 2.2 Mood | 1 | Mean Difference (IV, Fixed, 95% CI) | 0.0 [0.0, 0.0] | |
| 2.3 Energy | 1 | Mean Difference (IV, Fixed, 95% CI) | 0.0 [0.0, 0.0] | |
| 2.4 Sexual interest | 1 | Mean Difference (IV, Fixed, 95% CI) | 0.0 [0.0, 0.0] | |
| 2.5 Psychological arousal | 1 | Mean Difference (IV, Fixed, 95% CI) | 0.0 [0.0, 0.0] | |
| 2.6 Physical arousal | 1 | Mean Difference (IV, Fixed, 95% CI) | 0.0 [0.0, 0.0] | |
| 2.7 Orgasm | 1 | Mean Difference (IV, Fixed, 95% CI) | 0.0 [0.0, 0.0] | |
| 2.8 Pleasure/enjoyment | 1 | Mean Difference (IV, Fixed, 95% CI) | 0.0 [0.0, 0.0] | |
| 2.9 Discomfort | 1 | Mean Difference (IV, Fixed, 95% CI) | 0.0 [0.0, 0.0] | |
| 3 Dropouts Show forest plot | 1 | Risk Ratio (M‐H, Fixed, 95% CI) | Totals not selected | |
| 3.1 Attributed to adverse effects | 1 | Risk Ratio (M‐H, Fixed, 95% CI) | 0.0 [0.0, 0.0] | |
| Outcome or subgroup title | No. of studies | No. of participants | Statistical method | Effect size |
| 1 Change in patient‐rated visual analogue scales Show forest plot | 1 | Mean Difference (IV, Fixed, 95% CI) | Subtotals only | |
| 1.1 Overall function (total of interest, lubrication, orgasm, pleasure) | 1 | 38 | Mean Difference (IV, Fixed, 95% CI) | 13.0 [‐29.02, 55.02] |
| 1.2 Mood | 1 | 38 | Mean Difference (IV, Fixed, 95% CI) | 8.1 [1.23, 14.97] |
| 1.3 Energy | 1 | 38 | Mean Difference (IV, Fixed, 95% CI) | 12.7 [5.30, 20.10] |
| 1.4 Interest/desire | 1 | 38 | Mean Difference (IV, Fixed, 95% CI) | 0.90 [‐7.96, 9.76] |
| 1.5 Lubrication | 1 | 38 | Mean Difference (IV, Fixed, 95% CI) | 7.90 [‐5.74, 21.54] |
| 1.6 Orgasm | 1 | 38 | Mean Difference (IV, Fixed, 95% CI) | 2.50 [‐11.91, 16.91] |
| 1.7 Pleasure | 1 | 38 | Mean Difference (IV, Fixed, 95% CI) | 1.70 [‐11.28, 14.68] |
| 1.8 Discomfort | 1 | 38 | Mean Difference (IV, Fixed, 95% CI) | 1.30 [‐11.25, 13.85] |
| 2 Dropouts Show forest plot | 1 | Risk Ratio (M‐H, Fixed, 95% CI) | Totals not selected | |
| Outcome or subgroup title | No. of studies | No. of participants | Statistical method | Effect size |
| 1 Endpoint Brief Index of Sexual Functioning for Women (BISF‐W) Show forest plot | 1 | Mean Difference (IV, Fixed, 95% CI) | Totals not selected | |
| 1.1 Sexual desire | 1 | Mean Difference (IV, Fixed, 95% CI) | 0.0 [0.0, 0.0] | |
| 1.2 Sexual arousability | 1 | Mean Difference (IV, Fixed, 95% CI) | 0.0 [0.0, 0.0] | |
| 1.3 Lack of vaginal lubrication | 1 | Mean Difference (IV, Fixed, 95% CI) | 0.0 [0.0, 0.0] | |
| 1.4 Orgasm ability | 1 | Mean Difference (IV, Fixed, 95% CI) | 0.0 [0.0, 0.0] | |
| 1.5 Orgasm intensity/pleasure | 1 | Mean Difference (IV, Fixed, 95% CI) | 0.0 [0.0, 0.0] | |
| 1.6 Sexual dissatisfaction | 1 | Mean Difference (IV, Fixed, 95% CI) | 0.0 [0.0, 0.0] | |
| Outcome or subgroup title | No. of studies | No. of participants | Statistical method | Effect size |
| 1 Endpoint Arizona Sexual Experiences Scale (ASEX) score Show forest plot | 1 | Mean Difference (IV, Fixed, 95% CI) | Totals not selected | |
| 1.1 Total score | 1 | Mean Difference (IV, Fixed, 95% CI) | 0.0 [0.0, 0.0] | |
| 1.2 Question 1: Sexual desire | 1 | Mean Difference (IV, Fixed, 95% CI) | 0.0 [0.0, 0.0] | |
| 2 Endpoint MGH‐SFQ Show forest plot | 1 | Mean Difference (IV, Fixed, 95% CI) | Totals not selected | |
| 2.1 Total score | 1 | Mean Difference (IV, Fixed, 95% CI) | 0.0 [0.0, 0.0] | |
| 2.2 Item a: Sexual desire | 1 | Mean Difference (IV, Fixed, 95% CI) | 0.0 [0.0, 0.0] | |
| 3 Dropouts Show forest plot | 1 | 20 | Risk Ratio (M‐H, Fixed, 95% CI) | 1.5 [0.60, 3.74] |
| 4 Endpoint ratings of psychiatric symptoms Show forest plot | 1 | Mean Difference (IV, Fixed, 95% CI) | Subtotals only | |
| 4.1 Hamilton Depression Rating Scale | 1 | 16 | Mean Difference (IV, Fixed, 95% CI) | ‐2.5 [‐7.98, 2.98] |
| 4.2 Hamilton Anxiety Rating Scale | 1 | 16 | Mean Difference (IV, Fixed, 95% CI) | ‐0.40 [‐3.15, 2.35] |