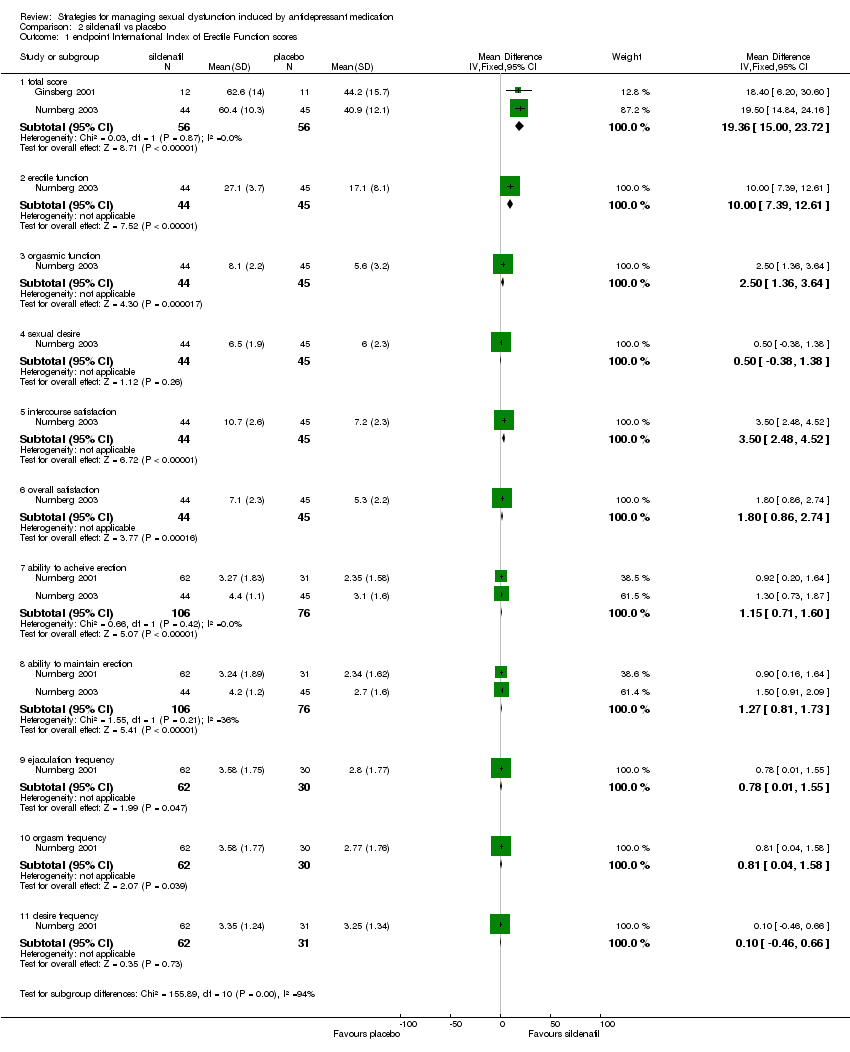
| 1 endpoint International Index of Erectile Function scores Show forest plot | 3 | | Mean Difference (IV, Fixed, 95% CI) | Subtotals only |
|
| 1.1 total score | 2 | 112 | Mean Difference (IV, Fixed, 95% CI) | 19.36 [15.00, 23.72] |
| 1.2 erectile function | 1 | 89 | Mean Difference (IV, Fixed, 95% CI) | 10.0 [7.39, 12.61] |
| 1.3 orgasmic function | 1 | 89 | Mean Difference (IV, Fixed, 95% CI) | 2.5 [1.36, 3.64] |
| 1.4 sexual desire | 1 | 89 | Mean Difference (IV, Fixed, 95% CI) | 0.5 [‐0.38, 1.38] |
| 1.5 intercourse satisfaction | 1 | 89 | Mean Difference (IV, Fixed, 95% CI) | 3.50 [2.48, 4.52] |
| 1.6 overall satisfaction | 1 | 89 | Mean Difference (IV, Fixed, 95% CI) | 1.80 [0.86, 2.74] |
| 1.7 ability to acheive erection | 2 | 182 | Mean Difference (IV, Fixed, 95% CI) | 1.15 [0.71, 1.60] |
| 1.8 ability to maintain erection | 2 | 182 | Mean Difference (IV, Fixed, 95% CI) | 1.27 [0.81, 1.73] |
| 1.9 ejaculation frequency | 1 | 92 | Mean Difference (IV, Fixed, 95% CI) | 0.78 [0.01, 1.55] |
| 1.10 orgasm frequency | 1 | 92 | Mean Difference (IV, Fixed, 95% CI) | 0.81 [0.04, 1.58] |
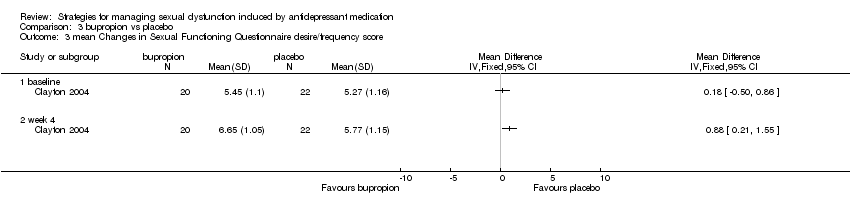
| 1.11 desire frequency | 1 | 93 | Mean Difference (IV, Fixed, 95% CI) | 0.10 [‐0.46, 0.66] |
| 2 endpoint Arizona Sexual Experience Scale scores Show forest plot | 2 | | Mean Difference (IV, Fixed, 95% CI) | Subtotals only |
|
| 2.1 Total score | 2 | 112 | Mean Difference (IV, Fixed, 95% CI) | ‐4.62 [‐6.29, ‐2.95] |
| 2.2 Sexual desire | 1 | 89 | Mean Difference (IV, Fixed, 95% CI) | ‐0.60 [‐1.08, ‐0.12] |
| 2.3 Arousal | 1 | 89 | Mean Difference (IV, Fixed, 95% CI) | ‐0.60 [‐1.06, ‐0.14] |
| 2.4 Erectile function | 1 | 89 | Mean Difference (IV, Fixed, 95% CI) | ‐1.20 [‐1.66, ‐0.74] |
| 2.5 Orgasm (ability) | 1 | 89 | Mean Difference (IV, Fixed, 95% CI) | ‐1.40 [‐1.90, ‐0.90] |
| 2.6 Orgasm (satisfaction) | 1 | 89 | Mean Difference (IV, Fixed, 95% CI) | ‐1.0 [‐1.58, ‐0.42] |
| 3 endpoint MGH‐Sexual Functioning Questionnaire scores Show forest plot | 1 | | Mean Difference (IV, Fixed, 95% CI) | Totals not selected |
|
| 3.1 Total score | 1 | | Mean Difference (IV, Fixed, 95% CI) | 0.0 [0.0, 0.0] |
| 3.2 Sexual desire | 1 | | Mean Difference (IV, Fixed, 95% CI) | 0.0 [0.0, 0.0] |
| 3.3 Arousal | 1 | | Mean Difference (IV, Fixed, 95% CI) | 0.0 [0.0, 0.0] |
| 3.4 Erectile function | 1 | | Mean Difference (IV, Fixed, 95% CI) | 0.0 [0.0, 0.0] |
| 3.5 Orgasm (ability) | 1 | | Mean Difference (IV, Fixed, 95% CI) | 0.0 [0.0, 0.0] |
| 3.6 Overall satisfaction | 1 | | Mean Difference (IV, Fixed, 95% CI) | 0.0 [0.0, 0.0] |
| 4 endpoint Erectile Dysfunction Inventory of Treatment Satisfaction scores Show forest plot | 1 | | Mean Difference (IV, Fixed, 95% CI) | Totals not selected |
|
| 5 Clinical Global Impression ‐Sexual Function not "much/very much improved" by 6 weeks Show forest plot | 1 | | Risk Ratio (M‐H, Fixed, 95% CI) | Totals not selected |
|
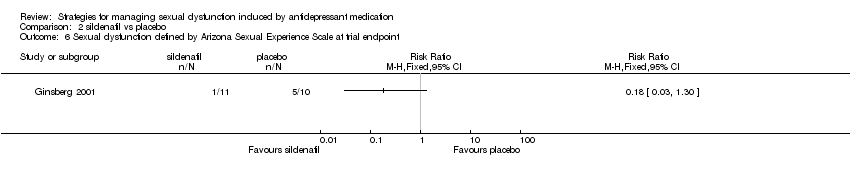
| 6 Sexual dysfunction defined by Arizona Sexual Experience Scale at trial endpoint Show forest plot | 1 | | Risk Ratio (M‐H, Fixed, 95% CI) | Totals not selected |
|
| 7 dropouts Show forest plot | 2 | 113 | Risk Ratio (M‐H, Fixed, 95% CI) | 0.72 [0.28, 1.86] |
|
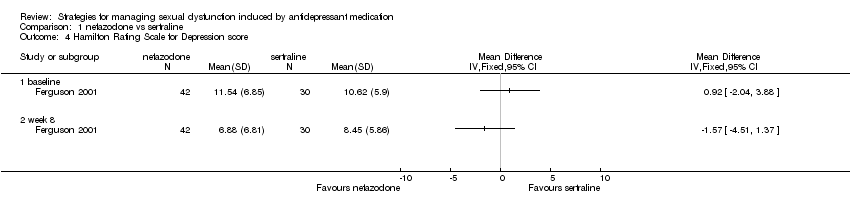
| 8 endpoint Hamilton Rating Scale for Depression score Show forest plot | 1 | | Mean Difference (IV, Fixed, 95% CI) | Totals not selected |
|