Intervenciones basadas en la terapia cognitivoconductual (TCC), la TCC de tercera generación y la terapia interpersonal (TIP) para la prevención de la depresión en niños y adolescentes
Información
- DOI:
- https://doi.org/10.1002/14651858.CD003380.pub4Copiar DOI

- Base de datos:
-
- Cochrane Database of Systematic Reviews
- Versión publicada:
-
- 09 agosto 2016see what's new
- Tipo:
-
- Intervention
- Etapa:
-
- Review
- Grupo Editorial Cochrane:
-
Grupo Cochrane de Trastornos mentales comunes
- Copyright:
-
- Copyright © 2016 The Cochrane Collaboration. Published by John Wiley & Sons, Ltd.
Cifras del artículo
Altmetric:
Citado por:
Autores
Contributions of authors
Sally Merry co‐ordinated the original review and first update, extracted and entered data, ran the analyses, took a lead role in writing the review and has continued to provide input on design and data analysis, and has contributed to the writing of the review.
Sarah Hetrick ran searches, screened trials for inclusion, extracted data and assisted with the write‐up of the original review and first update, and has co‐ordinated this update including guiding methodological updates, extracting and entering all the data, running the analyses and taking a lead role in the writing of the review.
Georgina Cox ran searches, screened trials for inclusion, extracted and entered data and has contributed to the write‐up in this and the previous update of the review.
Julliet Bir screened trials for inclusion, extracted and entered data, checked drafts of the review for the original and previous version of the review, and has assisted with 'Risk of bias' assessment for the majority of the trials included in this current update of the review.
For this update, Katrina Witt screened some trials for inclusion, extracted and entered some data, double‐checked all data, assisted with data analysis and with writing up some aspects of the review, and checked drafts of the review.
Sources of support
Internal sources
-
University of Auckland, New Zealand.
External sources
-
Health Research Council, New Zealand.
Declarations of interest
Professor Merry and Ms J Bir have been involved in a trial of a depression prevention programme (Merry 2004). The results of this trial have been included in this update.
Sarah Hetrick is an invesitgator on a range of trials of interventions for the treatment of youth depression.
None of the other authors have any declarations of interest to declare.
Acknowledgements
There have been a number of people who have made valuable contributions to this review since the first version was prepared. The advice of Prof Philip Hazell is gratefully acknowledged. The 2002 Review Completion Workshop run at the Cochrane Centre in Melbourne was extremely helpful and we would like to thank Dr Sally Green and the centre staff for organising this. We would like to thank Jane Dennis (the previous Managing Editor of CCDAN) and Jessica Sharp (current Managing Editor of CCMD) and other CCMD group staff and editors who have advised us on many aspects of the review over the years. We would like to thank Sarah Dawson (Cochrane Information Specialist) for updating and running the searches for the previous and current version of the review, as well as helping with screening. We have had help from various people with screening and data extraction for the previous and current version of the review including Matt Gillard, Magenta Simmons, Gemma Colhoun, Alysha Simonson, Kate Lovey and Amy Hamington, who contributed to data extraction. For translation of non‐English language papers for this current version of the review we are grateful to Sam Irving, Yusuke Ogawa, Farhad Shokraneh, Katy Sivyer and Abel Toledano. For providing us with pre‐published data, we are grateful to Tolulope Bella‐Awusah.
Nellie Muller contributed to the drafting of the original published protocol but is no longer available to assist with writing the review. Heather McDowell contributed to the original and first update of the review, and Tessa Brudevold‐Iversen to the first update of the review, but they are no longer available to assist. We are very grateful to them as co‐authors of the previous versions.
Version history
| Published | Title | Stage | Authors | Version |
| 2016 Aug 09 | Cognitive behavioural therapy (CBT), third‐wave CBT and interpersonal therapy (IPT) based interventions for preventing depression in children and adolescents | Review | Sarah E Hetrick, Georgina R Cox, Katrina G Witt, Julliet J Bir, Sally N Merry | |
| 2011 Dec 07 | Psychological and educational interventions for preventing depression in children and adolescents | Review | Sally N Merry, Sarah E Hetrick, Georgina R Cox, Tessa Brudevold‐Iversen, Julliet J Bir, Heather McDowell | |
| 2004 Apr 19 | Psychological and/or educational interventions for the prevention of depression in children and adolescents | Review | Sally N Merry, Heather H McDowell, Sarah E Hetrick, Julliet J Bir, N Muller | |
| 2001 Feb 08 | Psychological and/or educational interventions for the prevention of depression in children and adolescents | Review | Sally N Merry, Heather H McDowell, Sarah E Hetrick, Julliet J Bir, N Muller | |
Differences between protocol and review
In the first version of the review, the protocol indicated that uncontrolled and controlled clinical trials, open trials, case‐controlled trials and cohort trials (e.g. Altman 1991; Myles 2000; SIGN 2000) would be included if there were no, very few, or only poor quality RCTs. However, given the large number of RCTs retrieved both for the first version and for this updated version of the review, only RCTs have been included.
In the first update of the review, we excluded general adjustment, academic/work function, social adjustment, cognitive style and suicidal ideation/attempts outcomes given the paucity of data that existed for these outcomes. In this version of the review we have included clinician‐rated depression symptoms as a secondary outcome and have specified that the primary outcome of depression symptoms will be measured using validated self‐report measures. We added the clinician‐rated depression symptom outcome because while the majority of trials use self‐rated measures, a good minority of trials now included also used a clinician‐rated measure and it is important to assess the impact on depression according to different raters. We have been able to reinstate our early outcomes related to functioning but have only included general functioning, again due to paucity of outcomes for more specific categories of functioning. We have also now included anxiety because of the high co‐morbidity between depression and anxiety.
Assessment of the risk of bias was first updated in the previous update of the review and has been updated again in line with new guidance.
We made the decision prior to this version of the review to consider effect sizes of 0.20 or less as small, effect sizes that approached 0.30 as medium and effect sizes that approached 0.50 as large.
In this update of the review, we have aimed to have a more homogeneous group of included studies and thus have altered the inclusion criteria in the following ways:
We have only included psychological interventions (rather than educational).
We have only included evidence‐based psychological interventions; the vast majority of studies in the previous versions of this review were CBT‐based and continue to be so. Evidence‐based interventions also include IPT interventions and we have included third wave CBT interventions.
Given the lack of significant findings with regard to gender and risk group, we have not undertaken subgroup analysis for these variables. We sought in this review to further the field of depression prevention by seeking to explore which of the many depression prevention programmes might be the most useful and this concentrated our subgroup analysis on how the populations for these trials were selected (universal, targeted: indicated and selected). Our meta‐regression complemented this by looking at other salient features of the interventions that might impact on efficacy. Our other main concern was with regard to the important issue of comparison group, which time and time again has been shown to have an impact on effect sizes (e.g. Weisz 2006). Thus we introduced a new subgroup analysis to investigate this.
Notes
During the course of this review update the authors have recognised that the review topic might now be better addressed in a series of separate intervention‐specific reviews, including, but not limited to, a review of psychoeducation and education programmes for preventing depression in children and adolescents, a review of prevention trials undertaken in the aftermath of trauma and a review of trials where the primary aim is the prevention of anxiety.
Keywords
MeSH
Medical Subject Headings (MeSH) Keywords
Medical Subject Headings Check Words
Adolescent; Child; Child, Preschool; Female; Humans; Male; Young Adult;
PICO

'Risk of bias' graph: Review authors' judgements about each risk of bias item presented as percentages across all included studies.
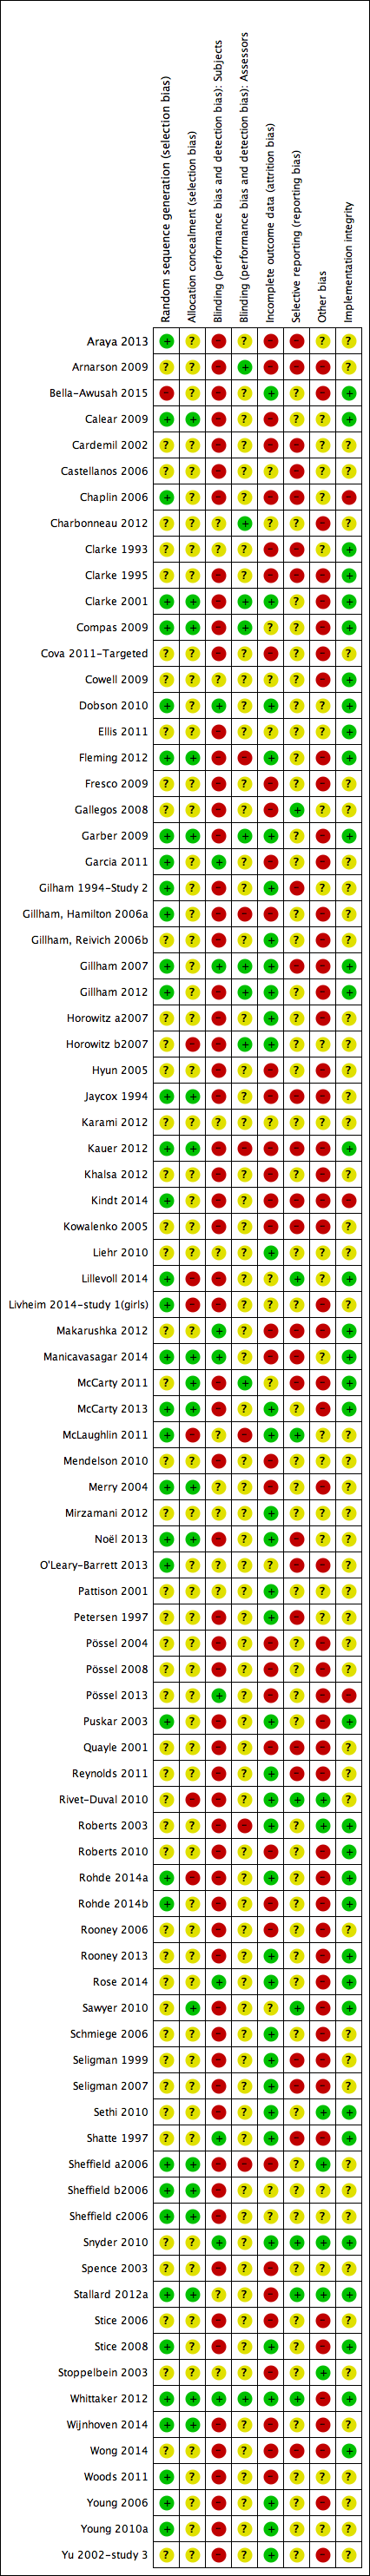
'Risk of bias' summary: review authors' judgements about each risk of bias item for each included study.
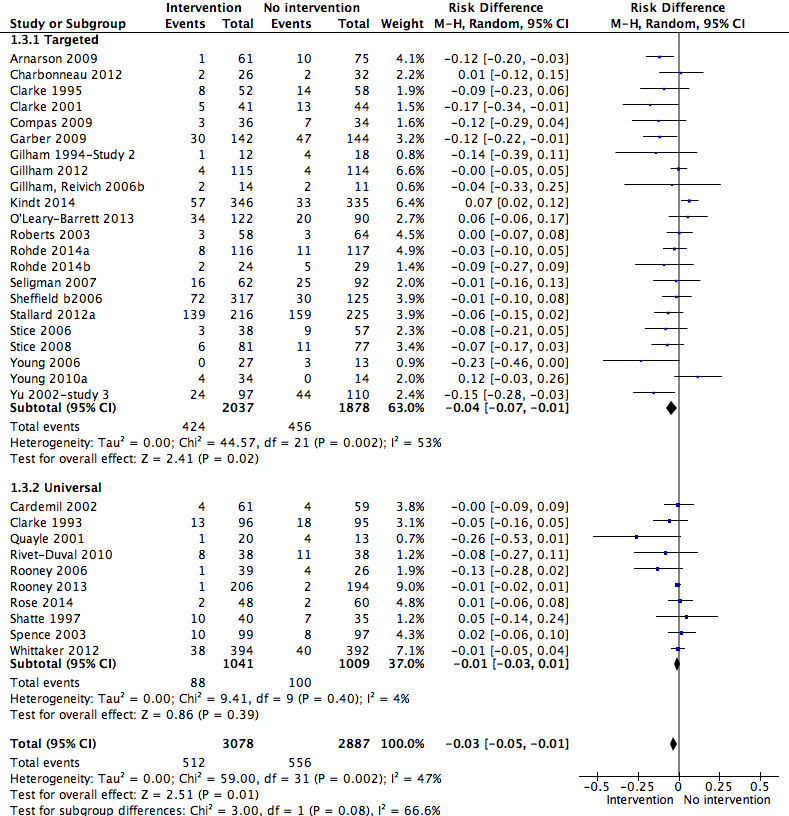
Forest plot of comparison: 1 Psychological intervention versus any comparison post‐intervention, outcome: 1.3 Depressive disorder medium‐term follow‐up (primary outcomes).
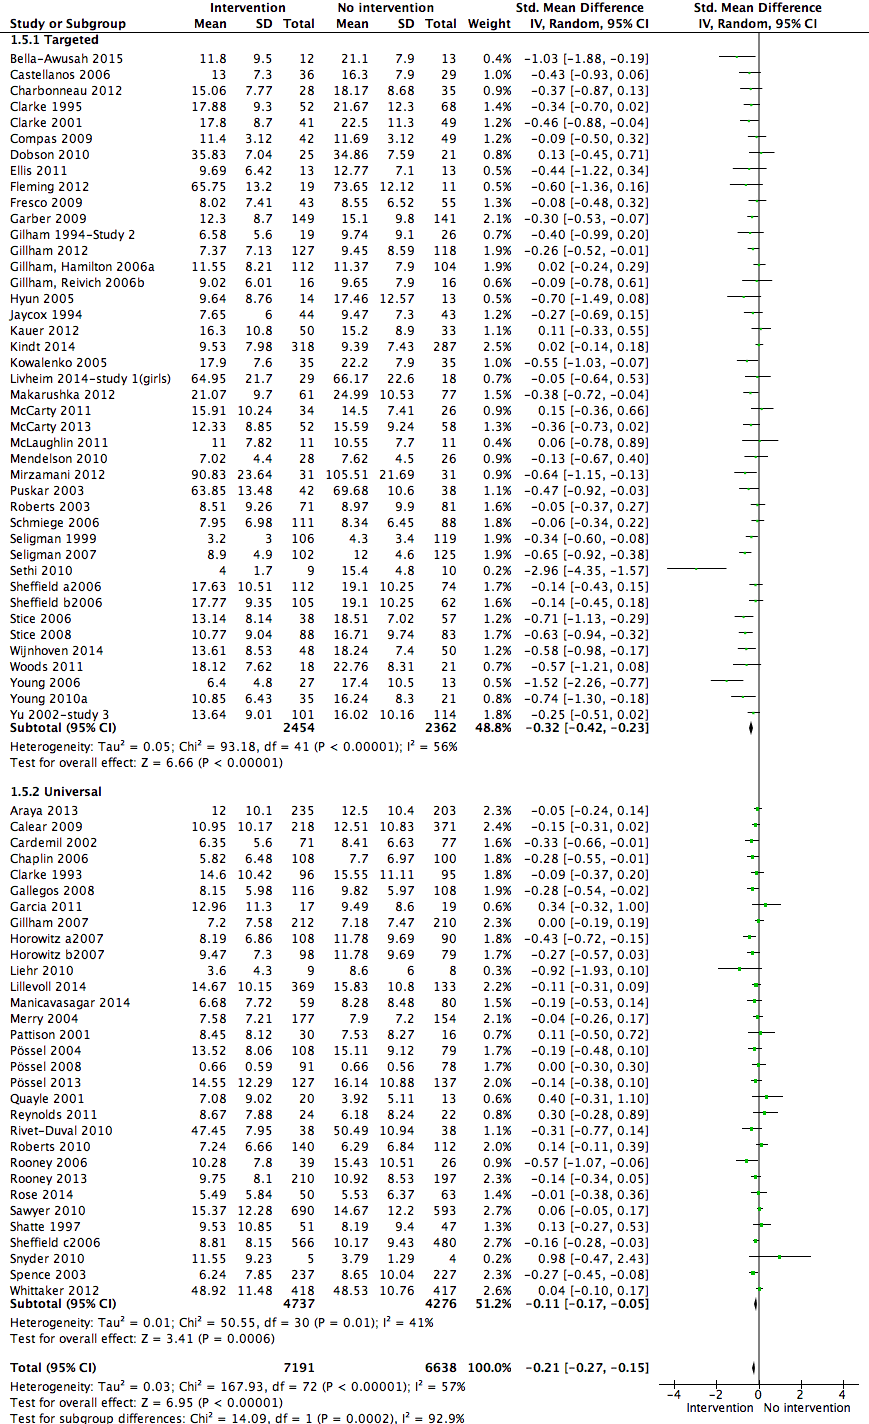
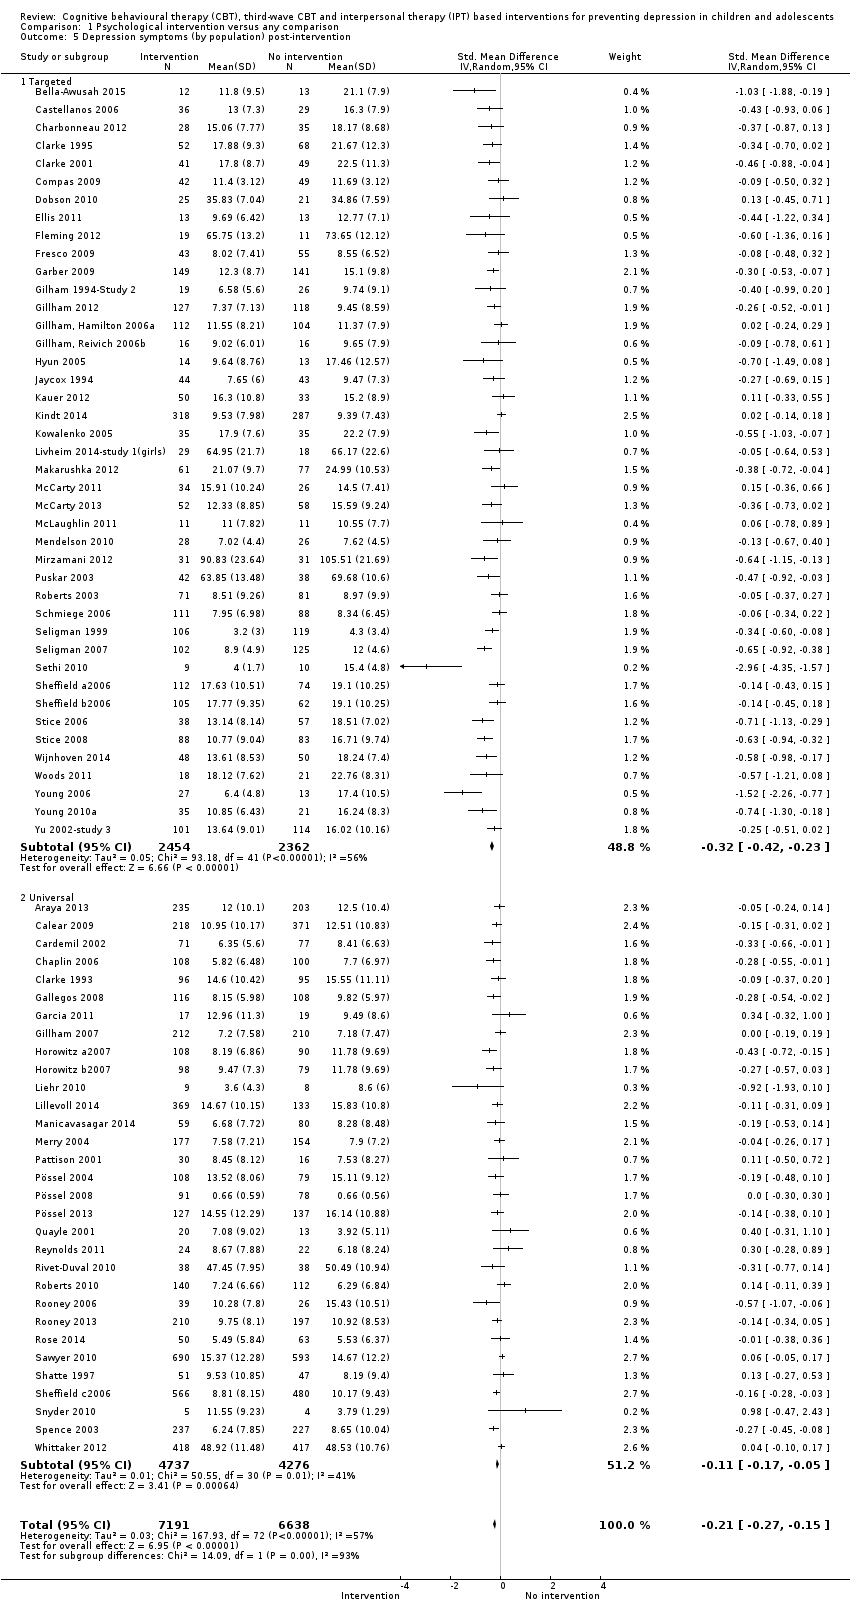
Forest plot of comparison: 1 Psychological intervention versus any comparison post‐intervention, outcome: 1.5 Depression scores (self‐report) post‐intervention follow‐up (primary outcome).
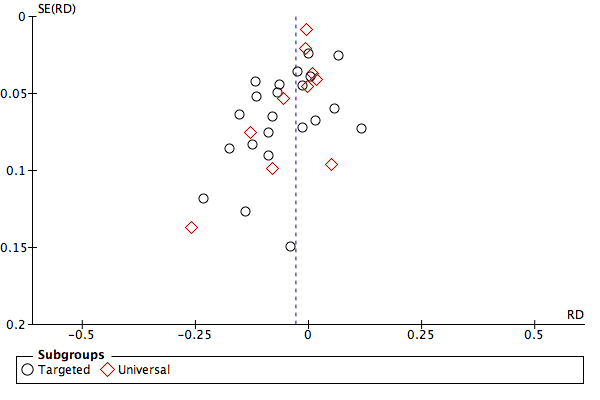
Funnel plot of analysis 1.4: Psychological intervention versus any comparison post‐intervention for depressive disorder at the medium‐term follow‐up.

Funnel plot of analysis 1.6: Psychological intervention versus any comparison post‐intervention for depression scores at the post‐intervention assessment.

Comparison 1 Psychological intervention versus any comparison, Outcome 1 Depressive diagnosis (by population) post‐intervention.

Comparison 1 Psychological intervention versus any comparison, Outcome 2 Depressive diagnosis short‐term follow‐up.
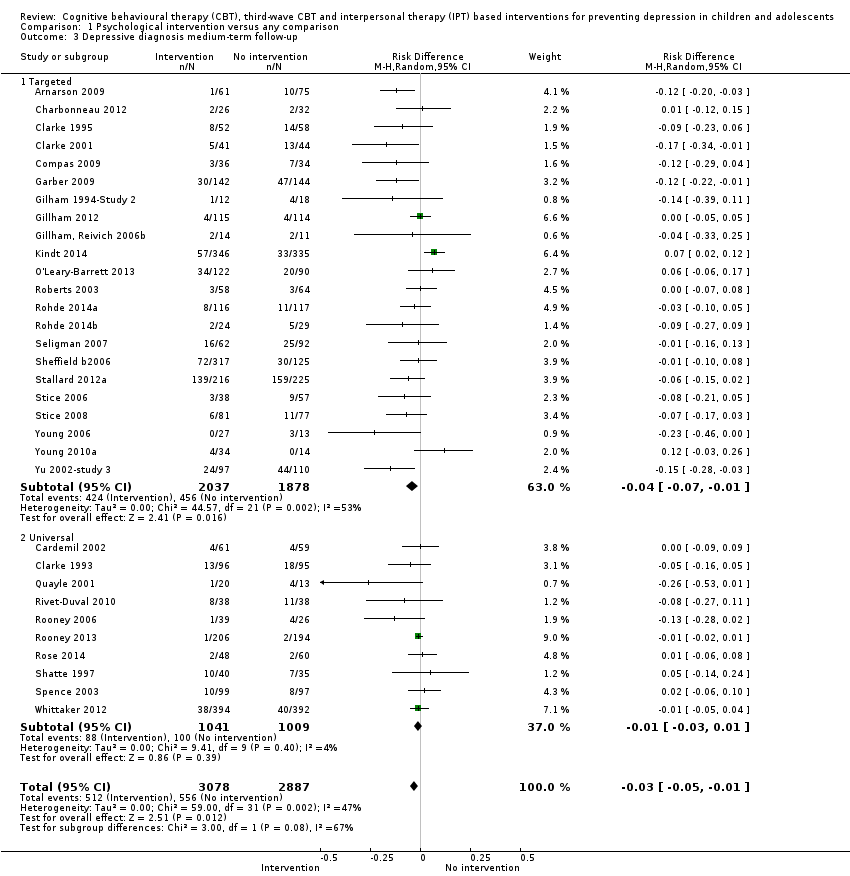
Comparison 1 Psychological intervention versus any comparison, Outcome 3 Depressive diagnosis medium‐term follow‐up.
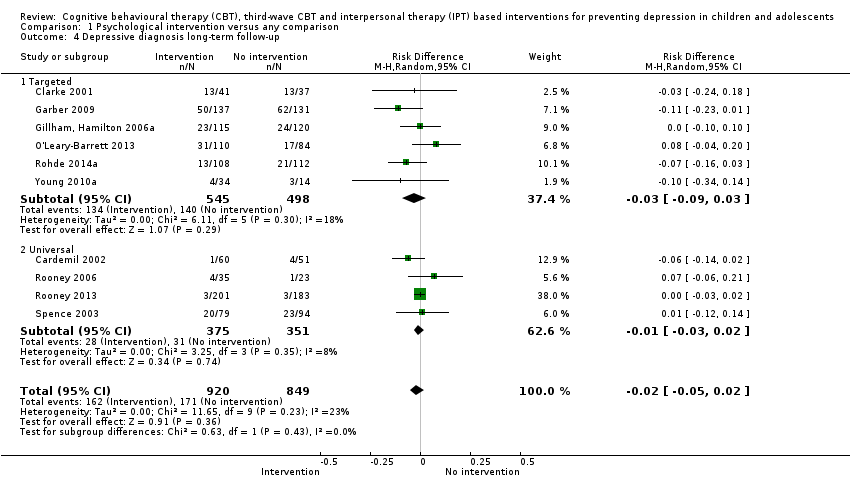
Comparison 1 Psychological intervention versus any comparison, Outcome 4 Depressive diagnosis long‐term follow‐up.
Comparison 1 Psychological intervention versus any comparison, Outcome 5 Depression symptoms (by population) post‐intervention.
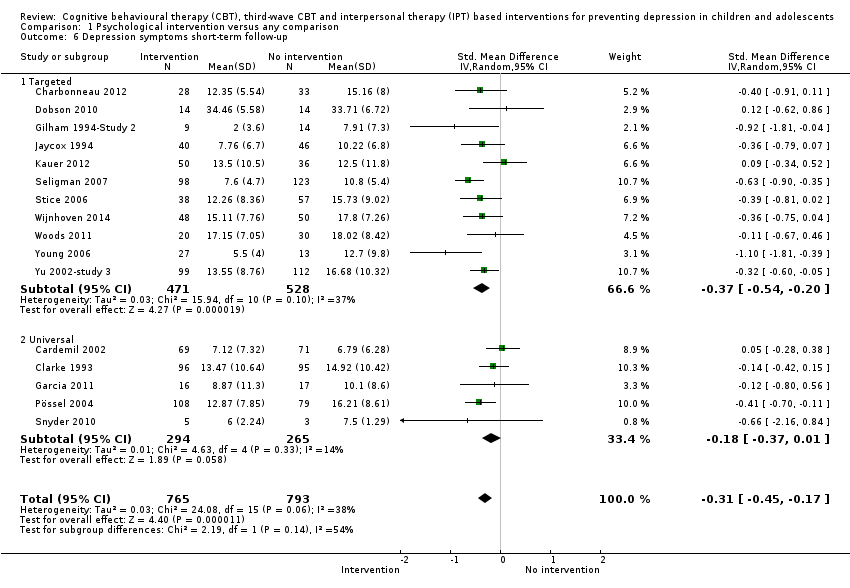
Comparison 1 Psychological intervention versus any comparison, Outcome 6 Depression symptoms short‐term follow‐up.

Comparison 1 Psychological intervention versus any comparison, Outcome 7 Depression symptoms medium‐term follow‐up.

Comparison 1 Psychological intervention versus any comparison, Outcome 8 Depression symptoms long‐term follow‐up.

Comparison 1 Psychological intervention versus any comparison, Outcome 9 Depression symptoms clinician‐rated (by population) post‐intervention.

Comparison 1 Psychological intervention versus any comparison, Outcome 10 Depression symptoms clinician‐rated medium‐term follow‐up.
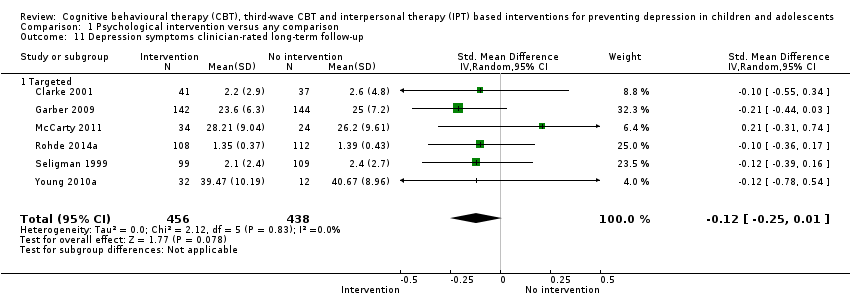
Comparison 1 Psychological intervention versus any comparison, Outcome 11 Depression symptoms clinician‐rated long‐term follow‐up.

Comparison 1 Psychological intervention versus any comparison, Outcome 12 Anxiety symptoms (by population) post‐intervention.

Comparison 1 Psychological intervention versus any comparison, Outcome 13 Anxiety symptoms (by population) short‐term follow‐up.
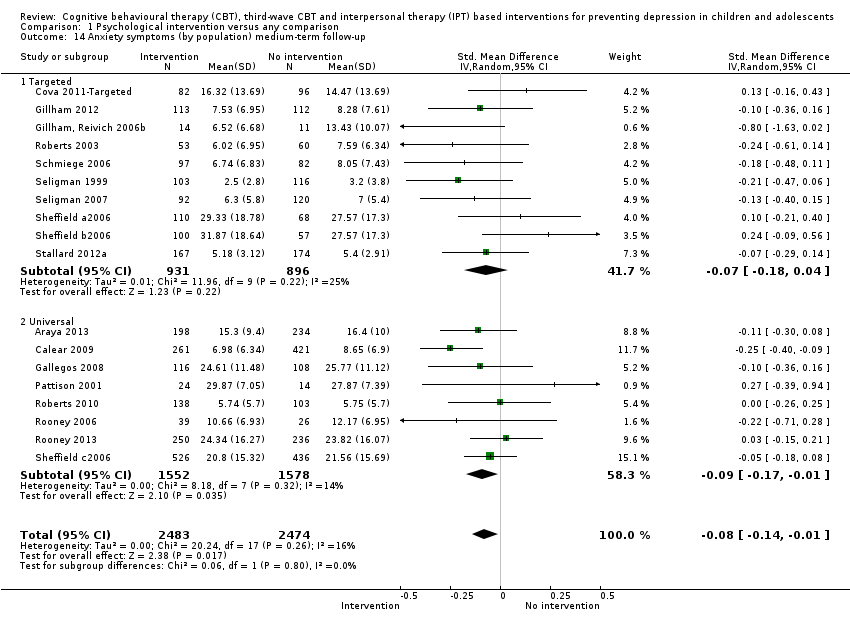
Comparison 1 Psychological intervention versus any comparison, Outcome 14 Anxiety symptoms (by population) medium‐term follow‐up.
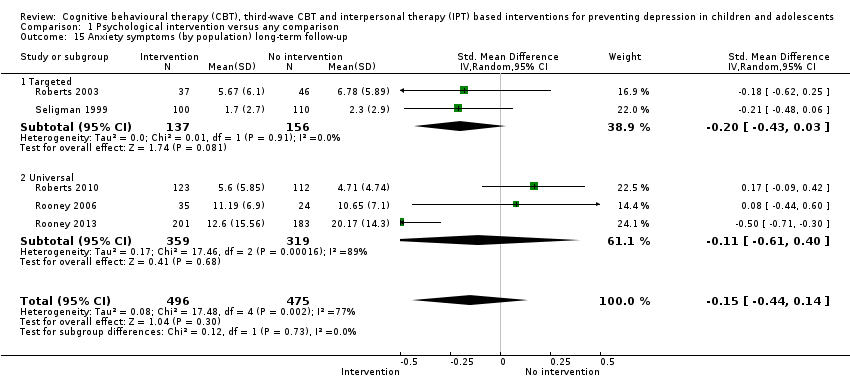
Comparison 1 Psychological intervention versus any comparison, Outcome 15 Anxiety symptoms (by population) long‐term follow‐up.
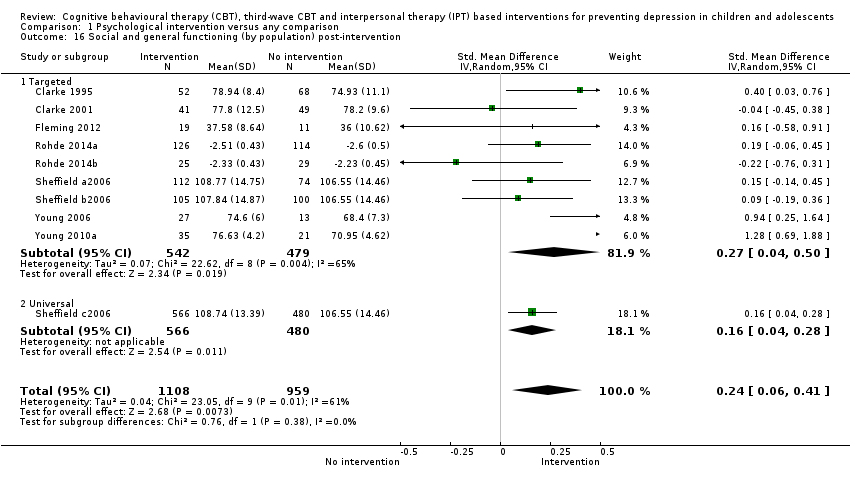
Comparison 1 Psychological intervention versus any comparison, Outcome 16 Social and general functioning (by population) post‐intervention.

Comparison 1 Psychological intervention versus any comparison, Outcome 17 Social and general functioning (by population) short‐term follow‐up.

Comparison 1 Psychological intervention versus any comparison, Outcome 18 Social and general functioning (by population) medium‐term follow‐up.

Comparison 1 Psychological intervention versus any comparison, Outcome 19 Social and general functioning (by population) long‐term follow‐up.

Comparison 2 Psychological intervention versus any comparison for targeted interventions, Outcome 1 Depressive diagnosis medium‐term follow‐up.

Comparison 2 Psychological intervention versus any comparison for targeted interventions, Outcome 2 Depression symptoms post‐intervention.
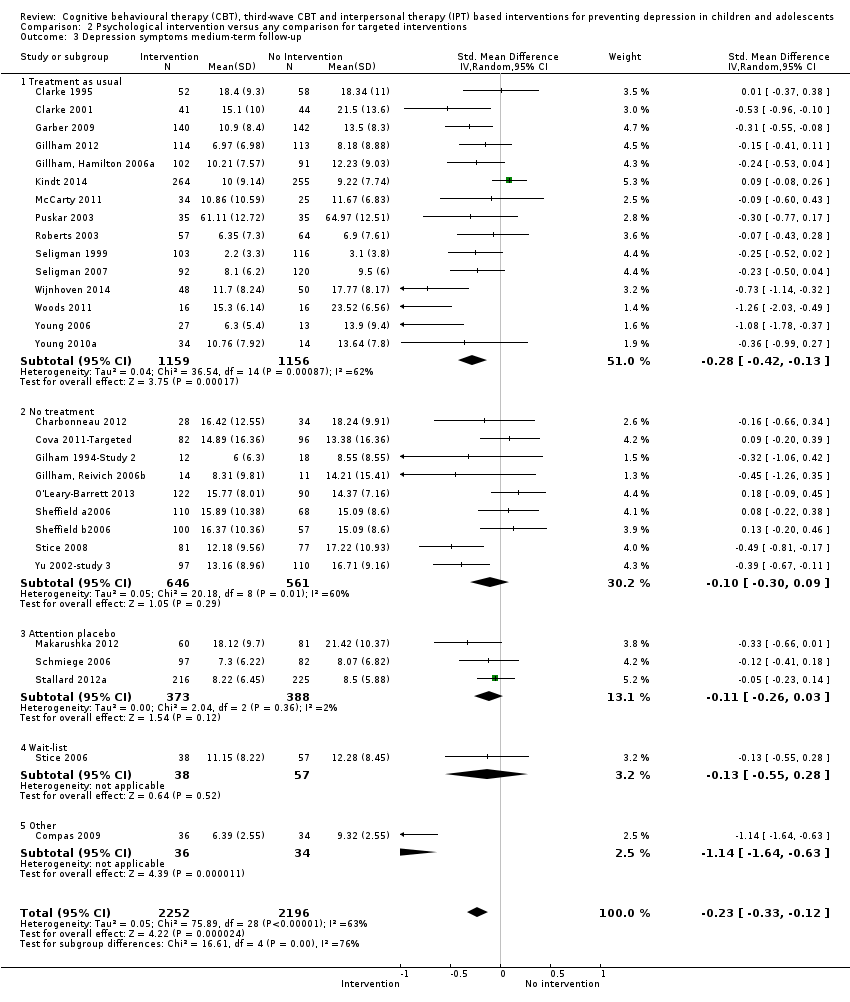
Comparison 2 Psychological intervention versus any comparison for targeted interventions, Outcome 3 Depression symptoms medium‐term follow‐up.

Comparison 3 Psychological intervention versus any comparison for universal interventions, Outcome 1 Depressive diagnosis medium‐term follow‐up.
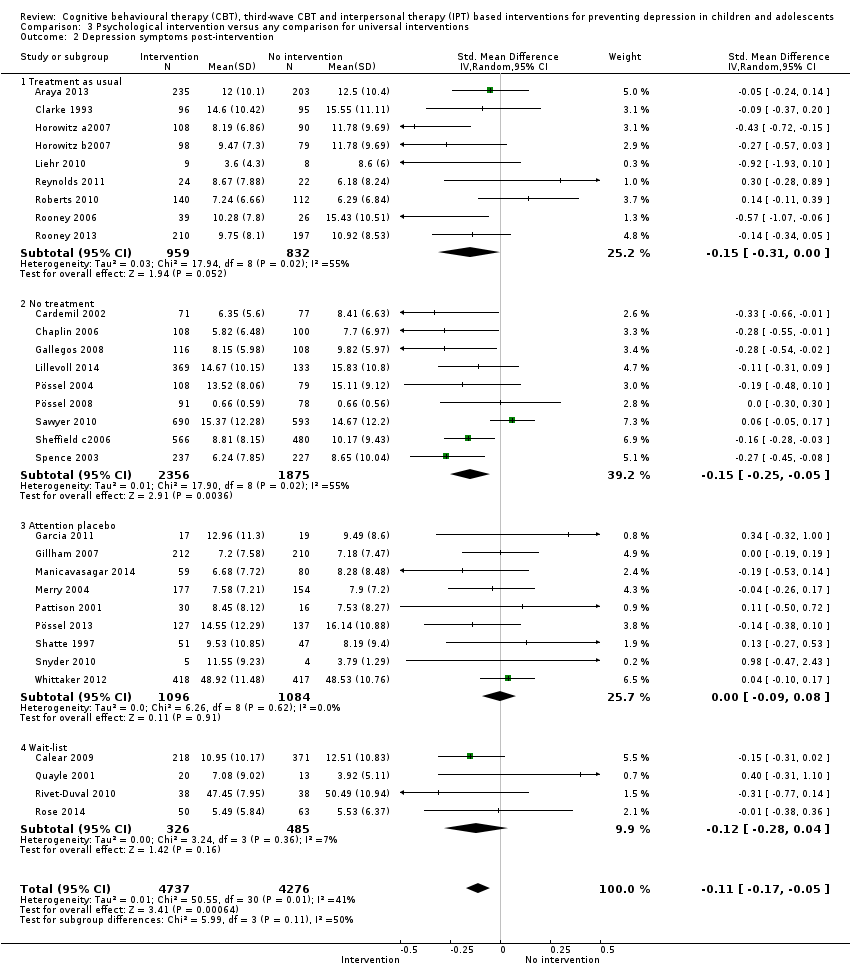
Comparison 3 Psychological intervention versus any comparison for universal interventions, Outcome 2 Depression symptoms post‐intervention.

Comparison 3 Psychological intervention versus any comparison for universal interventions, Outcome 3 Depression symptoms medium‐term follow‐up.
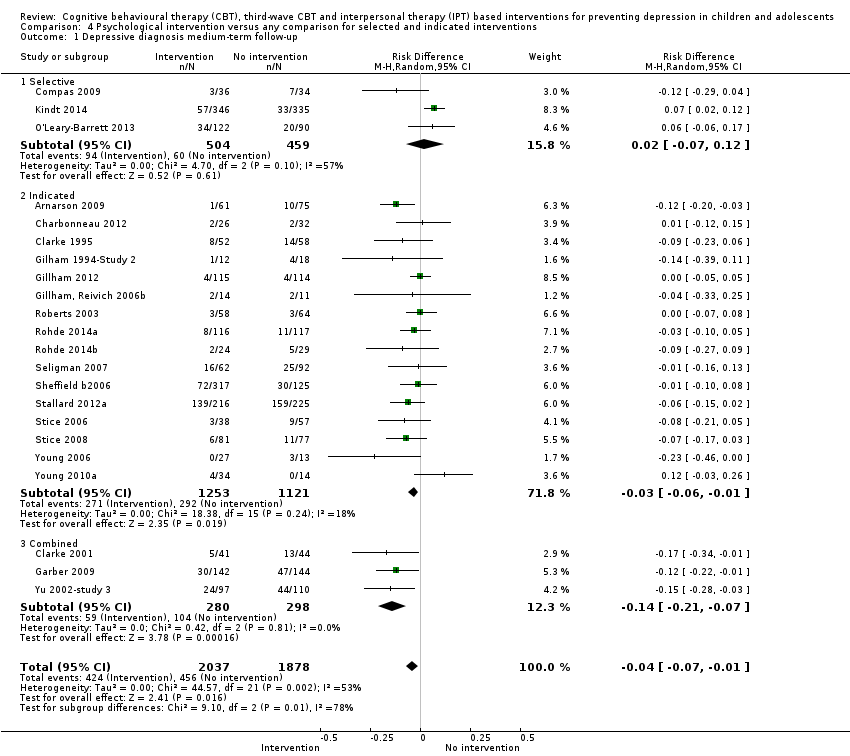
Comparison 4 Psychological intervention versus any comparison for selected and indicated interventions, Outcome 1 Depressive diagnosis medium‐term follow‐up.

Comparison 4 Psychological intervention versus any comparison for selected and indicated interventions, Outcome 2 Depression symptoms (by population) post‐intervention.
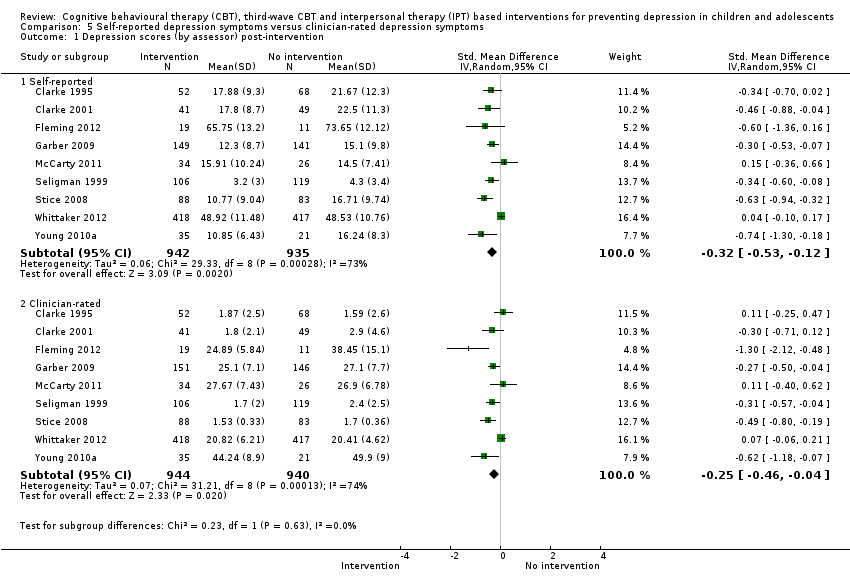
Comparison 5 Self‐reported depression symptoms versus clinician‐rated depression symptoms, Outcome 1 Depression scores (by assessor) post‐intervention.
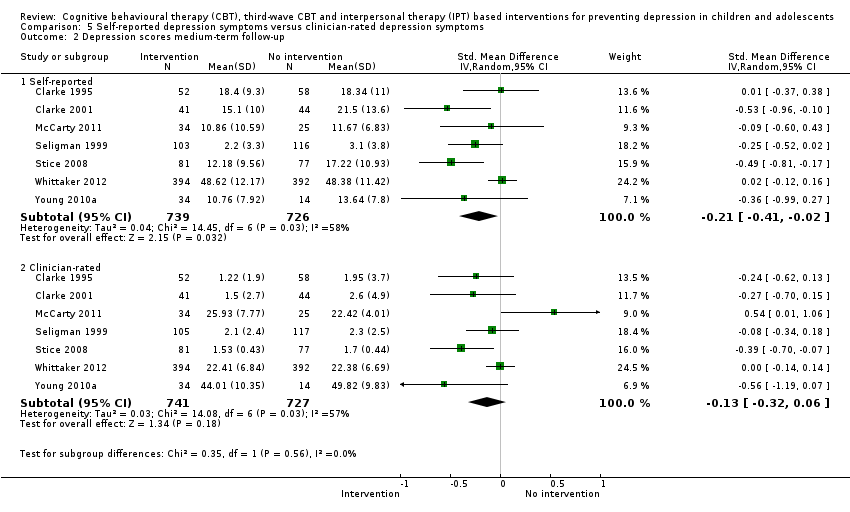
Comparison 5 Self‐reported depression symptoms versus clinician‐rated depression symptoms, Outcome 2 Depression scores medium‐term follow‐up.
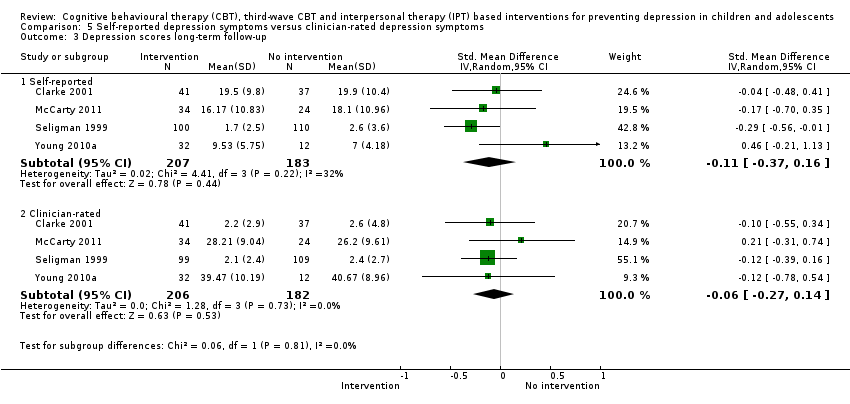
Comparison 5 Self‐reported depression symptoms versus clinician‐rated depression symptoms, Outcome 3 Depression scores long‐term follow‐up.
| Evidence‐based psychological interventions compared to any comparator for depression diagnosis at the medium‐term follow‐up | |||||
| Patient or population: children and adolescents | |||||
| Outcomes | Illustrative comparative risks* (95% CI) | Relative effect | Quality of the evidence | Comments | |
| Assumed risk | Corresponding risk | ||||
| Any comparator | Evidence‐based psychological interventions | ||||
| Evidence‐based psychological interventions versus any comparator (Overall) ‐ effect on diagnosis of depression The assumed risk is based on control group rates of depression diagnosis at medium‐term follow‐up (from a rank ordering of control group rates of each included study). | Study population | RR 0.84 (0.72 to 0.97) | ⊕⊕⊕⊝ | — | |
| 193 per 1000 | 162 per 1000 (139 to 187) | ||||
| Low (0%) | |||||
| 0 per 1000 (0 to 0) | |||||
| Moderate (18.5%) | |||||
| 185 per 1000 | 155 per 1000 (133 to 180) | ||||
| High (70.7%) | |||||
| 707 per 1000 | 594 per 1000 (509 to 685) | ||||
| Evidence‐based psychological interventions versus any comparator (Targeted programmes) ‐ effect on diagnosis of depression The assumed risk is based on control group rates of depression diagnosis at medium‐term follow‐up (from a rank ordering of control group rates of each included study). | Study population | RR 0.82 | ⊕⊝⊝⊝ | — | |
| 243 per 1000 | 199 per 1000 | ||||
| Low (0%) | |||||
| 0 per 1000 (0 to 0) | |||||
| Moderate (20.4%) | |||||
| 204 per 1000 | 167 per 1000 (139 to 202) | ||||
| High (76.7%) | |||||
| 767 per 1000 | 629 per 1000 (521 to 759) | ||||
| Evidence‐based psychological interventions versus any comparator (Universal programmes) ‐ effect on diagnosis of depression The assumed risk is based on control group rates of depression diagnosis at medium‐term follow‐up (from a rank ordering of control group rates of each included study). | Study population | RR 0.87 | ⊕⊕⊕⊝ | — | |
| 99 per 1000 | 86 per 1000 | ||||
| Low (1.0%) | |||||
| 10 per 1000 | 9 per 1000 (7 to 12) | ||||
| Moderate (14.5%) | |||||
| 144 per 1000 | 125 per 1000 (95 to 164) | ||||
| High (30.8%) | |||||
| 308 per 1000 | 268 per 1000 (203 to 351) | ||||
| *The basis for the assumed risk (e.g. the median control group risk across studies) is provided in footnotes. The corresponding risk (and its 95% confidence interval) is based on the assumed risk in the comparison group and the relative effect of the intervention (and its 95% CI). | |||||
| GRADE Working Group grades of evidence | |||||
| 1We downgraded quality owing to lack of clarity over allocation concealment and presence of other bias. | |||||
| Evidence‐based psychological interventions versus any comparator for self‐rated depression scores at the post‐intervention assessment | ||||||
| Patient or population: children and adolescents Settings: various | ||||||
| Outcomes | Illustrative comparative risks* (95% CI) | Relative effect | No of participants | Quality of the evidence | Comments | |
| Assumed risk | Corresponding risk | |||||
| Any comparator | Evidence‐based psychological interventions | |||||
| Evidence‐based psychological interventions versus any comparator (Overall) ‐ self‐rated depression scores (higher score is equivalent to a poorer outcome) | The mean self‐reported depression score ranged across control groups from 0.66 to 105.51 points. | The mean self‐rated depression score in the intervention group was 0.21 standard deviations lower (0.27 to 0.15 lower) | — | 13,829 (73 trials) | ⊕⊕⊝⊝ Low1,2 | — |
| Evidence‐based psychological interventions versus any comparator (Targeted ‐ self‐rated depression scores (higher score is equivalent to a poorer outcome)) | The mean self‐reported depression score ranged across control groups from 4.30 to 105.51 points. | The mean self‐rated depression score in the intervention group was 0.32 standard deviations lower (0.42 to 0.23 lower) | — | 4816 | ⊕⊕⊕⊝ Moderate3 | — |
| Evidence‐based psychological interventions versus any comparator (Universal programmes) ‐ self‐rated depression scores (higher score is equivalent to a poorer outcome) | The mean self‐reported depression score ranged across control groups from 0.66 to 50.49 points. | The mean self‐rated depression score in the intervention group was 0.11 standard deviations lower (0.17 to 0.05 lower) | — | 9013 | ⊕⊕⊕⊝ | — |
| *The basis for the assumed risk (e.g. the median control group risk across studies) is provided in footnotes. The corresponding risk (and its 95% confidence interval) is based on the assumed risk in the comparison group and the relative effect of the intervention (and its 95% CI). | ||||||
| GRADE Working Group grades of evidence | ||||||
| 1We downgraded quality owing to a lack of clarity about random sequence generation and allocation concealment and the presence of other bias. 2Heterogeneity (I2 = 57%). 3We downgraded quality owing to a lack of clarity over allocation concealment and the presence of other bias. | ||||||
| Study | Cognitive restructuring (Y/N) | Behavioural techniques (Y/N) | Problem‐solving (Y/N) | Social skills training (Y/N) | Relaxation techniques (Y/N) | Third wave techniques (Y/N) | Anxiety management techniques (Y/N) | Component/s focusing on management of specific problems (Y/N) | Parental component/s (Y/N) | Predominant therapeutic focus |
| Y | N | Y | N | N | N | N | N | Y | CBT (cognitive) | |
| Y | Y | Y | Y | Y | N | N | N | N | CBT plus IPT | |
| Y | Y | N | N | Y | N | N | N | N | CBT (behavioural) | |
| Y | Y | Y | Y | Y | N | N | N | N | CBT (cognitive and behavioural) | |
| Y | N | Y | Y | N | N | N | N | N | CBT (cognitive) | |
| Y | N | N | N | N | N | N | N | N | CBT (cognitive) | |
| Y | N | Y | Y | Y | N | N | Y1 | N | CBT (cognitive) | |
| N | N | N | N | Y | Y | N | N | N | Third wave | |
| N | Y | N | N | N | N | N | N | N | Behaviour therapy (third wave) | |
| Y | N | N | N | N | N | N | N | N | CBT (cognitive) | |
| Y | N | N | N | N | N | N | Y2 | Y | CBT (cognitive) | |
| Y | Y | N | N | N | Y | N | Y2 | Y | CBT (cognitive and behavioural) | |
| Y | N | Y | Y | Y | Y | Y | Y3 | N | CBT (cognitive) | |
| N | N | Y | Y | N | N | N | Y4 | Y |
| |
| Y | N | N | N | N | N | N | N | N | CBT (cognitive) | |
| Y | Y | Y | Y | Y | N | N | N | N | CBT (cognitive and behavioural) | |
| Y | Y | Y | Y | Y | N | N | N | N | CBT (cognitive and behavioural) | |
| Y | N | N | N | N | N | N | N | N | CBT (cognitive) | |
| Y | N | Y | N | Y | N | Y | N | Y | CBT (cognitive) | |
| Y | N | N | N | N | N | N | N | Y | CBT (cognitive) | |
| Y | N | Y | Y | Y | Y | Y | Unclear | Unclear | Third wave | |
| Y | N | Y | Y | Y | N | N | Y | N5 | CBT (cognitive) | |
| Y | N | Y | Y | Y | N | N | Unclear | N | CBT (cognitive) | |
| Y | N | Y | Y | Y | N | N | Unclear | Y | CBT (cognitive) | |
| Y | N | Y | Y | Y | N | N | Unclear | N | CBT (cognitive) | |
| Y | N | N | Y | Y | N | N | Y | N | CBT (cognitive) | |
| Y | N | N | N | N | N | N | N | N | CBT (cognitive) | |
| N | N | N | Y | N | N | N | N | N | IPT | |
| Y | Y | N | N | Y | N | N | Y6 | N | CBT (cognitive and behavioural) | |
| Y | N | Y | Y | Y | N | N | Y7 | N | CBT (cognitive) | |
| Y | N | Y | Y | Y | N | N | Y8 | N | CBT (cognitive) | |
| N | Y | N | N | N | N | N | N | N | Behaviour therapy (third wave) | |
| N | N | N | N | Y | Y | N | N | N | Third wave | |
| Y | N | N | Y | Y | N | N | N | N | CBT (cognitive) | |
| Y | Y | Y | Y | N | N | N | N | N | CBT (cognitive and behavioural) | |
| N | N | N | N | N | Y | N | N | N | Third wave | |
| Y | Y | Y | Y | Y | N | N | N | N | CBT (cognitive and behavioural) | |
| N | N | N | N | N | Y | N | N | N | Third wave | |
| Y | Y | N | N | N | N | N | N | N | CBT (cognitive and behavioural) | |
| Unclear | Unclear | N | N | Y | Y | N | N | N | Third wave | |
| Y | Y | Y | Y | Y | N | N | N | Y | CBT (cognitive and behavioural) | |
| Y | Y | Y | Y | Y | N | N | N | Y | CBT (cognitive and behavioural) | |
| Y | Y | Y | Y | Y | N | N | N | N | CBT (cognitive and behavioural) | |
| N | N | N | N | N | Y | N | N | N | Third wave | |
| Y | Y | Y | Y | Y | N | Y | N | N | CBT plus IPT | |
| NA | NA | NA | NA | NA | NA | NA | NA | NA | NA | |
| Y | Y | Y | Y | N | N | N | Y9 | N | CBT (cognitive and behavioural) | |
| Y | N | N | N | N | N | N | N | N | CBT (cognitive) | |
| Y | N | Y | Y | Y | N | N | Unclear | N | CBT (cognitive) | |
| Y | N | Y | Y | Y | N | N | N | N | Problem‐solving | |
| Y | N | N | Y | N | N | N | N | N | CBT (cognitive) | |
| Y | Y | N | Y | N | N | N | N | N | CBT (cognitive and behavioural) | |
| Y | Y | N | Y | N | N | N | N | N | CBT (cognitive and behavioural) | |
| Y | Y | Y | Y | Y | N | N | N | N | CBT (cognitive and behavioural) | |
| Y | N | Y | Y | N | N | N | Y1 | N | CBT (cognitive) | |
| N | Y | N | N | N | N | N | N | N | Behaviour therapy (third wave) | |
| Y | Y | Y | Y | Y | N | Y | N | N | CBT plus IPT | |
| Y | N | Y | Y | N | N | N | Y1 | N | CBT (cognitive) | |
| Y | Y | Y | Y | N | N | Unclear | Unclear | N | CBT (cognitive) | |
| Y | Y | N | N | N | N | N | N | N | CBT (cognitive and behavioural) | |
| Y | Y | N | N | N | N | N | N | N | CBT (cognitive and behavioural) | |
| Y | N | N | N | Y | N | N | N | N | CBT (cognitive) | |
| Y | Y | N | N | Y | N | Y | N | N | CBT (cognitive and behavioural) | |
| Y | Y | Y | Y | N | N | Unclear | N | N | CBT plus IPT | |
| Y | Y | Y | Y | Y | N | N | N | N | CBT (cognitive and behavioural) | |
| Y | Y | Y | Y | N | N | N | Y10 | Y | CBT (cognitive) | |
| Y | Y | Y | Y | Y | N | N | N | N | CBT (cognitive and behavioural) | |
| Y | Y | Y | Y | Y | N | N | N | N | CBT (cognitive and behavioural) | |
| Y | Y | Y | Y | Y | N | N | N | N | CBT (cognitive and behavioural) | |
| Y | N | Y | Y | Y | N | N | Y6 | N | CBT (cognitive) | |
| Y | Y | Y | Y | N | N | N | N | N | CBT (cognitive and behavioural) | |
| Y | Y | Y | Y | N | N | N | N | N | CBT (cognitive and behavioural) | |
| Y | N | Y | N | N | N | N | N | N | CBT (cognitive) | |
| N | N | N | N | N | Y | N | N | N | Third wave | |
| Y | N | Y | N | N | N | N | N | N | CBT (cognitive and behavioural) | |
| Y | Y | Y | Y | Y | N | Y | N | N | CBT plus IPT | |
| Y | Y | N | N | N | N | N | N | N | CBT (cognitive and behavioural) | |
| Y | Y | N | N | N | N | Y | N | N | CBT (cognitive and behavioural) | |
| Y | Y | N | N | Y | N | N | N | N | CBT (cognitive and behavioural) | |
| Y | Y | Y | N | Y | N | N | N | N | CBT (cognitive and behavioural) | |
| Y | N | N | N | N | N | N | N | N | CBT (cognitive) | |
| Y | Y | Y | Y | Y | N | N | N | N | CBT (cognitive and behavioural) | |
| Y | Y | Y | Y | N | N | N | N | N | CBT (cognitive and behavioural) | |
| N | N | N | Y | N | N | N | N | N | IPT | |
| N | N | N | Y | N | N | N | N | N | IPT | |
| Y | N | Y | Y | Y | N | N | Y1 | N | CBT (cognitive) | |
| 1Penn Resiliency programmes place some emphasis on resolution of family conflict. 2Addresses beliefs related to or coping with a parent diagnosed with depression, or both. 3Addresses resolving conflict with family and friends. 4 Addresses being an immigrant 5Although for some participants there was a parental component, this was not controlled. Instead only the feasibility of offering parental sessions was evaluated. 6Addresses factors involved in the participants' decision to run away from home. 7Addresses coping with parental conflict. 8Addresses coping with parental divorce. 9Addresses coping with rural living. 10Addresses coping with grief after the death of a parent. | ||||||||||
| k | RR | (95% CI) | β | (95% CI) | P value (moderator) | Adjusted R2 (%) | I2 (Res) | P value | |
| Overall effect | 22 | 0.82 | (0.68 to 0.99) | ‐0.20 | (‐0.40 to 0.01) | 0.06 | 0 | 37.0 | 0.04 |
| Continuous | |||||||||
| Intensity of intervention (hours) | 21 | — | — | ‐0.02 | (‐0.04 to 0.01) | 0.08 | 92.0 | 0.9 | 0.08 |
| Binary | |||||||||
| Focus of intervention | |||||||||
| CBT (reference) | 17 | 0.81 | (0.65 to 1.01) | — | — | — | 0 | 44.9 | 0.95 |
| CBT + IPT | 2 | 0.44 | (0.07 to 2.90) | ‐0.03 | (‐0.74 to 0.68) | 0.93 | — | — | — |
| IPT | 2 | 0.53 | (0.01 to 26.34) | ‐0.39 | (‐2.64 to 1.85) | 0.72 | — | — | — |
| Third wave | 1 | 1.23 | (0.19 to 8.15) | 0.44 | (‐1.71 to 2.59) | 0.67 | — | — | — |
| Depression severity at baseline | |||||||||
| Subthreshold (reference) | 10 | 1.01 | (0.81 to 1.27) | — | — | — | 99.0 | 0.5 | 0.02 |
| Mild | 8 | 0.57 | (0.43 to 0.77) | ‐0.52 | (‐0.86 to ‐0.17) | 0.01 | — | — | — |
| Moderate | 2 | 0.59 | (0.40 to 0.88) | ‐0.48 | (‐0.93 to ‐0.03) | 0.04 | — | — | — |
| Severe | 1 | 0.95 | (0.65 to 1.37) | ‐0.01 | (‐0.44 to 0.41) | 0.95 | — | — | — |
| Focus of CBT (for CBT studies only) | |||||||||
| CBT – cognitive and behavioural (reference) | 9 | 0.87 | (0.76 to 1.01) | — | — | — | 0 | 41.8 | 0.62 |
| CBT ‐ cognitive | 10 | 0.83 | (0.59 to 1.18) | 0.10 | (‐0.33 to 0.54) | 0.62 | |||
| CBT ‐ behavioural | 0 | — | — | — | — | — | — | — | — |
| Inclusion of relaxation component (for CBT studies only) | |||||||||
| No mention of relaxation component (reference) | 11 | 0.77 | (0.63 to 0.95) | — | — | — | 0 | 37.2 | 0.28 |
| Relaxation component described as included | 8 | 0.90 | (0.65 to 1.24) | 0.22 | (‐0.20 to 0.63) | 0.28 | — | — | — |
| Inclusion of problem‐solving skills training component (for CBT studies only) | |||||||||
| No mention of problem‐solving component (reference) | 11 | 0.77 | (0.55 to 1.08) | — | — | — | 0 | 41.8 | 0.99 |
| Problem‐solving component described as included | 8 | 0.86 | (0.74 to 1.01) | ‐0.01 | (‐0.43 to 0.43) | 0.99 | — | — | — |
| Inclusion of social skills training (for CBT studies only) | |||||||||
| No mention of social skills component (reference) | 9 | 0.70 | (0.54 to 0.91) | — | — | — | 11.0 | 32.9 | 0.13 |
| Social skills component described as included | 10 | 0.93 | (0.73 to 1.18) | 0.30 | (‐0.09 to 0.70) | 0.13 | — | — | — |
| Type of facilitator | |||||||||
| Mental health expert (reference group) | 9 | 0.64 | (0.45 to 0.90) | — | — | — | 0 | 21.2 | 0.12 |
| Students | 8 | 0.89 | (0.78 to 1.01) | 0.18 | (‐0.34 to 0.70) | 0.48 | — | — | — |
| Non‐mental health expert | 5 | 1.05 | (0.73 to 1.53) | 0.49 | (0.01 to 0.98) | 0.05 | — | — | — |
| Mode of delivery | |||||||||
| Face‐to‐face (group or individual) | 22 | 0.82 | (0.68 to 0.99) | ‐0.20 | (‐0.40 to 0.01) | 0.06 | 0 | 37.0 | 0.04 |
| Online/telephone | 0 | — | — | — | — | — | — | — | — |
| k refers to number of trials. CBT: cognitive behavioural therapy | |||||||||
| k | SMD | (95% CI) | β | (95% CI) | P value (moderator) | Adjusted R2 (%) | I2 (Res) (%) | P value | |
| Overall effect | 42 | ‐0.32 | (‐0.42 to ‐0.23) | ‐0.33 | (‐0.44 to ‐0.22) | > 0.001 | 0 | 56.0 | > 0.001 |
| Continuous | |||||||||
| Intensity of intervention (hours) | 37 | — | — | 0.02 | (‐0.01 to 0.03) | 0.06 | 15.0 | 50.5 | 0.06 |
| Binary | |||||||||
| Focus of intervention | |||||||||
| CBT (reference) | 36 | ‐0.32 | (‐0.42 to ‐0.22) | — | — | — | 17.0 | 54.2 | 0.03 |
| CBT + IPT | 0 | — | — | — | — | — | — | — | — |
| IPT | 2 | ‐1.11 | (‐1.89 to ‐0.33) | ‐0.75 | (‐1.35 to ‐0.15) | 0.02 | — | — | — |
| Third wave | 4 | ‐0.10 | (‐0.35 to 0.15) | 0.21 | (‐0.16 to 0.59) | 0.26 | — | — | — |
| Depression severity at baseline | |||||||||
| Subthreshold (reference) | 15 | ‐0.20 | (‐0.33 to ‐0.07) | — | — | — | 12.0 | 56.0 | 0.20 |
| Mild | 10 | ‐0.51 | (‐0.69 to ‐0.33) | ‐0.31 | (‐0.60 to ‐0.02) | 0.03 | — | — | — |
| Moderate | 10 | ‐0.41 | (‐0.71 to ‐0.11) | ‐0.14 | (‐0.45 to 0.16) | 0.35 | — | — | — |
| Severe | 4 | ‐0.31 | (‐0.54 to ‐0.07) | ‐0.12 | (‐0.49 to 0.25) | 0.52 | — | — | — |
| Focus of CBT (for CBT studies only) | |||||||||
| CBT – cognitive and behavioural (reference) | 18 | ‐0.42 | (‐0.58 to ‐0.27) | — | — | — | 31.0 | 47.4 | 0.06 |
| CBT ‐ cognitive | 17 | ‐0.20 | (‐0.30 to ‐0.10) | 0.20 | (‐0.01 to 0.40) | 0.05 | — | — | — |
| CBT ‐ behavioural | 1 | ‐1.07 | (‐1.91 to ‐0.23) | ‐0.66 | (‐1.68 to 0.37) | 0.20 | — | — | — |
| Inclusion of relaxation component (for CBT studies only) | |||||||||
| No mention of relaxation component (reference) | 17 | ‐0.30 | (‐0.41 to‐0.91) | — | — | — | 0 | 57.2 | 0.93 |
| Relaxation component described as included | 18 | ‐0.33 | (‐0.50 to ‐0.17) | ‐0.01 | (‐0.24 to 0.22) | 0.93 | — | — | — |
| Inclusion of problem‐solving skills training component (for CBT studies only) | |||||||||
| No mention of problem‐solving component (reference) | 15 | ‐0.35 | (‐0.49 to 0.20) | — | — | — | 0 | 57.7 | 0.59 |
| Problem‐solving component described as included | 20 | ‐0.29 | (‐0.43 to ‐0.15) | 0.06 | (‐0.17 to 0.29) | 0.59 | — | — | — |
| Inclusion of social skills training component (for CBT studies only) | |||||||||
| No mention of social skills component (reference) | 13 | ‐0.40 | (‐0.54 to ‐0.27) | — | — | — | 13.0 | 52.5 | 0.19 |
| Social skills component described as included | 22 | ‐0.26 | (‐0.39 to ‐0.13) | 0.15 | (‐0.08 to 0.38) | 0.19 | |||
| Type of facilitator | |||||||||
| Mental health expert (reference group) | 20 | ‐0.39 | (‐0.52 to ‐0.26) | — | — | — | 30.0 | 43.5 | 0.08 |
| Students | 7 | ‐0.40 | (‐0.62 to ‐0.19) | ‐0.02 | (‐0.29 to 0.24) | 0.85 | — | — | — |
| Non‐mental health expert | 7 | ‐0.11 | (‐0.21 to ‐0.01) | 0.24 | (0.02 to 0.46) | 0.03 | — | — | — |
| Mode of delivery | |||||||||
| Face‐to‐face (group or individual) (reference group) | 36 | ‐0.32 | (‐0.42 to ‐0.23) | — | — | — | 0 | 59.2 | 0.87 |
| Online/telephone | 6 | ‐0.45 | (‐0.98 to ‐0.02) | ‐0.03 | (‐0.39 to 0.33) | 0.87 | — | — | — |
| k refers to number of trials. CBT: cognitive behavioural therapy | |||||||||
| k | RR | (95% CI) | β | (95% CI) | P value (moderator) | AdjustedR2 (%) | I2 (Res) (%) | P value | |
| Overall effect | 10 | 0.87 | (0.66 – 1.14) | ‐0.14 | (‐0.45 to 0.17) | 0.33 | 0 | 0 | 0.30 |
| Continuous | |||||||||
| Intensity of intervention (hours) | 9 | — | — | 0.02 | (‐0.04 to 0.08) | 0.38 | 0 | 0 | 0.38 |
| Binary | |||||||||
| Focus of intervention | |||||||||
| CBT (reference) | 7 | 0.92 | (0.64 to 1.31) | — | — | — | 0 | 0 | 0.76 |
| CBT + IPT | 2 | 0.79 | (0.38 to 1.64) | ‐0.16 | (‐1.13 to 0.80) | 0.70 | — | — | — |
| IPT | 0 | ||||||||
| Third wave | 1 | 0.72 | (0.37 to 1.38) | ‐0.26 | (‐1.14 to 0.62) | 0.51 | — | — | — |
| Depression severity at baseline | |||||||||
| Subthreshold (reference) | 7 | 0.90 | (0.65 to 1.23) | — | — | — | 0 | 0 | 0.73 |
| Mild | 3 | 0.77 | (0.37 to 1.58) | ‐0.11 | (‐0.81 to 0.59) | 0.73 | — | — | — |
| Moderate | 0 | — | — | — | — | — | — | — | — |
| Severe | 0 | — | — | — | — | — | — | — | — |
| Focus of CBT (for CBT studies only) | |||||||||
| CBT – cognitive and behavioural (reference) | 5 | 0.93 | (0.67 to 1.30) | — | — | — | 0 | 0 | 0.70 |
| CBT ‐ cognitive | 4 | 0.61 | (0.23 to 1.64) | ‐0.15 | (‐1.03 to 0.73) | 0.70 | — | — | — |
| CBT ‐ behavioural | 0 | — | — | — | — | — | — | — | — |
| Inclusion of relaxation component (for CBT studies only) | |||||||||
| No mention of relaxation component (reference) | 4 | 0.93 | (0.47 to 1.86) | — | — | — | 0 | 0 | 0.87 |
| Relaxation component described as included | 5 | 0.89 | (0.64 to 1.24) | ‐0.06 | (‐0.95 to 0.82) | 0.87 | — | — | — |
| Inclusion of problem‐solving skills training component (for CBT studies only) | |||||||||
| No mention of problem‐solving component (reference) | 2 | 0.26 | (0.05 to 1.30) | — | — | — | 0 | 0 | 0.17 |
| Problem‐solving component described as included | 7 | 0.94 | (0.70 to 1.28) | 1.27 | (‐0.68 to 3.23) | 0.17 | — | — | — |
| Inclusion of social skills training component (for CBT studies only) | |||||||||
| No mention of social skills component (reference) | 4 | 0.91 | (0.60 to 1.39) | — | — | — | 0 | 0 | 0.85 |
| Social skills component described as included | 5 | 0.87 | (0.53 to 1.43) | ‐0.06 | (‐0.81 to 0.68) | 0.85 | — | — | — |
| Type of facilitator | |||||||||
| Mental health expert (reference group) | 2 | 0.26 | (0.05 to 1.30) | — | — | — | 0 | 0 | 0.39 |
| Students | 3 | 0.68 | (0.22 to 2.04) | 0.97 | (‐1.36 to 3.30) | 0.35 | — | — | — |
| Non‐mental health expert | 4 | 0.90 | (0.61 to 1.32) | 1.22 | (‐0.83 to 3.27) | 0.19 | — | — | — |
| Mode of delivery | |||||||||
| Face‐to‐face (group or individual) | 9 | 0.82 | (0.57 to 1.16) | — | — | — | 0 | 0 | 0.62 |
| Online/telephone | 1 | 0.94 | (0.62 to 1.44) | 0.15 | (‐0.50 to 0.79) | 0.62 | — | — | — |
| k refers to number of trials. CBT: cognitive behavioural therapy | |||||||||
| k | SMD | (95% CI) | β | (95% CI) | P value (moderator) | AdjustedR2 (%) | I2 (Res) (%) | P value (overall) | |
| Overall effect | 31 | ‐0.11 | (‐0.17 to ‐0.05) | ‐0.11 | (‐0.17 to ‐0.04) | >0.001 | 0 | 41.0 | > 0.001 |
| Continuous | |||||||||
| Intensity of intervention (hours) | 29 | — | — | 0.01 | (0.00 to 0.02) | > 0.001 | 68.0 | 18.0 | > 0.001 |
| Binary | |||||||||
| Focus of intervention | |||||||||
| CBT (reference) | 21 | ‐0.11 | (‐0.18 to ‐0.04) | — | — | — | 0 | 46.5 | 0.79 |
| CBT + IPT | 3 | ‐0.08 | (‐0.25 to 0.10) | 0.02 | (‐0.24 to 0.28) | 0.87 | — | — | — |
| IPT | 1 | ‐0.27 | (‐0.57 to 0.02) | ‐0.16 | (‐0.58 to 0.25) | 0.43 | — | — | — |
| Third wave | 6 | ‐0.01 | (‐0.31 to 0.30) | 0.07 | (‐0.19 to 0.33) | 0.57 | — | — | — |
| Depression severity at baseline | |||||||||
| Subthreshold (reference) | 25 | ‐0.11 | (‐0.18 to ‐0.04) | — | — | — | 0 | 45.9 | 0.62 |
| Mild | 5 | ‐0.06 | (‐0.26 to 0.14) | 0.05 | (‐0.16 to 0.27) | 0.62 | |||
| Moderate | 0 | — | — | — | — | — | — | — | — |
| Severe | 0 | — | — | — | — | — | — | — | — |
| Focus of CBT (for CBT studies only) | |||||||||
| CBT – cognitive and behavioural (reference) | 11 | ‐0.08 | (‐0.15 to ‐0.01) | — | — | — | 2.0 | 42.7 | 0.42 |
| CBT ‐ cognitive | 13 | ‐0.14 | (‐0.24 to ‐0.03) | ‐0.05 | (‐0.19 to 0.08) | 0.42 | |||
| CBT ‐ behavioural | 0 | — | — | — | — | — | — | — | — |
| Inclusion of relaxation component (for CBT studies only) | |||||||||
| No mention of relaxation component (reference) | 11 | ‐0.13 | (‐0.23 to ‐0.04) | — | — | — | 9.0 | 40.8 | 0.45 |
| Relaxation component described as included | 13 | ‐0.08 | (‐0.16 to ‐0.01) | 0.05 | (‐0.09 to 0.19) | 0.45 | — | — | — |
| Inclusion of problem‐solving skills training component (for CBT studies only) | |||||||||
| No mention of problem‐solving component (reference) | 6 | ‐0.20 | (‐0.34 to ‐0.07) | — | — | — | 14.0 | 40.4 | 0.13 |
| Problem‐solving component described as included | 18 | ‐0.08 | (‐0.15 to ‐0.01) | 0.12 | (‐0.04 to 0.28) | 0.13 | — | — | — |
| Inclusion of social skills training component (for CBT studies only) | |||||||||
| No mention of social skills component (reference) | 8 | ‐0.18 | (‐0.29 to ‐0.07) | — | — | — | 13.0 | 39.5 | 0.11 |
| Social skills component described as included | 16 | ‐0.06 | (‐0.13 to 0.01) | 0.11 | (‐0.03 to 0.24) | 0.11 | |||
| Type of facilitator | |||||||||
| Mental health expert (reference group) | 11 | ‐0.11 | (‐0.23 to 0.02) | — | — | — | 0 | 48.0 | 0.57 |
| Students | 6 | ‐0.21 | (‐0.38 to ‐0.05) | ‐0.10 | (‐0.35 to 0.14) | 0.38 | — | — | — |
| Non‐mental health expert | 8 | ‐0.09 | (‐0.22 to 0.03) | 0.01 | (‐0.19 to 0.22) | 0.88 | — | — | — |
| Mode of delivery | |||||||||
| Face‐to‐face (group or individual) | 27 | ‐0.11 | (‐0.19 to ‐0.04) | — | — | — | 0 | 43.9 | 0.76 |
| Online/telephone | 4 | ‐0.07 | (‐0.18 to 0.03) | 0.03 | (‐0.15 to 0.20) | 0.76 | — | — | — |
| k refers to number of trials. CBT: cognitive behavioural therapy | |||||||||
| Outcome or subgroup title | No. of studies | No. of participants | Statistical method | Effect size |
| 1 Depressive diagnosis (by population) post‐intervention Show forest plot | 20 | 3232 | Risk Difference (M‐H, Random, 95% CI) | ‐0.05 [‐0.08, ‐0.02] |
| 1.1 Targeted | 13 | 2022 | Risk Difference (M‐H, Random, 95% CI) | ‐0.06 [‐0.10, ‐0.02] |
| 1.2 Universal | 7 | 1210 | Risk Difference (M‐H, Random, 95% CI) | ‐0.04 [‐0.08, 0.00] |
| 2 Depressive diagnosis short‐term follow‐up Show forest plot | 6 | 724 | Risk Difference (M‐H, Random, 95% CI) | ‐0.04 [‐0.11, 0.03] |
| 2.1 Targeted | 4 | 360 | Risk Difference (M‐H, Random, 95% CI) | ‐0.11 [‐0.19, ‐0.02] |
| 2.2 Universal | 2 | 364 | Risk Difference (M‐H, Random, 95% CI) | 0.03 [‐0.04, 0.10] |
| 3 Depressive diagnosis medium‐term follow‐up Show forest plot | 32 | 5965 | Risk Difference (M‐H, Random, 95% CI) | ‐0.03 [‐0.05, ‐0.01] |
| 3.1 Targeted | 22 | 3915 | Risk Difference (M‐H, Random, 95% CI) | ‐0.04 [‐0.07, ‐0.01] |
| 3.2 Universal | 10 | 2050 | Risk Difference (M‐H, Random, 95% CI) | ‐0.01 [‐0.03, 0.01] |
| 4 Depressive diagnosis long‐term follow‐up Show forest plot | 10 | 1769 | Risk Difference (M‐H, Random, 95% CI) | ‐0.02 [‐0.05, 0.02] |
| 4.1 Targeted | 6 | 1043 | Risk Difference (M‐H, Random, 95% CI) | ‐0.03 [‐0.09, 0.03] |
| 4.2 Universal | 4 | 726 | Risk Difference (M‐H, Random, 95% CI) | ‐0.01 [‐0.03, 0.02] |
| 5 Depression symptoms (by population) post‐intervention Show forest plot | 73 | 13829 | Std. Mean Difference (IV, Random, 95% CI) | ‐0.21 [‐0.27, ‐0.15] |
| 5.1 Targeted | 42 | 4816 | Std. Mean Difference (IV, Random, 95% CI) | ‐0.32 [‐0.42, ‐0.23] |
| 5.2 Universal | 31 | 9013 | Std. Mean Difference (IV, Random, 95% CI) | ‐0.11 [‐0.17, ‐0.05] |
| 6 Depression symptoms short‐term follow‐up Show forest plot | 16 | 1558 | Std. Mean Difference (IV, Random, 95% CI) | ‐0.31 [‐0.45, ‐0.17] |
| 6.1 Targeted | 11 | 999 | Std. Mean Difference (IV, Random, 95% CI) | ‐0.37 [‐0.54, ‐0.20] |
| 6.2 Universal | 5 | 559 | Std. Mean Difference (IV, Random, 95% CI) | ‐0.18 [‐0.37, 0.01] |
| 7 Depression symptoms medium‐term follow‐up Show forest plot | 53 | 11913 | Std. Mean Difference (IV, Random, 95% CI) | ‐0.12 [‐0.18, ‐0.05] |
| 7.1 Targeted | 29 | 4448 | Std. Mean Difference (IV, Random, 95% CI) | ‐0.23 [‐0.33, ‐0.12] |
| 7.2 Universal | 24 | 7465 | Std. Mean Difference (IV, Random, 95% CI) | ‐0.02 [‐0.08, 0.03] |
| 8 Depression symptoms long‐term follow‐up Show forest plot | 15 | 3836 | Std. Mean Difference (IV, Random, 95% CI) | 0.00 [‐0.06, 0.06] |
| 8.1 Targeted | 7 | 847 | Std. Mean Difference (IV, Random, 95% CI) | ‐0.05 [‐0.21, 0.11] |
| 8.2 Universal | 8 | 2989 | Std. Mean Difference (IV, Random, 95% CI) | 0.02 [‐0.06, 0.09] |
| 9 Depression symptoms clinician‐rated (by population) post‐intervention Show forest plot | 11 | 2175 | Std. Mean Difference (IV, Random, 95% CI) | ‐0.23 [‐0.41, ‐0.05] |
| 9.1 Targeted | 10 | 1340 | Std. Mean Difference (IV, Random, 95% CI) | ‐0.28 [‐0.44, ‐0.11] |
| 9.2 Universal | 1 | 835 | Std. Mean Difference (IV, Random, 95% CI) | 0.07 [‐0.06, 0.21] |
| 10 Depression symptoms clinician‐rated medium‐term follow‐up Show forest plot | 9 | 1754 | Std. Mean Difference (IV, Random, 95% CI) | ‐0.08 [‐0.24, 0.07] |
| 10.1 Targeted | 8 | 968 | Std. Mean Difference (IV, Random, 95% CI) | ‐0.10 [‐0.30, 0.09] |
| 10.2 Universal | 1 | 786 | Std. Mean Difference (IV, Random, 95% CI) | 0.00 [‐0.14, 0.14] |
| 11 Depression symptoms clinician‐rated long‐term follow‐up Show forest plot | 6 | 894 | Std. Mean Difference (IV, Random, 95% CI) | ‐0.12 [‐0.25, 0.01] |
| 11.1 Targeted | 6 | 894 | Std. Mean Difference (IV, Random, 95% CI) | ‐0.12 [‐0.25, 0.01] |
| 12 Anxiety symptoms (by population) post‐intervention Show forest plot | 23 | 5017 | Std. Mean Difference (IV, Random, 95% CI) | ‐0.07 [‐0.16, 0.02] |
| 12.1 Targeted | 13 | 1666 | Std. Mean Difference (IV, Random, 95% CI) | ‐0.13 [‐0.31, 0.04] |
| 12.2 Universal | 10 | 3351 | Std. Mean Difference (IV, Random, 95% CI) | ‐0.04 [‐0.13, 0.05] |
| 13 Anxiety symptoms (by population) short‐term follow‐up Show forest plot | 3 | 334 | Std. Mean Difference (IV, Random, 95% CI) | ‐0.33 [‐0.59, ‐0.07] |
| 13.1 Targeted | 3 | 334 | Std. Mean Difference (IV, Random, 95% CI) | ‐0.33 [‐0.59, ‐0.07] |
| 14 Anxiety symptoms (by population) medium‐term follow‐up Show forest plot | 18 | 4957 | Std. Mean Difference (IV, Random, 95% CI) | ‐0.08 [‐0.14, ‐0.01] |
| 14.1 Targeted | 10 | 1827 | Std. Mean Difference (IV, Random, 95% CI) | ‐0.07 [‐0.18, 0.04] |
| 14.2 Universal | 8 | 3130 | Std. Mean Difference (IV, Random, 95% CI) | ‐0.09 [‐0.17, ‐0.01] |
| 15 Anxiety symptoms (by population) long‐term follow‐up Show forest plot | 5 | 971 | Std. Mean Difference (IV, Random, 95% CI) | ‐0.15 [‐0.44, 0.14] |
| 15.1 Targeted | 2 | 293 | Std. Mean Difference (IV, Random, 95% CI) | ‐0.20 [‐0.43, 0.03] |
| 15.2 Universal | 3 | 678 | Std. Mean Difference (IV, Random, 95% CI) | ‐0.11 [‐0.61, 0.40] |
| 16 Social and general functioning (by population) post‐intervention Show forest plot | 10 | 2067 | Std. Mean Difference (IV, Random, 95% CI) | 0.24 [0.06, 0.41] |
| 16.1 Targeted | 9 | 1021 | Std. Mean Difference (IV, Random, 95% CI) | 0.27 [0.04, 0.50] |
| 16.2 Universal | 1 | 1046 | Std. Mean Difference (IV, Random, 95% CI) | 0.16 [0.04, 0.28] |
| 17 Social and general functioning (by population) short‐term follow‐up Show forest plot | 1 | 40 | Std. Mean Difference (IV, Random, 95% CI) | 0.81 [0.12, 1.49] |
| 17.1 Targeted | 1 | 40 | Std. Mean Difference (IV, Random, 95% CI) | 0.81 [0.12, 1.49] |
| 17.2 Universal | 0 | 0 | Std. Mean Difference (IV, Random, 95% CI) | 0.0 [0.0, 0.0] |
| 18 Social and general functioning (by population) medium‐term follow‐up Show forest plot | 11 | 2449 | Std. Mean Difference (IV, Random, 95% CI) | 0.15 [0.02, 0.28] |
| 18.1 Targeted | 9 | 1058 | Std. Mean Difference (IV, Random, 95% CI) | 0.19 [0.00, 0.38] |
| 18.2 Universal | 2 | 1391 | Std. Mean Difference (IV, Random, 95% CI) | 0.09 [‐0.01, 0.20] |
| 19 Social and general functioning (by population) long‐term follow‐up Show forest plot | 4 | 744 | Std. Mean Difference (IV, Random, 95% CI) | ‐0.01 [‐0.16, 0.14] |
| 19.1 Targeted | 3 | 342 | Std. Mean Difference (IV, Random, 95% CI) | ‐0.01 [‐0.22, 0.21] |
| 19.2 Universal | 1 | 402 | Std. Mean Difference (IV, Random, 95% CI) | ‐0.01 [‐0.21, 0.19] |
| Outcome or subgroup title | No. of studies | No. of participants | Statistical method | Effect size |
| 1 Depressive diagnosis medium‐term follow‐up Show forest plot | 22 | 3915 | Risk Difference (M‐H, Random, 95% CI) | ‐0.04 [‐0.07, ‐0.01] |
| 1.1 Treatment as usual | 12 | 2464 | Risk Difference (M‐H, Random, 95% CI) | ‐0.04 [‐0.09, 0.01] |
| 1.2 No treatment | 8 | 1286 | Risk Difference (M‐H, Random, 95% CI) | ‐0.03 [‐0.08, 0.01] |
| 1.3 Wait‐list | 1 | 95 | Risk Difference (M‐H, Random, 95% CI) | ‐0.08 [‐0.21, 0.05] |
| 1.4 Other | 1 | 70 | Risk Difference (M‐H, Random, 95% CI) | ‐0.12 [‐0.29, 0.04] |
| 2 Depression symptoms post‐intervention Show forest plot | 42 | 4816 | Std. Mean Difference (IV, Random, 95% CI) | ‐0.32 [‐0.42, ‐0.23] |
| 2.1 Treatment as usual | 16 | 2514 | Std. Mean Difference (IV, Random, 95% CI) | ‐0.30 [‐0.45, ‐0.15] |
| 2.2 No treatment | 14 | 1274 | Std. Mean Difference (IV, Random, 95% CI) | ‐0.39 [‐0.57, ‐0.21] |
| 2.3 Attention placebo | 4 | 466 | Std. Mean Difference (IV, Random, 95% CI) | ‐0.10 [‐0.32, 0.13] |
| 2.4 Wait‐list | 6 | 361 | Std. Mean Difference (IV, Random, 95% CI) | ‐0.49 [‐0.72, ‐0.26] |
| 2.5 Other | 2 | 201 | Std. Mean Difference (IV, Random, 95% CI) | ‐0.24 [‐0.51, 0.04] |
| 3 Depression symptoms medium‐term follow‐up Show forest plot | 29 | 4448 | Std. Mean Difference (IV, Random, 95% CI) | ‐0.23 [‐0.33, ‐0.12] |
| 3.1 Treatment as usual | 15 | 2315 | Std. Mean Difference (IV, Random, 95% CI) | ‐0.28 [‐0.42, ‐0.13] |
| 3.2 No treatment | 9 | 1207 | Std. Mean Difference (IV, Random, 95% CI) | ‐0.10 [‐0.30, 0.09] |
| 3.3 Attention placebo | 3 | 761 | Std. Mean Difference (IV, Random, 95% CI) | ‐0.11 [‐0.26, 0.03] |
| 3.4 Wait‐list | 1 | 95 | Std. Mean Difference (IV, Random, 95% CI) | ‐0.13 [‐0.55, 0.28] |
| 3.5 Other | 1 | 70 | Std. Mean Difference (IV, Random, 95% CI) | ‐1.14 [‐1.64, ‐0.63] |
| Outcome or subgroup title | No. of studies | No. of participants | Statistical method | Effect size |
| 1 Depressive diagnosis medium‐term follow‐up Show forest plot | 10 | 2050 | Risk Difference (M‐H, Random, 95% CI) | ‐0.01 [‐0.03, 0.01] |
| 1.1 Treatment as usual | 3 | 656 | Risk Difference (M‐H, Random, 95% CI) | ‐0.05 [‐0.17, 0.07] |
| 1.2 No treatment | 2 | 316 | Risk Difference (M‐H, Random, 95% CI) | 0.01 [‐0.05, 0.07] |
| 1.3 Attention placebo | 2 | 861 | Risk Difference (M‐H, Random, 95% CI) | ‐0.00 [‐0.04, 0.04] |
| 1.4 Wait‐list | 3 | 217 | Risk Difference (M‐H, Random, 95% CI) | ‐0.08 [‐0.24, 0.09] |
| 2 Depression symptoms post‐intervention Show forest plot | 31 | 9013 | Std. Mean Difference (IV, Random, 95% CI) | ‐0.11 [‐0.17, ‐0.05] |
| 2.1 Treatment as usual | 9 | 1791 | Std. Mean Difference (IV, Random, 95% CI) | ‐0.15 [‐0.31, 0.00] |
| 2.2 No treatment | 9 | 4231 | Std. Mean Difference (IV, Random, 95% CI) | ‐0.15 [‐0.25, ‐0.05] |
| 2.3 Attention placebo | 9 | 2180 | Std. Mean Difference (IV, Random, 95% CI) | ‐0.00 [‐0.09, 0.08] |
| 2.4 Wait‐list | 4 | 811 | Std. Mean Difference (IV, Random, 95% CI) | ‐0.12 [‐0.28, 0.04] |
| 3 Depression symptoms medium‐term follow‐up Show forest plot | 24 | 7465 | Std. Mean Difference (IV, Random, 95% CI) | ‐0.02 [‐0.08, 0.03] |
| 3.1 No treatment | 7 | 3367 | Std. Mean Difference (IV, Random, 95% CI) | 0.03 [‐0.10, 0.16] |
| 3.2 Treatment as usual | 6 | 1505 | Std. Mean Difference (IV, Random, 95% CI) | ‐0.05 [‐0.16, 0.05] |
| 3.3 Attention placebo | 7 | 1813 | Std. Mean Difference (IV, Random, 95% CI) | ‐0.01 [‐0.10, 0.09] |
| 3.4 Wait‐list | 4 | 780 | Std. Mean Difference (IV, Random, 95% CI) | ‐0.13 [‐0.34, 0.07] |
| 3.5 Other | 0 | 0 | Std. Mean Difference (IV, Random, 95% CI) | 0.0 [0.0, 0.0] |
| Outcome or subgroup title | No. of studies | No. of participants | Statistical method | Effect size |
| 1 Depressive diagnosis medium‐term follow‐up Show forest plot | 22 | 3915 | Risk Difference (M‐H, Random, 95% CI) | ‐0.04 [‐0.07, ‐0.01] |
| 1.1 Selective | 3 | 963 | Risk Difference (M‐H, Random, 95% CI) | 0.02 [‐0.07, 0.12] |
| 1.2 Indicated | 16 | 2374 | Risk Difference (M‐H, Random, 95% CI) | ‐0.03 [‐0.06, ‐0.01] |
| 1.3 Combined | 3 | 578 | Risk Difference (M‐H, Random, 95% CI) | ‐0.14 [‐0.21, ‐0.07] |
| 2 Depression symptoms (by population) post‐intervention Show forest plot | 42 | 4816 | Std. Mean Difference (IV, Random, 95% CI) | ‐0.32 [‐0.42, ‐0.23] |
| 2.1 Selective | 9 | 1394 | Std. Mean Difference (IV, Random, 95% CI) | ‐0.16 [‐0.30, ‐0.02] |
| 2.2 Indicated | 29 | 2740 | Std. Mean Difference (IV, Random, 95% CI) | ‐0.37 [‐0.50, ‐0.24] |
| 2.3 Combined | 4 | 682 | Std. Mean Difference (IV, Random, 95% CI) | ‐0.30 [‐0.45, ‐0.15] |
| Outcome or subgroup title | No. of studies | No. of participants | Statistical method | Effect size |
| 1 Depression scores (by assessor) post‐intervention Show forest plot | 9 | Std. Mean Difference (IV, Random, 95% CI) | Subtotals only | |
| 1.1 Self‐reported | 9 | 1877 | Std. Mean Difference (IV, Random, 95% CI) | ‐0.32 [‐0.53, ‐0.12] |
| 1.2 Clinician‐rated | 9 | 1884 | Std. Mean Difference (IV, Random, 95% CI) | ‐0.25 [‐0.46, ‐0.04] |
| 2 Depression scores medium‐term follow‐up Show forest plot | 7 | Std. Mean Difference (IV, Random, 95% CI) | Subtotals only | |
| 2.1 Self‐reported | 7 | 1465 | Std. Mean Difference (IV, Random, 95% CI) | ‐0.21 [‐0.41, ‐0.02] |
| 2.2 Clinician‐rated | 7 | 1468 | Std. Mean Difference (IV, Random, 95% CI) | ‐0.13 [‐0.32, 0.06] |
| 3 Depression scores long‐term follow‐up Show forest plot | 4 | Std. Mean Difference (IV, Random, 95% CI) | Subtotals only | |
| 3.1 Self‐reported | 4 | 390 | Std. Mean Difference (IV, Random, 95% CI) | ‐0.11 [‐0.37, 0.16] |
| 3.2 Clinician‐rated | 4 | 388 | Std. Mean Difference (IV, Random, 95% CI) | ‐0.06 [‐0.27, 0.14] |