| 1 Depressive diagnosis (by population) post‐intervention Show forest plot | 20 | 3232 | Risk Difference (M‐H, Random, 95% CI) | ‐0.05 [‐0.08, ‐0.02] |
|
| 1.1 Targeted | 13 | 2022 | Risk Difference (M‐H, Random, 95% CI) | ‐0.06 [‐0.10, ‐0.02] |
| 1.2 Universal | 7 | 1210 | Risk Difference (M‐H, Random, 95% CI) | ‐0.04 [‐0.08, 0.00] |
| 2 Depressive diagnosis short‐term follow‐up Show forest plot | 6 | 724 | Risk Difference (M‐H, Random, 95% CI) | ‐0.04 [‐0.11, 0.03] |
|
| 2.1 Targeted | 4 | 360 | Risk Difference (M‐H, Random, 95% CI) | ‐0.11 [‐0.19, ‐0.02] |
| 2.2 Universal | 2 | 364 | Risk Difference (M‐H, Random, 95% CI) | 0.03 [‐0.04, 0.10] |
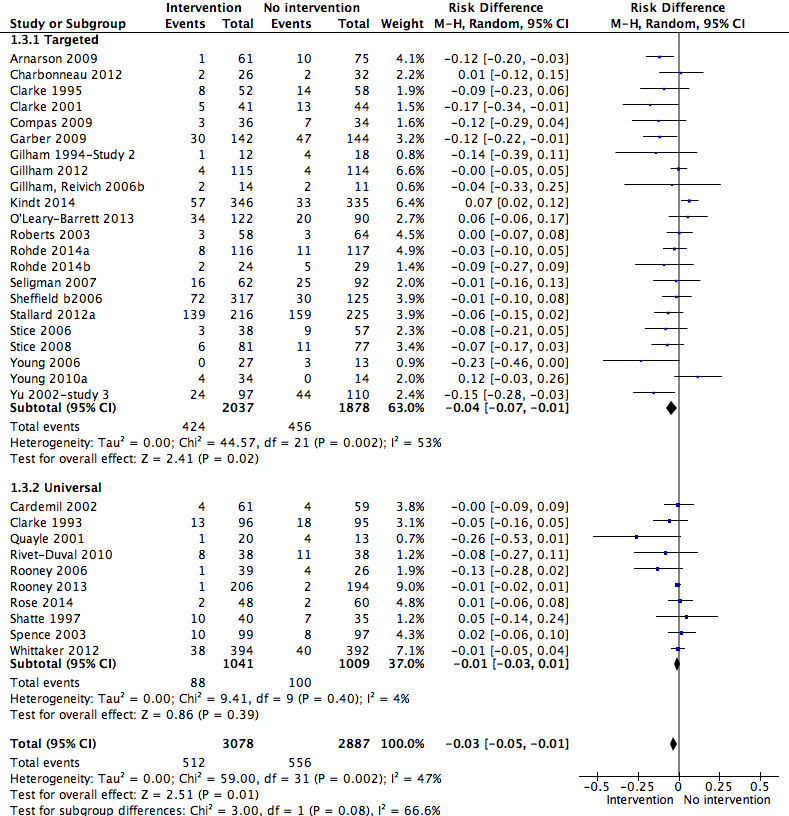
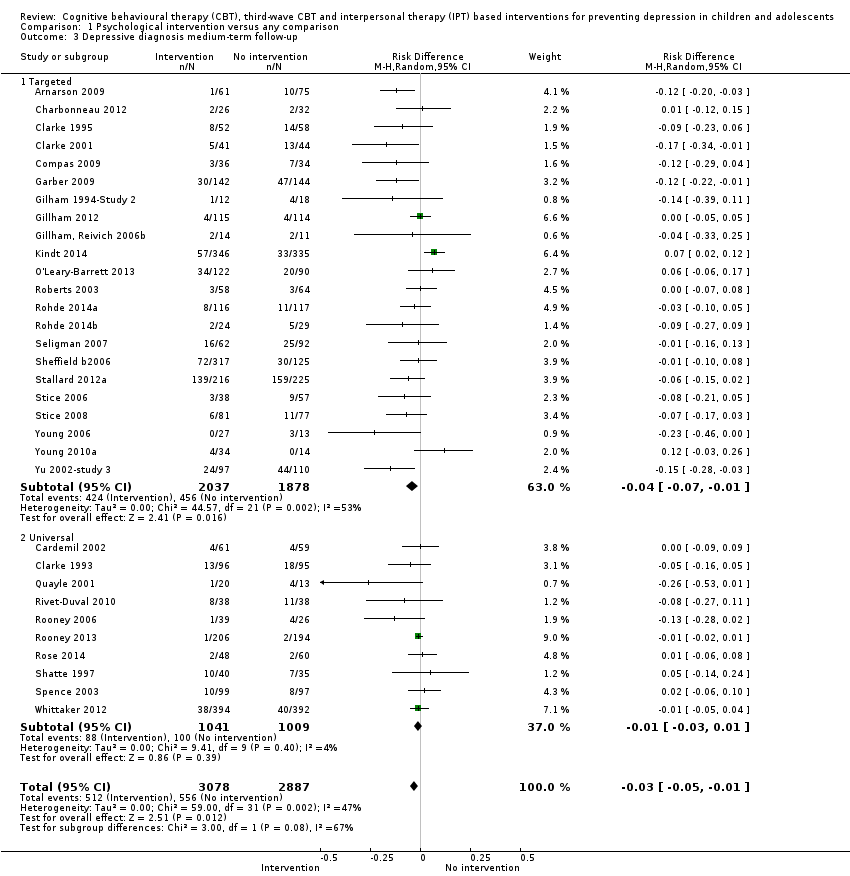
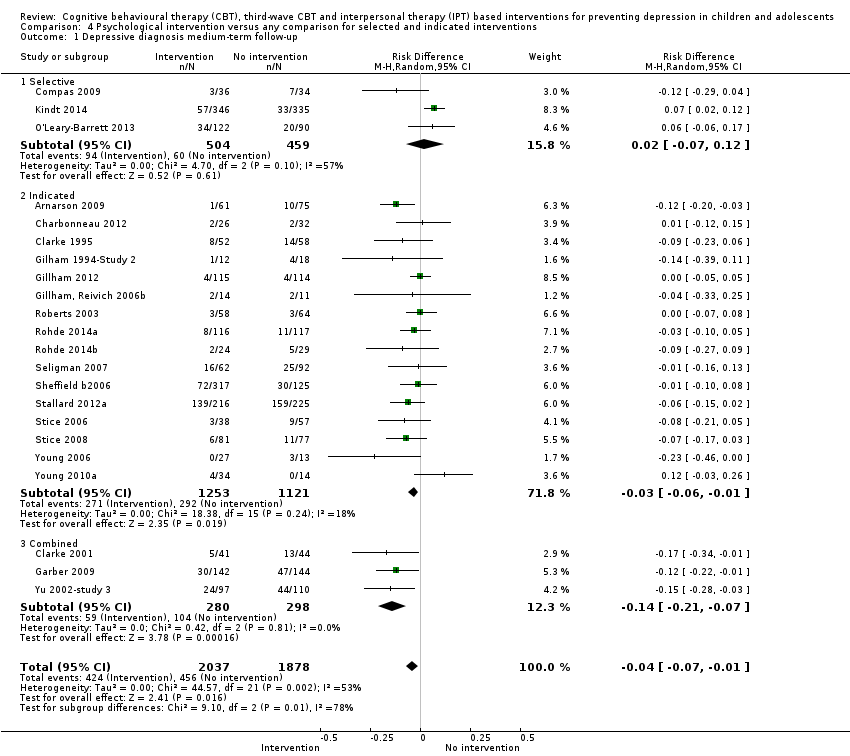
| 3 Depressive diagnosis medium‐term follow‐up Show forest plot | 32 | 5965 | Risk Difference (M‐H, Random, 95% CI) | ‐0.03 [‐0.05, ‐0.01] |
|
| 3.1 Targeted | 22 | 3915 | Risk Difference (M‐H, Random, 95% CI) | ‐0.04 [‐0.07, ‐0.01] |
| 3.2 Universal | 10 | 2050 | Risk Difference (M‐H, Random, 95% CI) | ‐0.01 [‐0.03, 0.01] |
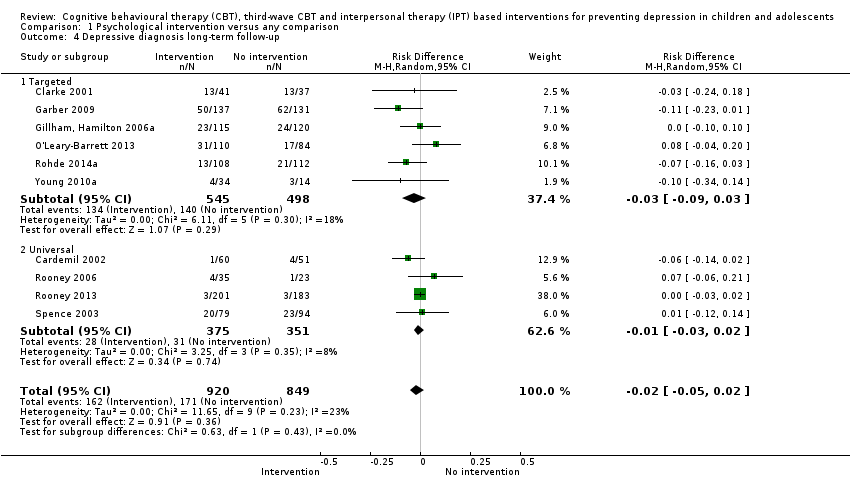
| 4 Depressive diagnosis long‐term follow‐up Show forest plot | 10 | 1769 | Risk Difference (M‐H, Random, 95% CI) | ‐0.02 [‐0.05, 0.02] |
|
| 4.1 Targeted | 6 | 1043 | Risk Difference (M‐H, Random, 95% CI) | ‐0.03 [‐0.09, 0.03] |
| 4.2 Universal | 4 | 726 | Risk Difference (M‐H, Random, 95% CI) | ‐0.01 [‐0.03, 0.02] |
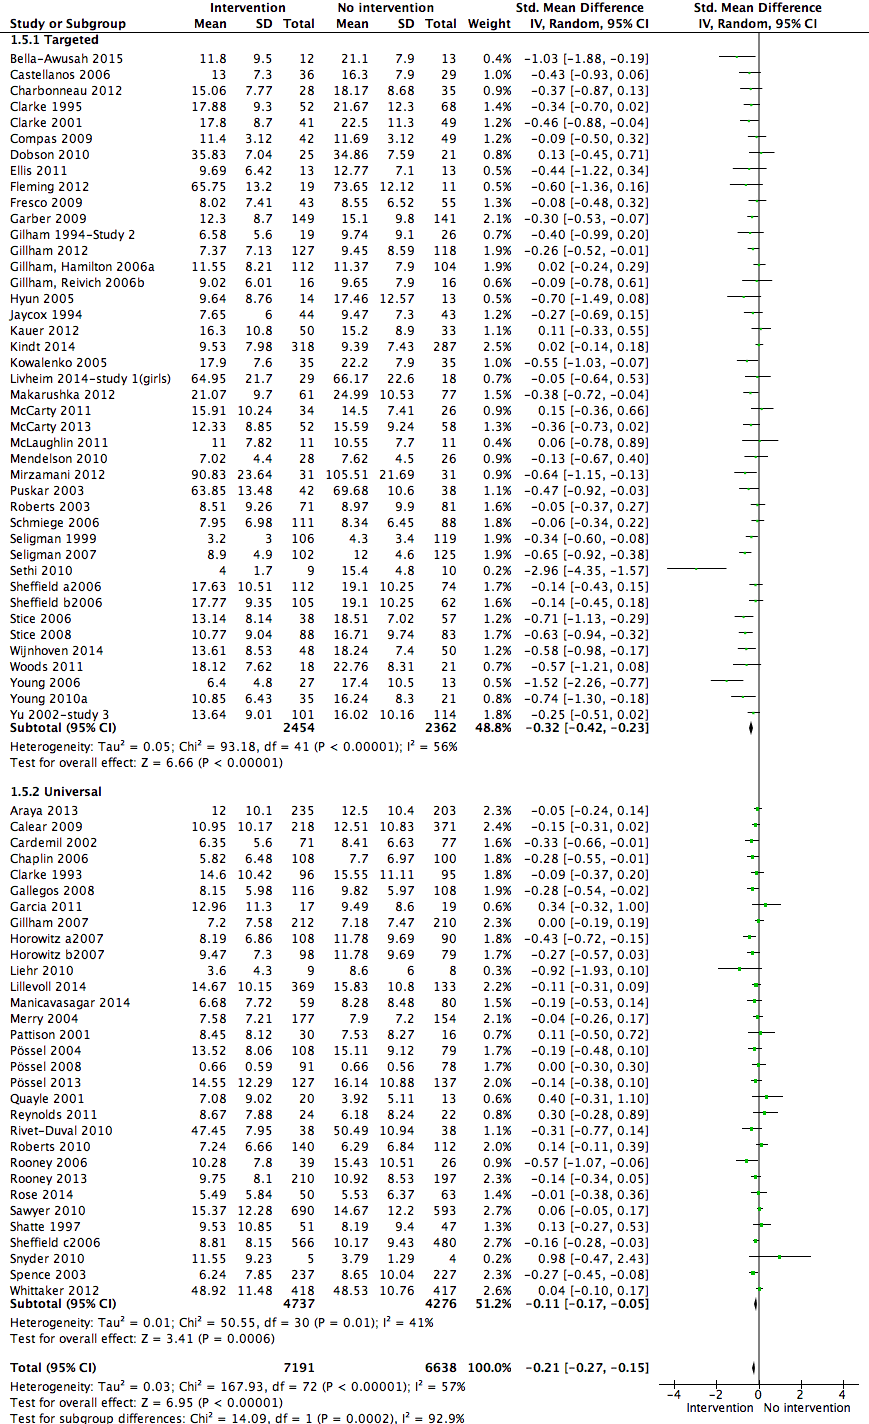
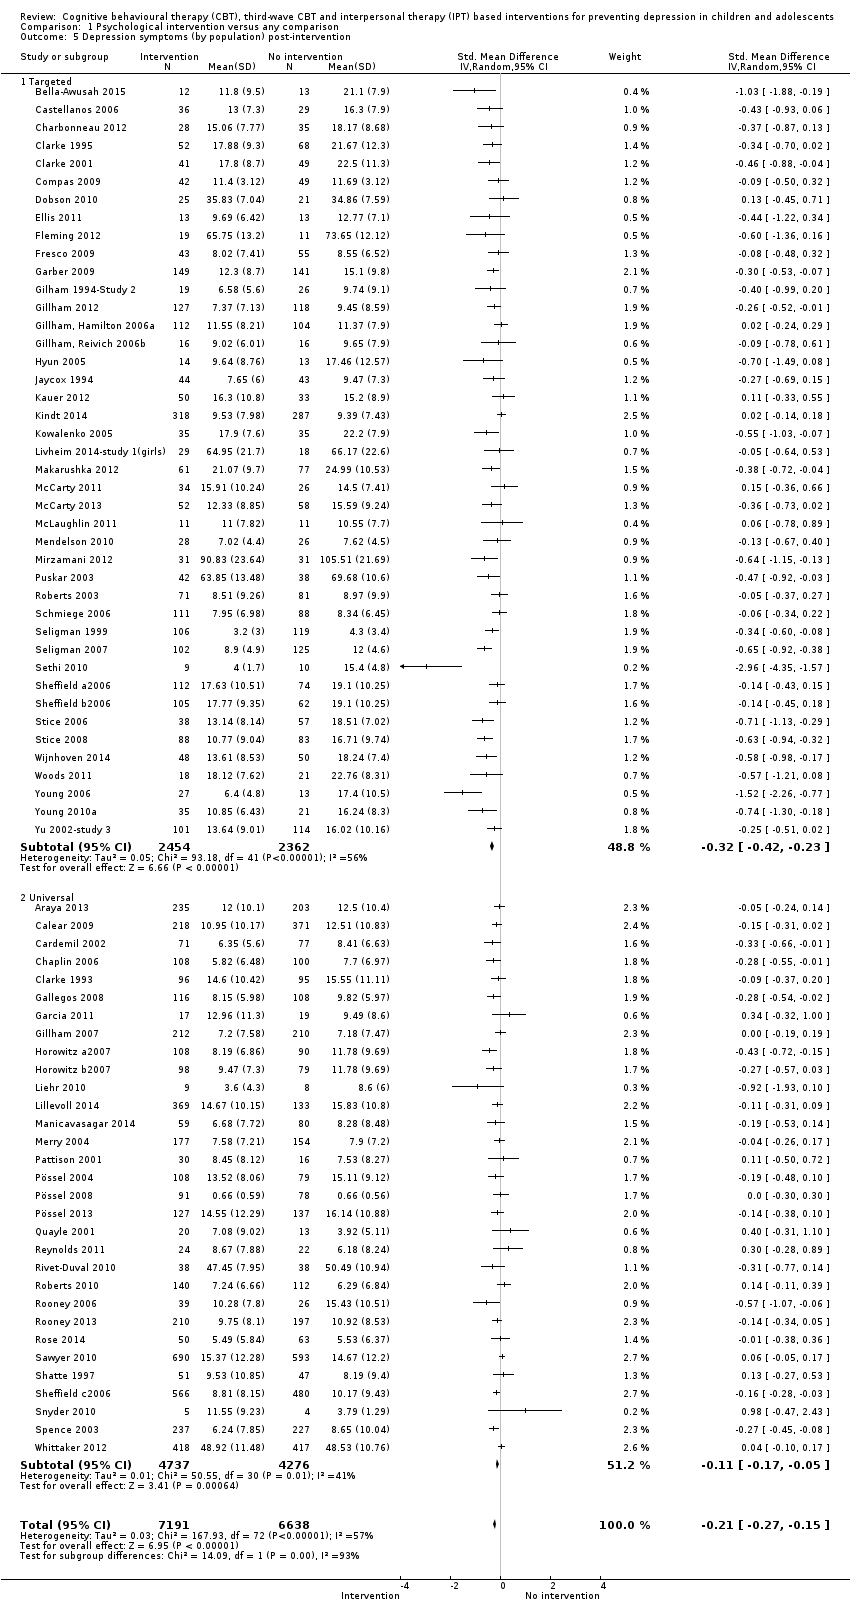
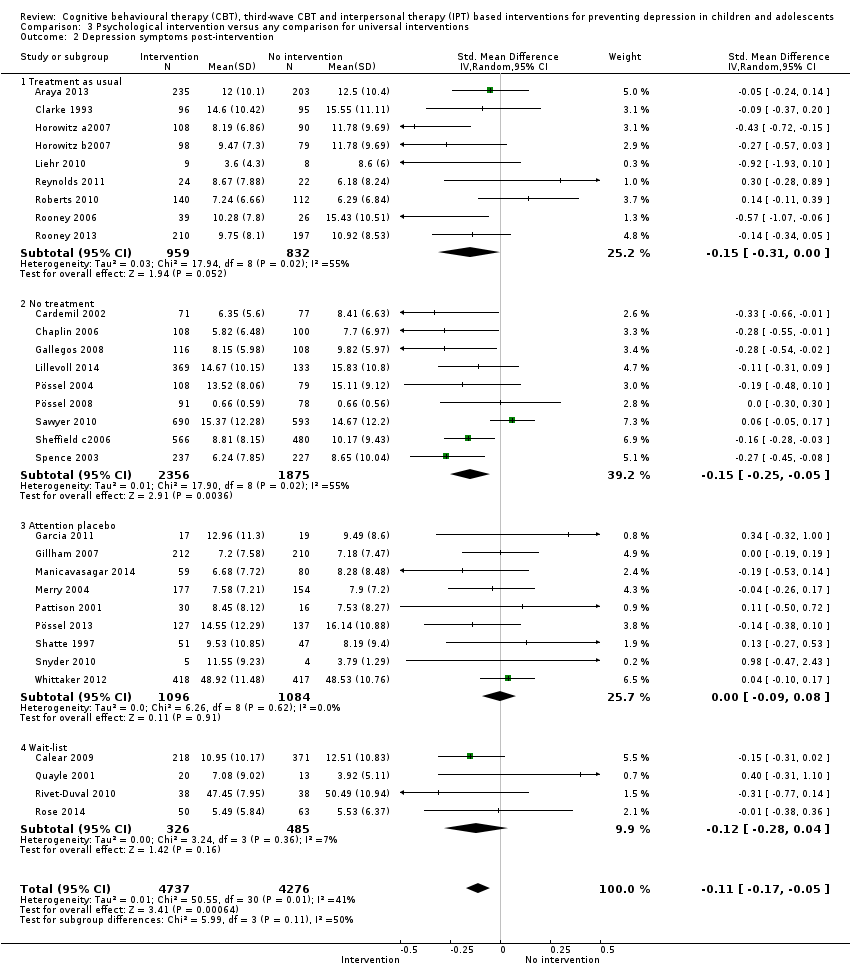
| 5 Depression symptoms (by population) post‐intervention Show forest plot | 73 | 13829 | Std. Mean Difference (IV, Random, 95% CI) | ‐0.21 [‐0.27, ‐0.15] |
|
| 5.1 Targeted | 42 | 4816 | Std. Mean Difference (IV, Random, 95% CI) | ‐0.32 [‐0.42, ‐0.23] |
| 5.2 Universal | 31 | 9013 | Std. Mean Difference (IV, Random, 95% CI) | ‐0.11 [‐0.17, ‐0.05] |
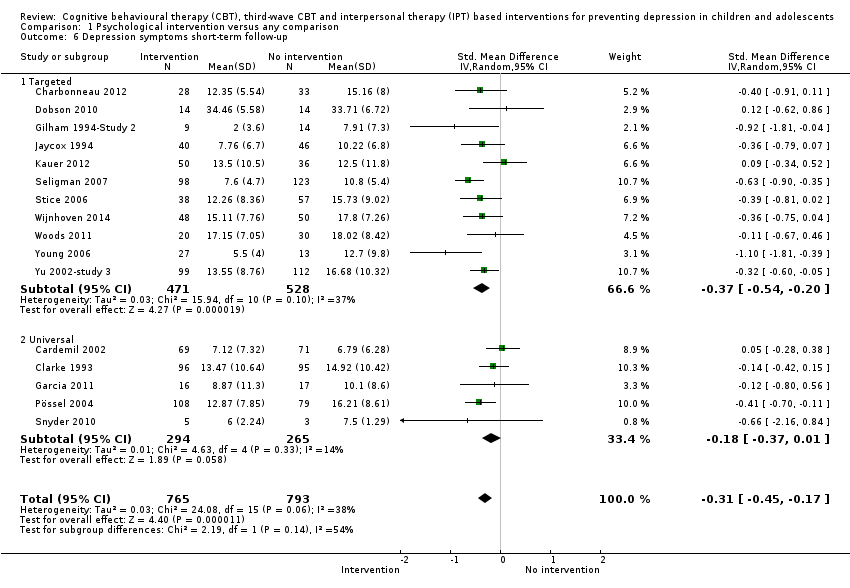
| 6 Depression symptoms short‐term follow‐up Show forest plot | 16 | 1558 | Std. Mean Difference (IV, Random, 95% CI) | ‐0.31 [‐0.45, ‐0.17] |
|
| 6.1 Targeted | 11 | 999 | Std. Mean Difference (IV, Random, 95% CI) | ‐0.37 [‐0.54, ‐0.20] |
| 6.2 Universal | 5 | 559 | Std. Mean Difference (IV, Random, 95% CI) | ‐0.18 [‐0.37, 0.01] |
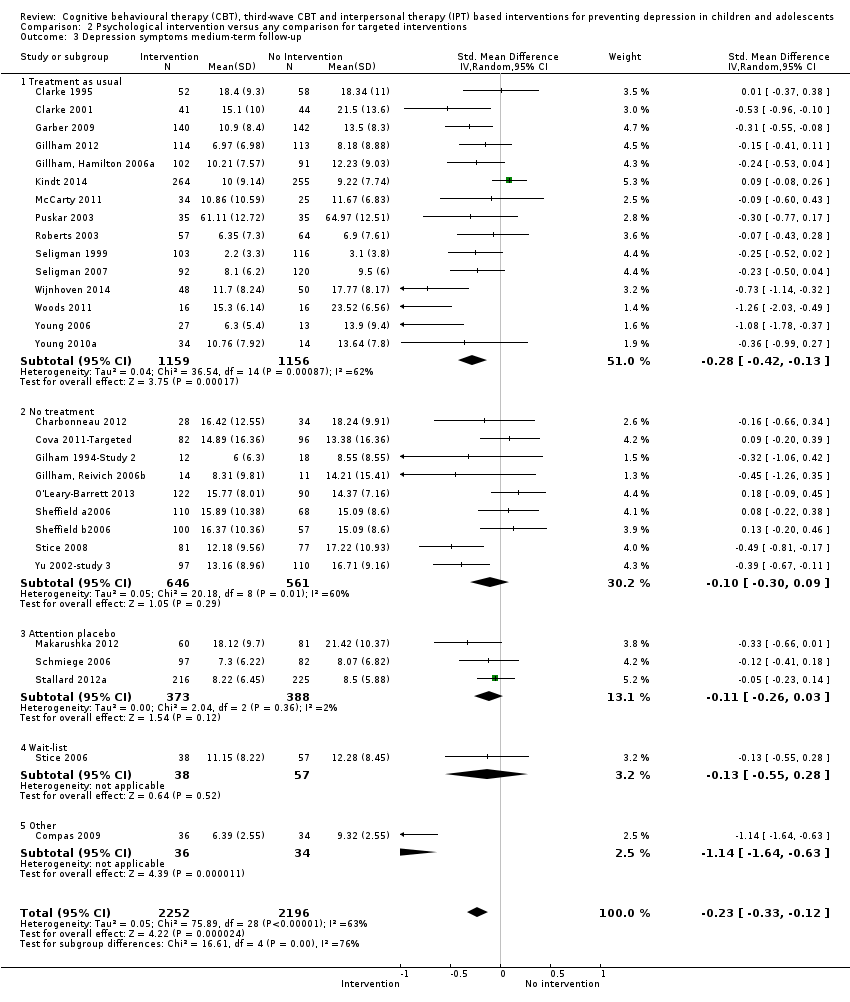
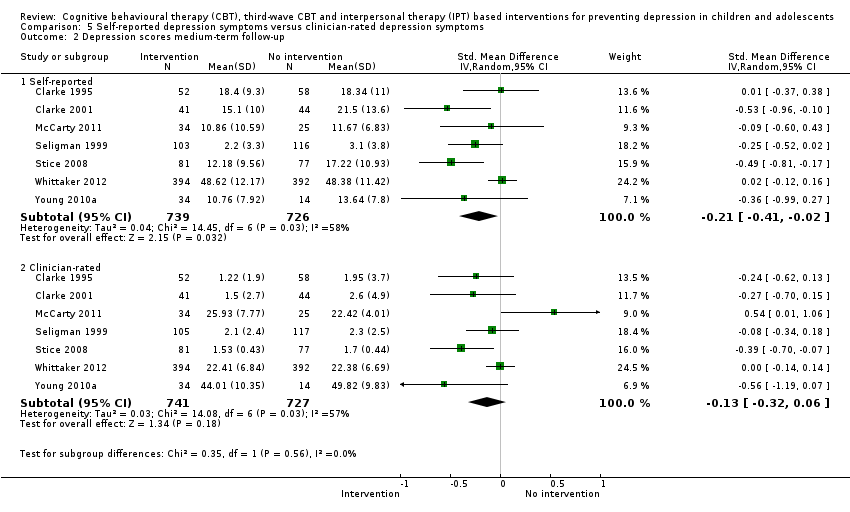
| 7 Depression symptoms medium‐term follow‐up Show forest plot | 53 | 11913 | Std. Mean Difference (IV, Random, 95% CI) | ‐0.12 [‐0.18, ‐0.05] |
|
| 7.1 Targeted | 29 | 4448 | Std. Mean Difference (IV, Random, 95% CI) | ‐0.23 [‐0.33, ‐0.12] |
| 7.2 Universal | 24 | 7465 | Std. Mean Difference (IV, Random, 95% CI) | ‐0.02 [‐0.08, 0.03] |
| 8 Depression symptoms long‐term follow‐up Show forest plot | 15 | 3836 | Std. Mean Difference (IV, Random, 95% CI) | 0.00 [‐0.06, 0.06] |
|
| 8.1 Targeted | 7 | 847 | Std. Mean Difference (IV, Random, 95% CI) | ‐0.05 [‐0.21, 0.11] |
| 8.2 Universal | 8 | 2989 | Std. Mean Difference (IV, Random, 95% CI) | 0.02 [‐0.06, 0.09] |
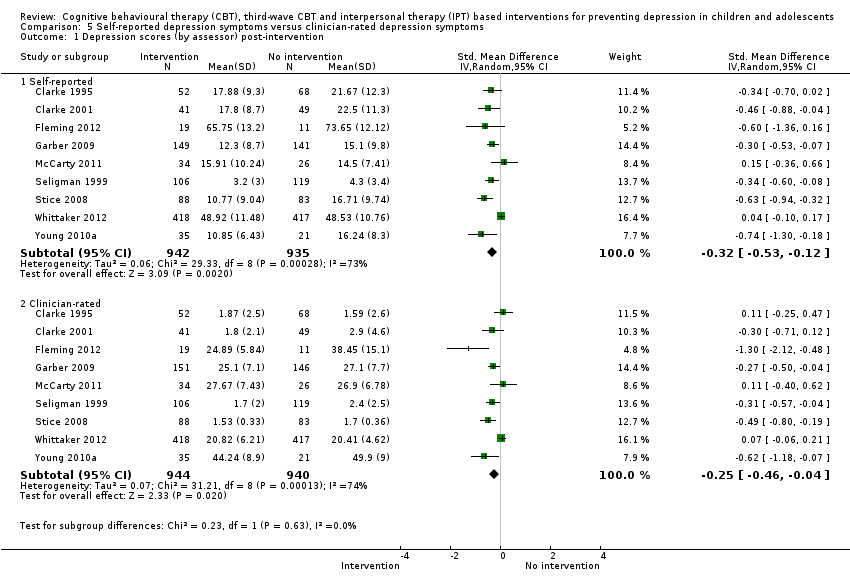
| 9 Depression symptoms clinician‐rated (by population) post‐intervention Show forest plot | 11 | 2175 | Std. Mean Difference (IV, Random, 95% CI) | ‐0.23 [‐0.41, ‐0.05] |
|
| 9.1 Targeted | 10 | 1340 | Std. Mean Difference (IV, Random, 95% CI) | ‐0.28 [‐0.44, ‐0.11] |
| 9.2 Universal | 1 | 835 | Std. Mean Difference (IV, Random, 95% CI) | 0.07 [‐0.06, 0.21] |
| 10 Depression symptoms clinician‐rated medium‐term follow‐up Show forest plot | 9 | 1754 | Std. Mean Difference (IV, Random, 95% CI) | ‐0.08 [‐0.24, 0.07] |
|
| 10.1 Targeted | 8 | 968 | Std. Mean Difference (IV, Random, 95% CI) | ‐0.10 [‐0.30, 0.09] |
| 10.2 Universal | 1 | 786 | Std. Mean Difference (IV, Random, 95% CI) | 0.00 [‐0.14, 0.14] |
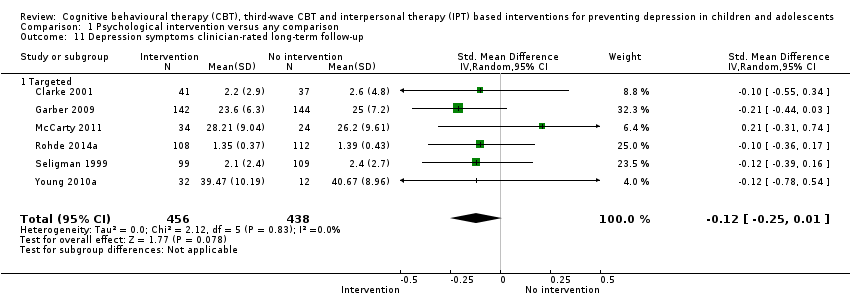
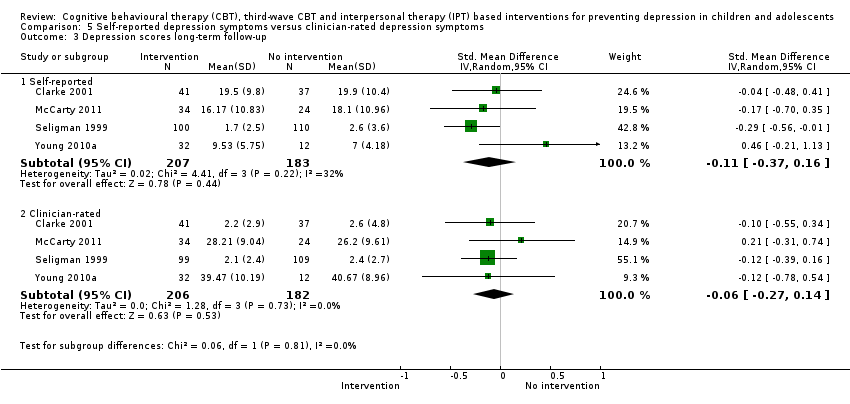
| 11 Depression symptoms clinician‐rated long‐term follow‐up Show forest plot | 6 | 894 | Std. Mean Difference (IV, Random, 95% CI) | ‐0.12 [‐0.25, 0.01] |
|
| 11.1 Targeted | 6 | 894 | Std. Mean Difference (IV, Random, 95% CI) | ‐0.12 [‐0.25, 0.01] |
| 12 Anxiety symptoms (by population) post‐intervention Show forest plot | 23 | 5017 | Std. Mean Difference (IV, Random, 95% CI) | ‐0.07 [‐0.16, 0.02] |
|
| 12.1 Targeted | 13 | 1666 | Std. Mean Difference (IV, Random, 95% CI) | ‐0.13 [‐0.31, 0.04] |
| 12.2 Universal | 10 | 3351 | Std. Mean Difference (IV, Random, 95% CI) | ‐0.04 [‐0.13, 0.05] |
| 13 Anxiety symptoms (by population) short‐term follow‐up Show forest plot | 3 | 334 | Std. Mean Difference (IV, Random, 95% CI) | ‐0.33 [‐0.59, ‐0.07] |
|
| 13.1 Targeted | 3 | 334 | Std. Mean Difference (IV, Random, 95% CI) | ‐0.33 [‐0.59, ‐0.07] |
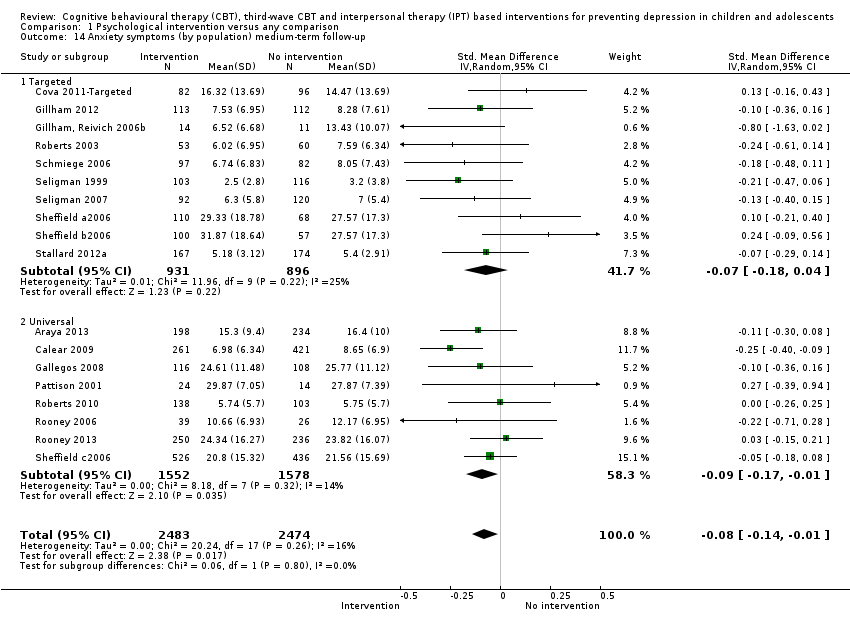
| 14 Anxiety symptoms (by population) medium‐term follow‐up Show forest plot | 18 | 4957 | Std. Mean Difference (IV, Random, 95% CI) | ‐0.08 [‐0.14, ‐0.01] |
|
| 14.1 Targeted | 10 | 1827 | Std. Mean Difference (IV, Random, 95% CI) | ‐0.07 [‐0.18, 0.04] |
| 14.2 Universal | 8 | 3130 | Std. Mean Difference (IV, Random, 95% CI) | ‐0.09 [‐0.17, ‐0.01] |
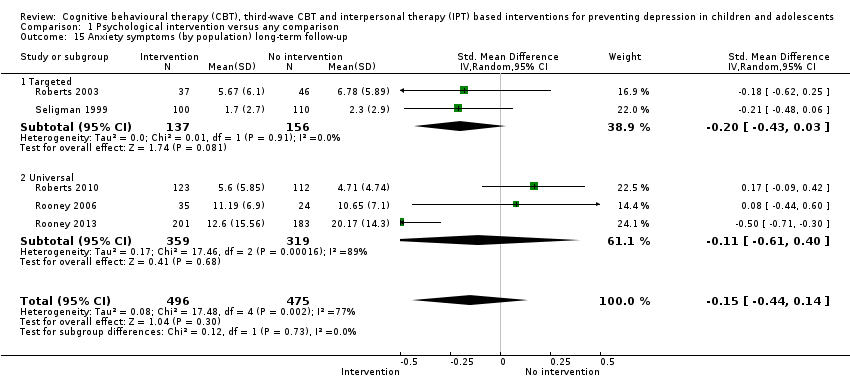
| 15 Anxiety symptoms (by population) long‐term follow‐up Show forest plot | 5 | 971 | Std. Mean Difference (IV, Random, 95% CI) | ‐0.15 [‐0.44, 0.14] |
|
| 15.1 Targeted | 2 | 293 | Std. Mean Difference (IV, Random, 95% CI) | ‐0.20 [‐0.43, 0.03] |
| 15.2 Universal | 3 | 678 | Std. Mean Difference (IV, Random, 95% CI) | ‐0.11 [‐0.61, 0.40] |
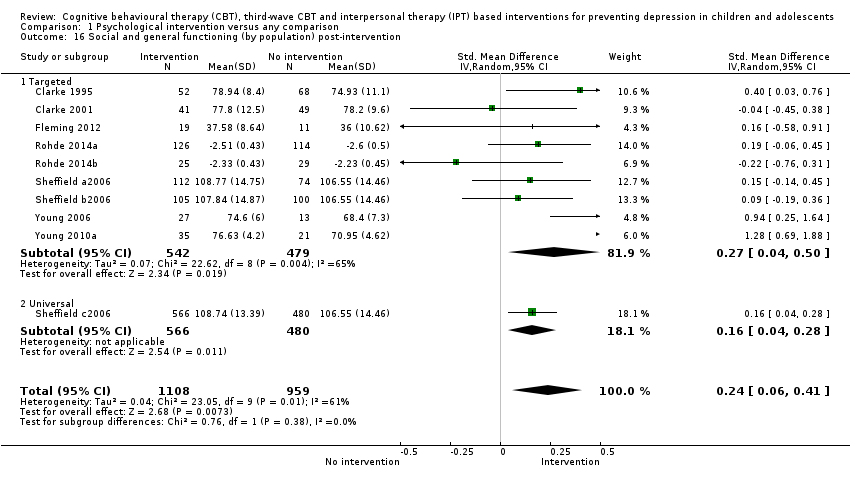
| 16 Social and general functioning (by population) post‐intervention Show forest plot | 10 | 2067 | Std. Mean Difference (IV, Random, 95% CI) | 0.24 [0.06, 0.41] |
|
| 16.1 Targeted | 9 | 1021 | Std. Mean Difference (IV, Random, 95% CI) | 0.27 [0.04, 0.50] |
| 16.2 Universal | 1 | 1046 | Std. Mean Difference (IV, Random, 95% CI) | 0.16 [0.04, 0.28] |
| 17 Social and general functioning (by population) short‐term follow‐up Show forest plot | 1 | 40 | Std. Mean Difference (IV, Random, 95% CI) | 0.81 [0.12, 1.49] |
|
| 17.1 Targeted | 1 | 40 | Std. Mean Difference (IV, Random, 95% CI) | 0.81 [0.12, 1.49] |
| 17.2 Universal | 0 | 0 | Std. Mean Difference (IV, Random, 95% CI) | 0.0 [0.0, 0.0] |
| 18 Social and general functioning (by population) medium‐term follow‐up Show forest plot | 11 | 2449 | Std. Mean Difference (IV, Random, 95% CI) | 0.15 [0.02, 0.28] |
|
| 18.1 Targeted | 9 | 1058 | Std. Mean Difference (IV, Random, 95% CI) | 0.19 [0.00, 0.38] |
| 18.2 Universal | 2 | 1391 | Std. Mean Difference (IV, Random, 95% CI) | 0.09 [‐0.01, 0.20] |
| 19 Social and general functioning (by population) long‐term follow‐up Show forest plot | 4 | 744 | Std. Mean Difference (IV, Random, 95% CI) | ‐0.01 [‐0.16, 0.14] |
|
| 19.1 Targeted | 3 | 342 | Std. Mean Difference (IV, Random, 95% CI) | ‐0.01 [‐0.22, 0.21] |
| 19.2 Universal | 1 | 402 | Std. Mean Difference (IV, Random, 95% CI) | ‐0.01 [‐0.21, 0.19] |