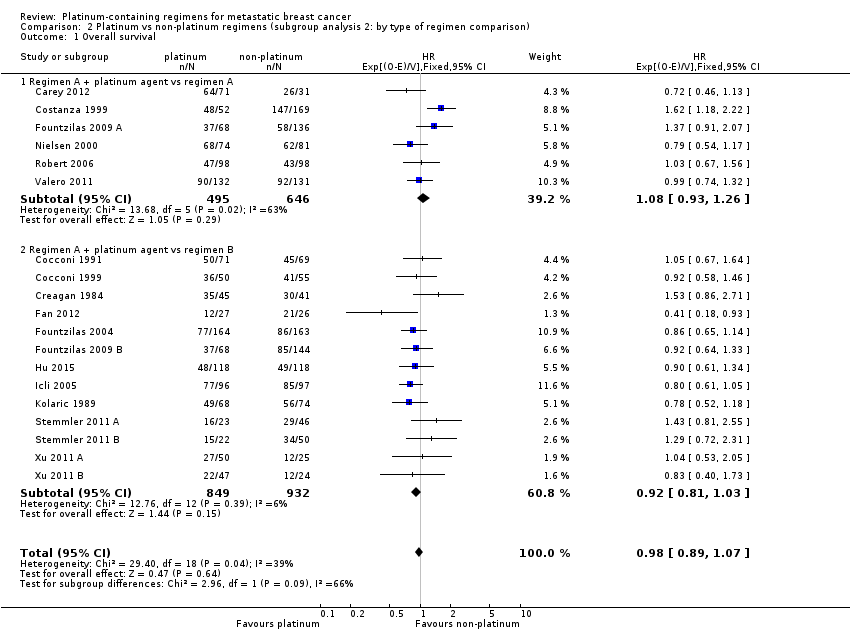
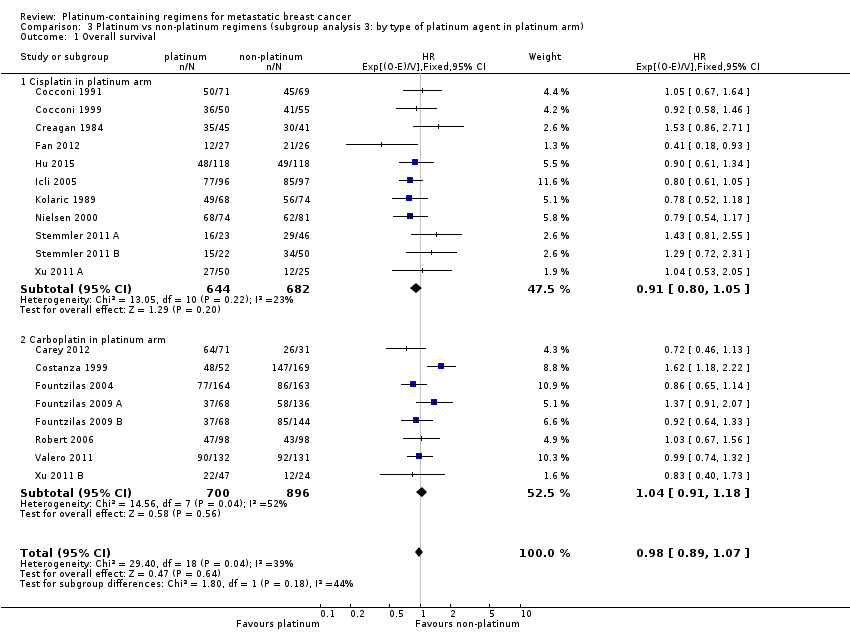
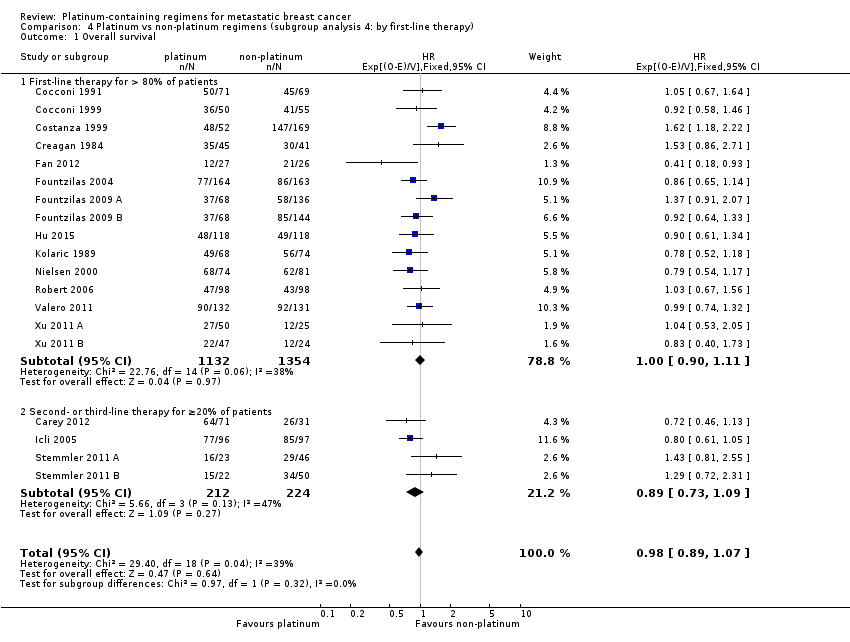
| 1 Overall survival Show forest plot | 19 | 2922 | HR (95% CI) | 0.98 [0.89, 1.07] |
|
| 1.1 Cisplatin in platinum arm | 11 | 1326 | HR (95% CI) | 0.91 [0.80, 1.05] |
| 1.2 Carboplatin in platinum arm | 8 | 1596 | HR (95% CI) | 1.04 [0.91, 1.18] |
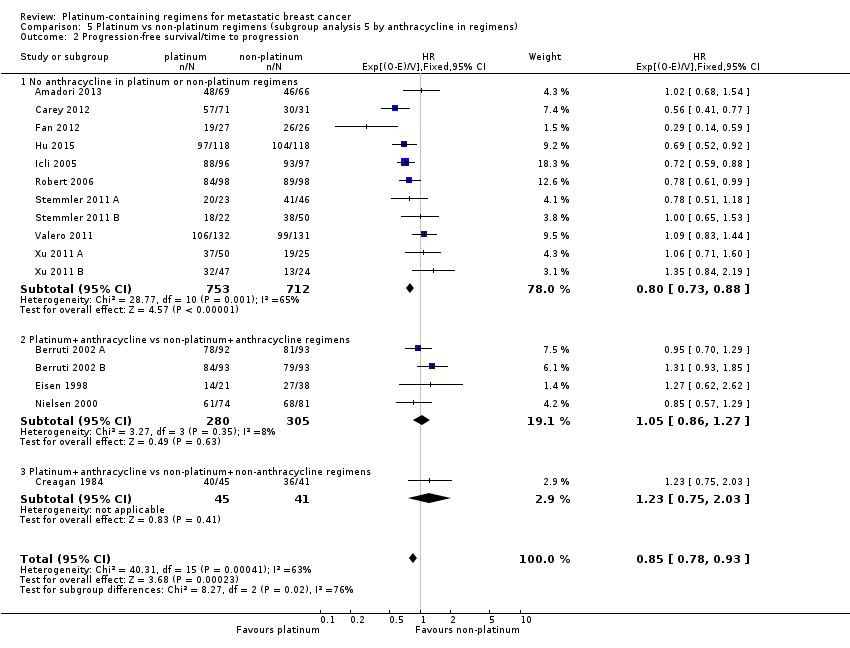
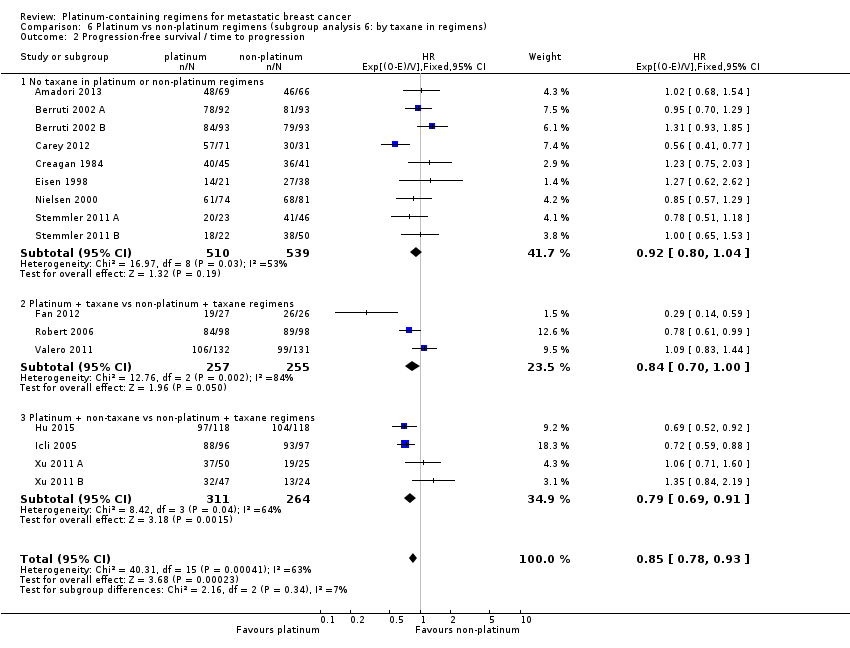
| 2 Progression‐free survival/time to progression Show forest plot | 16 | 2136 | HR (95% CI) | 0.85 [0.78, 0.93] |
|
| 2.1 Cisplatin in platinum arm | 11 | 1369 | HR (95% CI) | 0.85 [0.76, 0.94] |
| 2.2 Carboplatin in platinum arm | 5 | 767 | HR (95% CI) | 0.86 [0.75, 0.99] |
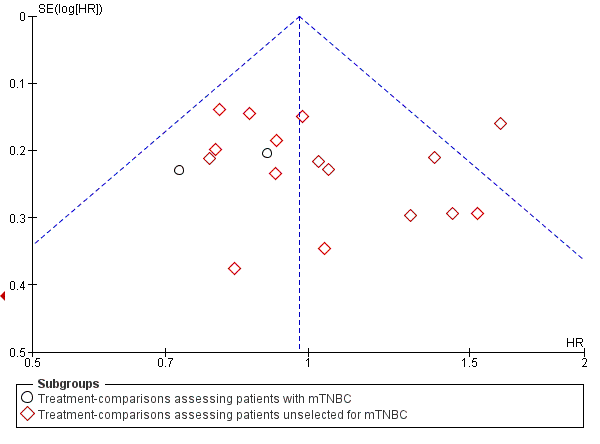
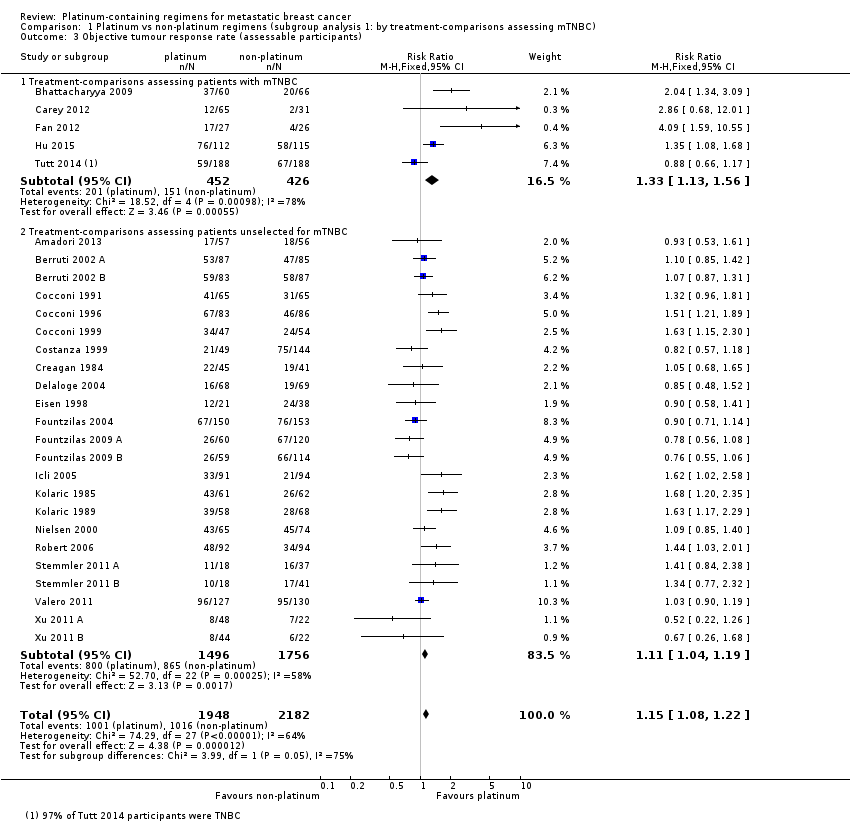
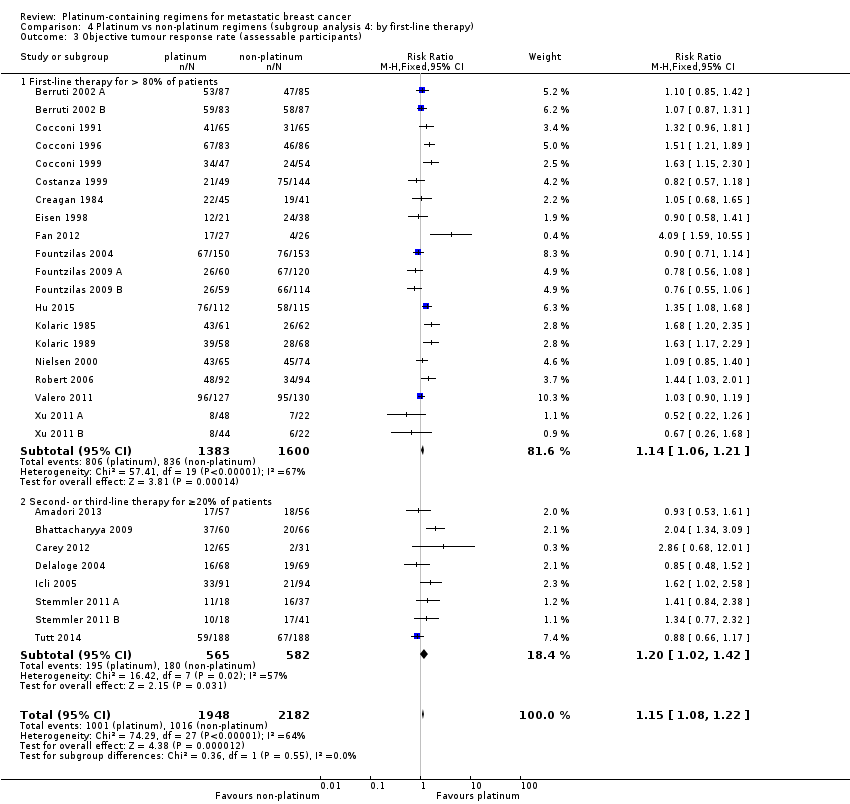
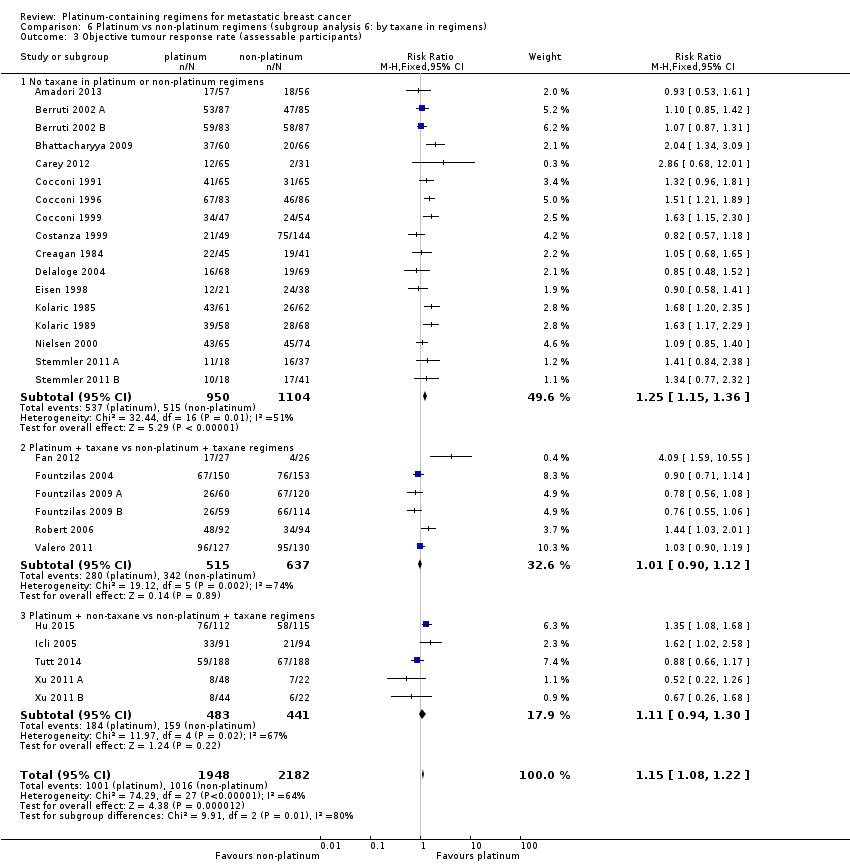
| 3 Objective tumour response rate (assessable participants) Show forest plot | 28 | 4130 | Risk Ratio (M‐H, Fixed, 95% CI) | 1.15 [1.08, 1.22] |
|
| 3.1 Cisplatin in platinum arm | 17 | 2050 | Risk Ratio (M‐H, Fixed, 95% CI) | 1.35 [1.24, 1.46] |
| 3.2 Carboplatin in platinum arm | 10 | 1943 | Risk Ratio (M‐H, Fixed, 95% CI) | 0.94 [0.86, 1.04] |
| 3.3 Oxaliplatin in platinum arm | 1 | 137 | Risk Ratio (M‐H, Fixed, 95% CI) | 0.85 [0.48, 1.52] |
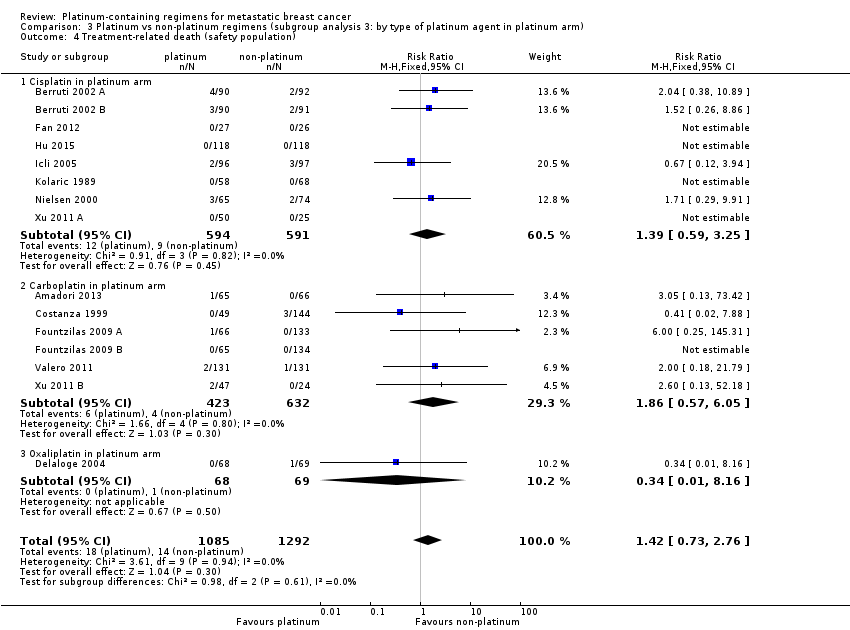
| 4 Treatment‐related death (safety population) Show forest plot | 15 | 2377 | Risk Ratio (M‐H, Fixed, 95% CI) | 1.42 [0.73, 2.76] |
|
| 4.1 Cisplatin in platinum arm | 8 | 1185 | Risk Ratio (M‐H, Fixed, 95% CI) | 1.39 [0.59, 3.25] |
| 4.2 Carboplatin in platinum arm | 6 | 1055 | Risk Ratio (M‐H, Fixed, 95% CI) | 1.86 [0.57, 6.05] |
| 4.3 Oxaliplatin in platinum arm | 1 | 137 | Risk Ratio (M‐H, Fixed, 95% CI) | 0.34 [0.01, 8.16] |
| 5 Nausea/vomiting (safety population) Show forest plot | 21 | 3172 | Risk Ratio (M‐H, Fixed, 95% CI) | 2.07 [1.69, 2.54] |
|
| 5.1 Cisplatin in platinum arm | 14 | 1731 | Risk Ratio (M‐H, Fixed, 95% CI) | 2.65 [2.10, 3.34] |
| 5.2 Carboplatin in platinum arm | 7 | 1441 | Risk Ratio (M‐H, Fixed, 95% CI) | 0.77 [0.47, 1.26] |
| 6 Nephrotoxicity (safety population) Show forest plot | 5 | 632 | Risk Ratio (M‐H, Fixed, 95% CI) | 3.06 [0.86, 10.84] |
|
| 6.1 Cisplatin in platinum arm | 4 | 561 | Risk Ratio (M‐H, Fixed, 95% CI) | 3.46 [0.86, 13.97] |
| 6.2 Carboplatin in platinum arm | 1 | 71 | Risk Ratio (M‐H, Fixed, 95% CI) | 1.56 [0.07, 36.97] |
| 7 Anaemia (safety population) Show forest plot | 20 | 3085 | Risk Ratio (M‐H, Fixed, 95% CI) | 2.61 [1.90, 3.58] |
|
| 7.1 Cisplatin in platinum arm | 13 | 1644 | Risk Ratio (M‐H, Fixed, 95% CI) | 3.72 [2.36, 5.88] |
| 7.2 Carboplatin in platinum arm | 7 | 1441 | Risk Ratio (M‐H, Fixed, 95% CI) | 1.72 [1.10, 2.70] |
| 8 Hair loss (safety population) Show forest plot | 12 | 1452 | Risk Ratio (M‐H, Fixed, 95% CI) | 1.41 [1.26, 1.58] |
|
| 8.1 Cisplatin in platinum arm | 9 | 983 | Risk Ratio (M‐H, Fixed, 95% CI) | 1.33 [1.15, 1.54] |
| 8.2 Carboplatin in platinum arm | 3 | 469 | Risk Ratio (M‐H, Fixed, 95% CI) | 1.53 [1.28, 1.84] |
| 9 Leukopenia (safety population) Show forest plot | 22 | 3176 | Risk Ratio (M‐H, Fixed, 95% CI) | 1.38 [1.21, 1.57] |
|
| 9.1 Cisplatin in platinum arm | 15 | 1866 | Risk Ratio (M‐H, Fixed, 95% CI) | 1.49 [1.23, 1.81] |
| 9.2 Carboplatin in platinum arm | 7 | 1310 | Risk Ratio (M‐H, Fixed, 95% CI) | 1.27 [1.07, 1.50] |