Quimioterapia combinada versus quimioterapia con agente único secuencial para el cáncer de mama metastásico
Resumen
Antecedentes
La quimioterapia combinada puede causar una mayor muerte de las células tumorales si la dosis del fármaco no se compromete, mientras que la quimioterapia con agente único secuencial puede permitir una mayor intensidad de la dosis y del tiempo de tratamiento, lo que potencialmente significa un efecto beneficioso mayor de cada agente único. Además, los agentes únicos utilizados secuencialmente podrían causar menos toxicidad y deterioro de la calidad de vida, pero no se sabe si podrían comprometer el tiempo de supervivencia.
Objetivos
Evaluar el efecto de la quimioterapia combinada comparada con los mismos fármacos administrados secuencialmente en pacientes con cáncer de mama metastásico.
Métodos de búsqueda
Se hicieron búsquedas en el registro especializado del Grupo Cochrane de Cáncer de Mama (Cochrane Breast Cancer Group) mediante los términos de búsqueda "advanced breast cancer" y "chemotherapy", MEDLINE y EMBASE el 31 de octubre de 2013. También se hicieron búsquedas en la World Health Organization International Clinical Trials Registry Platform y en ClinicalTrials.gov (22 de marzo de 2012).
Criterios de selección
Ensayos controlados aleatorizados de quimioterapia combinada en comparación con los mismos fármacos utilizados secuencialmente en pacientes con cáncer de mama metastásico en contextos de primera, segunda o tercera línea.
Obtención y análisis de los datos
Dos autores de la revisión extrajeron los datos de los ensayos incluidos de forma independiente. Cuando fue posible, se derivaron los cocientes de riesgos instantáneos (CRI) para los resultados del tiempo transcurrido hasta el evento y se utilizó un modelo de efectos fijos para el metanálisis. Las tasas de respuesta se analizaron como variables dicotómicas (riesgos relativos [RR]) y se extrajeron los datos de toxicidad y calidad de vida cuando estuvieron disponibles.
Resultados principales
Se identificaron 12 ensayos que informaron nueve comparaciones de tratamientos (2317 pacientes asignadas al azar). La mayoría de los ensayos (10 ensayos) tuvo un riesgo incierto o alto de sesgo. Los datos del tiempo transcurrido hasta el evento se obtuvieron de nueve ensayos para la supervivencia general y de ocho ensayos para la supervivencia sin progresión. Los 12 ensayos presentaron resultados para la respuesta tumoral. En los 12 ensayos hubo 1023 muertes en 2317 pacientes asignadas al azar. No hubo diferencias en la supervivencia general, con un CRI general de 1,04 (intervalo de confianza (IC) del 95%: 0,93 a 1,16; P = 0,45), y no hubo heterogeneidad significativa. Este resultado fue consistente en los cuatro subgrupos analizados (riesgo de sesgo, línea de quimioterapia, tipo de esquema de quimioterapia e intensidad relativa de la dosis). En concreto, no hubo diferencias en la supervivencia según el tipo de esquema de quimioterapia, o sea, según si la quimioterapia se administró en la progresión de la enfermedad o después de un número establecido de ciclos. En los siete ensayos que informaron sobre la supervivencia sin progresión (tiempo de la primera progresión en el brazo secuencial), 637 mujeres progresaron de las 846 mujeres asignadas al azar. Hubo evidencia débil de un mayor riesgo de progresión en el brazo de combinación (CRI 1,11; IC del 95%: 0,99 a 1,25; P = 0,08) sin heterogeneidad significativa. Este resultado fue consistente en todos los subgrupos. Las tasas generales de respuesta tumoral fueron mayores en el brazo de combinación (RR 1,16; IC del 95%: 1,06 a 1,28; p = 0,001), pero hubo una heterogeneidad significativa para este resultado entre los ensayos. En los siete ensayos que informaron muertes relacionadas con el tratamiento, no hubo diferencias significativas entre los dos brazos, aunque los IC fueron muy amplios debido al escaso número de eventos (RR 1,53; IC del 95%: 0,71 a 3,29; P = 0,28). El riesgo de neutropenia febril fue mayor en el brazo de combinación (RR 1,32; IC del 95%: 1,06 a 1,65; P = 0,01). No hubo diferencias estadísticamente significativas en el riesgo de neutropenia, náuseas y vómitos, ni en las muertes relacionadas con el tratamiento. En general, la calidad de vida no mostró diferencias entre los dos grupos, pero sólo tres ensayos informaron este resultado.
Conclusiones de los autores
Hay evidencia poco convincente de que la quimioterapia secuencial con un solo agente tiene un efecto positivo en la supervivencia sin progresión, mientras que la quimioterapia de combinación tiene una tasa de respuesta más alta y un mayor riesgo de neutropenia febril en el cáncer de mama metastásico. No hay diferencias en el tiempo general de supervivencia entre estas estrategias de tratamiento desde el punto de vista general y en cuanto a los subgrupos analizados. En particular, no hubo diferencias en la supervivencia según el esquema de quimioterapia (administrar la quimioterapia en la progresión de la enfermedad o después que un número establecido de ciclos) ni según la línea de quimioterapia (de primera línea versus segunda o tercera línea). En general, esta revisión apoya las recomendaciones de las guías internacionales de utilizar la monoterapia secuencial a menos que haya una progresión rápida de la enfermedad.
PICO
Resumen en términos sencillos
Quimioterapia combinada (varios fármacos al mismo tiempo) versus secuencial (los mismos fármacos administrados uno después del otro) para el cáncer de mama metastásico
El cáncer de mama metastásico actualmente no es una enfermedad curable, pero las pacientes se pueden tratar de forma efectiva con quimioterapia, tratamiento endocrino y tratamientos dirigidos. La supervivencia promedio es de cerca de dos años, pero algunas mujeres viven muchos más años. Es importante investigar la mejor manera de administrar la quimioterapia para tratar el cáncer de mama metastásico para optimizar la supervivencia y la calidad de vida y para disminuir los efectos secundarios del tratamiento.
Esta revisión investigó si administrar una combinación de fármacos al mismo tiempo fue más efectivo que administrar los mismos fármacos de uno en uno (tratamiento secuencial).
Una búsqueda bibliográfica realizada en octubre de 2013 encontró 12 estudios controlados aleatorizados con 2317 pacientes que se pudieron incluir en el análisis. Las pacientes presentaban cáncer de mama metastásico y, o no habían sido tratadas o habían recibido uno o dos tratamientos después del diagnóstico de cáncer de mama metastásico. Los parámetros de valoración primarios fueron supervivencia general y supervivencia sin progresión (tiempo desde la asignación al azar hasta el momento de progresión de la enfermedad). Secundariamente, se compararon el grado de reducción del tumor en respuesta a la quimioterapia (tasa general de respuesta), la toxicidad y la calidad de vida.
No hubo diferencias en la supervivencia general entre los dos grupos, pero se encontró que cuando los fármacos se administraron de uno en uno hubo un mayor tiempo antes de que los tumores crecieran nuevamente (supervivencia sin progresión más larga). Sin embargo, la quimioterapia combinada provocó que los tumores se redujeran más, aunque no dio lugar a una supervivencia más larga que cuando se utilizó la quimioterapia secuencial. Las tasas de neutropenia febril (infección) fueron mayores en el brazo de combinación, pero no hubo diferencias en las tasas de neutropenia (leucocitos bajos). No hubo diferencias en la calidad de vida entre los dos grupos, pero solamente hubo tres ensayos que proporcionaron esta información. La calidad de vida debe ser incluida como un resultado en los ensayos futuros que aborden esta cuestión. En general, los estudios no informaron de forma consistente la manera en la que se asignaron al azar los pacientes y esta puede ser una fuente de sesgo en los resultados.
En general, esta revisión apoya las recomendaciones de las guías internacionales de utilizar la monoterapia secuencial a menos que haya una progresión rápida de la enfermedad.
Authors' conclusions
Background
Description of the condition
Breast cancer is the most common type of cancer and the second leading cause of cancer deaths in women. In 2002, there were over 1.1 million new cases and approximately 410,000 deaths from breast cancer, worldwide (Ferlay 2004).
If breast cancer becomes metastatic, it is treatable but not curable. The aims of treatment include improving survival and quality of life. There has never been a randomised trial comparing systemic therapy to best supportive care to demonstrate that systemic therapy can improve survival in women with metastatic breast cancer. Despite this, data from single institution series and population‐based registries show that the survival of patients with metastatic breast cancer has improved over time, from approximately 16 months in the early 1990s to beyond 24 months in 2001 (Chia 2007; Giordano 2004), although some women may live for many years (Hayes 1995). This improvement coincides with the availability of new systemic agents (taxanes, aromatase inhibitors, trastuzumab and capecitabine) and a higher proportion of women with metastatic breast cancer receiving systemic therapy (Chia 2007). While longer survival cannot be attributed conclusively to the use of improved systemic therapies it is believed they have contributed. The optimal combination, sequence and timing of systemic agents for metastatic breast cancer remains unresolved. Selection of treatment is based on consideration of the site of recurrence, symptoms, anticipated response to treatment, expected toxicities, quality of life and patient preference. Ultimately most women with metastatic breast cancer will receive chemotherapy because they have hormone receptor negative disease, their disease has become refractory to endocrine therapy, they are symptomatic, or they have rapidly progressive visceral disease (Hortobagyi 1996).
Description of the intervention
Combination chemotherapy can achieve several important objectives that are less probable with single agent chemotherapy. Combination therapy firstly provides increased cell kill within the range of acceptable toxicity for each drug, as long as dosing is not compromised and the tumour is sensitive to each drug; secondly used with an heterogeneous tumour cell population it increases the probability of some cells being responsive compared with a single agent; and thirdly the combination may delay the development of drug resistance if there is rapid cell kill and a reduced cell mass.
The scheduling of multiple drug regimens may influence both the effectiveness and toxicity of the regimen. The Goldie and Coldman model predicts that drug resistant cells may be present even in small tumours (Goldie 1982). They propose alternating non cross‐resistant drug combinations as early as possible as a means of eliminating resistant clones. Norton and Day predicted that the sequential use of drug combinations would outperform alternating cycles because no two combinations were likely to be strictly non‐cross resistant or have equal cell killing capacity (Day 1986; Norton 1991). In the adjuvant setting, a randomised trial observed that four three‐week cycles of doxorubicin followed by eight three‐week cycles of cyclophosphamide methotrexate fluorouracil (CMF) in women with high‐risk primary breast cancer (four or more positive lymph nodes) was more effective than an alternating schedule of doxorubicin and CMF in terms of disease‐free and overall survival (Bonadonna 1995).
A potential limitation of the effectiveness of combination chemotherapy is that dose levels of the component drugs may need to be reduced to limit toxicity. Another limitation of combination treatment is that it may use non‐cross resistant agents rapidly. In contrast, these agents given as sequential monotherapy may allow for more cycles of effective treatment. The use of sequential monotherapy may allow for greater dose intensity and allow for a treatment approach that gets maximum time and benefit from each agent.
Optimal dosing of chemotherapy is challenging because of the different effects on normal and tumour tissues. Most cancer chemotherapeutic agents show a steep dose‐response curve in the linear phase of tumour growth. A reduction in drug dose when the tumour is in this linear phase of the dose‐response curve almost always results in a reduction in the probability of cure before a reduction in antitumour activity is observed. This observation has led cancer clinicians and researchers to conclude that when cure is a reasonable treatment expectation, increasing the dose intensity of treatment will increase the rate and duration of tumour response and improve the survival rate (Hryniuk 1987). However, there are limitations to the effectiveness of dose intensity, as demonstrated by the use of high‐dose chemotherapy. A Cochrane Review (Farquhar 2008) of six randomised trials comparing high‐dose chemotherapy and autograft with conventional chemotherapy for women with metastatic breast cancer demonstrated no statistically significant evidence of benefit in overall survival. Increased dose intensity also comes at a cost of increased toxicity to normal tissues. If palliation is the primary goal of treatment, and anticipated survival is limited, then toxicity and quality of life become important factors when deciding on a treatment regimen.
Combination therapy can also refer to the combination of chemotherapy with a biological agent. This regimen is most commonly used in women with human epidermal growth factor receptor 2‐positive (HER2‐positive) metastatic breast cancer, for example a taxane and trastuzumab or capecitabine and lapatinib. This review focuses only on the combination of chemotherapeutic agents compared to the same agents given as sequential monotherapy.
How the intervention might work
The question of interest is whether patients receiving combination chemotherapy regimens have better health outcomes, including longer survival and less toxicity, than for sequential single agent chemotherapy. Sequential single agent use has evolved to maintain dose intensity while limiting toxicity, and without sacrificing survival. Sequential therapy may refer to the consecutive administration of single agents with each agent introduced after disease progression or it may refer to a planned sequence of single agents given without interruption between the regimens.
Why it is important to do this review
The comparison of combination chemotherapy with the same agents given sequentially as monotherapy is a clinically important question that addresses a common clinical scenario facing medical oncologists treating women with metastatic breast cancer. This is because the role of combination chemotherapy in metastatic breast cancer is still unresolved. Combination chemotherapy is often given to obtain a response in immediately life‐threatening circumstances whereas sequential monotherapy is given for less urgent treatment needs. A Cochrane review showed that combination chemotherapy gave a statistically significant improvement in response rate, time to progression and overall survival but was more toxic compared to single agent chemotherapy (Carrick 2009). Few studies included in this review formally compared women's quality of life between combination and single agent therapy. While the review by Carrick et al tested the benefit of two agents given in combination compared to a single agent it did not address the benefit of two agents given in combination versus the same drugs given as sequential monotherapy. It is not known if it is more beneficial to give a combination of drugs at the same time or to give the same drugs as single agents administered sequentially. Furthermore, regarding sequential single agents, there is still debate about whether single agents should be given until disease progression (when the drugs are changed) or whether a planned sequence of single agents should be given that involves changing the drug before resistance develops and disease progression occurs (see Objectives).
Objectives
To assess the effect of combination chemotherapy compared to the same drugs given sequentially in women with metastatic breast cancer.
We compared the use of single chemotherapy agents given sequentially with regimens using a combination of the same agents for the management of women with metastatic breast cancer to determine their effect on survival. This involved examining two different chemotherapy schemata:
-
schema 1: the combination given until disease progression versus sequential single agents given on disease progression, e.g. cycles of combination AB until disease progression versus cycles of drug A until disease progression followed by cycles of drug B until disease progression;
-
schema 2: the combination given for a set number of cycles versus sequential single agents given as a set number of cycles, e.g. eight cycles of AB versus four cycles of A followed by four cycles of B.
Methods
Criteria for considering studies for this review
Types of studies
Randomised controlled clinical trials that compared a combination of drugs with the same single chemotherapy agents given sequentially for women with metastatic breast cancer.
Types of participants
Women diagnosed with all types of advanced (metastatic) breast cancer. Metastatic breast cancer was defined as stage IV by the TNM classification of malignant tumours. Adults aged 18 years and above were included.
Types of interventions
The intervention was any chemotherapy regimen containing a combination of chemotherapeutic agents given as first‐line or second‐line and third‐line treatment.
The comparison was sequential single agent use of the drugs in the combination chemotherapy regimen given as first‐line or second‐line and third‐line treatment. The sequential single agents may have been administered according to either schema 1 or schema 2 as described under Objectives.
Trials were excluded that included a single agent chemotherapeutic agent alone (drug A alone).
Types of outcome measures
Primary outcomes
-
Overall survival
-
Progression‐free survival (or time to progression)
Secondary outcomes
-
Tumour response rate
-
Quality of life measures
-
Toxicity
Outcome definitions
-
Overall survival (OS): time from date randomised to date of death (any cause).
-
Progression‐free survival (PFS): time from date randomised to date of progression or death from any cause. We used time to progression (TTP) (time from randomisation to date of progression) when PFS was not reported.
-
Overall response rate (RR): the percentage of patients with a complete or partial response. Complete and partial responses were defined according to Response Evaluation Criteria in Solid Tumors (RECIST) criteria (Therasse 2000). That is, a complete response was the disappearance of all target lesions and a partial response was at least a 30% decrease in the sum of the longest diameter of target lesions. The composite response rate was used for sequential single agent chemotherapy. This was calculated as the percentage of patients responding at some point during any of the single agent regimens.
-
Quality of life was defined as an expression of well‐being and measured using a validated scale (e.g. Short Form‐36 (SF‐36), European Organisation for Research and Treatment of Cancer (EORTC), Functional Assessment of Cancer Therapy (FACT)).
-
Toxicities: restricted in our analyses to serious side effects as classified by the World Health Organization (WHO) or National Cancer Institution Criteria (NCIC) grading 3 or more.
Search methods for identification of studies
See: Breast Cancer Group methods used in reviews.
Only trials published in English were included.
Electronic searches
We searched the following databases.
-
The Cochrane Breast Cancer Group (CBCG) Specialised Register (searched on 31 October 2013). Details of search strategies used by the CBCG for the identification of studies and the procedures used to code references are outlined in the CBCG's module at www.mrw.interscience.wiley.com/cochrane/clabout/articles/BREASTCA/frame.html). Trials with the key words 'advanced breast cancer', 'metastatic breast cancer', 'combination chemotherapy', 'sequential single agent chemotherapy' and 'single agent chemotherapy' were extracted and considered for inclusion in the review.
-
MEDLINE (via OvidSP) (searched on 31 October 2013), see Appendix 1.
-
EMBASE (via Embase.com) (searched on 31 October 2013), see Appendix 2.
-
The WHO International Clinical Trials Registry Platform (ICTRP) search portal (http://apps.who.int/trialsearch/Default.aspx) for prospectively registered and ongoing trials (searched on 22 March 2012), see Appendix 3.
-
ClinicalTrials.gov (http://clinicaltrials.gov/ct2/search/advanced) (searched on 22 March 2012), see Appendix 4.
Searching other resources
(a) Bibliography searching
We tried to identify further studies from reference lists of identified relevant trials or reviews. A copy of the full article for each reference reporting a potentially eligible trial was obtained, where possible. Where this was not possible, we attempted to make contact with the authors to provide additional information.
(b) Handsearching of journals
We handsearched the database of abstracts on the treatment of metastatic breast cancer from the annual meetings of the American Society of Clinical Oncology (1987 to 2000; 2003) and San Antonio Breast Cancer Conference (1981 to 2002). A list of journals currently being handsearched by The Cochrane Collaboration is available at the US Cochrane Center Handsearch master list page (http://us.cochrane.org/master-list).
Data collection and analysis
We performed the analysis in accordance with the guidelines published in the Cochrane Handbook for Systematic Reviews of Interventions Version 5.1.0 (Higgins 2011).
Selection of studies
Two authors (RD, MT) independently screened the results of the search. We applied the selection criteria described above to each trial and recorded any reasons for exclusion. A full copy of trials likely to be included in the review were retrieved and read. For unpublished trials, we assessed the available information from conference proceedings. Any discrepancies were resolved by a third author. Only manuscripts published in English were included.
Data extraction and management
Data were extracted from trial publications by two authors (RD, MT). A standardised data extraction form was used to record details of study design, participants, setting, interventions, follow‐up, quality components, efficacy outcomes, toxicity and quality of life. The form is available from the authors upon request. A third author (NW) was available to resolve any discrepancies regarding the extraction of quantitative data and a fourth author (AB) was available to resolve any discrepancies regarding the assessment of the quality of the randomised controlled trials. When a trial was presented in abstract form, we sought further information, as necessary, from the internet, contacting the authors, or checking for the next best available resource or publication.
In the case of published papers, we also contacted the authors for additional information if it was not reported in the paper. For studies with more than one publication, we extracted data from all the publications, however we considered the final or updated version of the trial as the primary reference.
Assessment of risk of bias in included studies
Quality assessment was based on the assessment of a list of procedures related to the design and reporting of trials that are known to minimise the risk of bias. Therefore, trials were assessed by the degree they addressed each of the following items.
Random sequence generation
-
Low risk: if the allocation sequence was generated by a computer or random number table. Drawing of lots, tossing of a coin, shuffling of cards or throwing dice were considered as adequate if a person who was not otherwise involved in the recruitment of participants performed the procedure.
-
Unclear risk: if the trial was described as randomised but the method used for the allocation sequence generation was not described.
-
High risk: if the trial used a system involving dates, names, admittance numbers or alternating allocation.
Allocation concealment
-
Low risk: if the allocation of patients involved a central independent unit; sequentially numbered identical drug containers; or serially numbered, sealed, opaque envelopes.
-
Unclear risk: if the trial was described as randomised but the method used to conceal the allocation was not described.
-
High risk: if the allocation sequence was known to the investigators who assigned participants; the envelopes did not have all three safeguards; or if a non‐random sequence was used.
Blinding of participants, personnel and outcome assessors
-
Low risk: if the trial was described as double‐blind or single‐blind i.e. double‐blind (method described and technique used meant that neither the participant nor the care provider or assessor knew which treatment was given) and single‐blind (participant or care provider or assessor was aware of the treatment given).
-
Unclear risk: if the trial was described as double‐blind or single‐blind but the method of blinding was not described.
-
High risk: if the trial was open label (all parties were aware of the treatment).
Incomplete outcome data addressed
The completeness of outcome data were described for each main outcome. The description included whether attrition and exclusions were reported, the numbers in each intervention group (compared with total randomised participants), reasons for attrition and exclusions and any re‐inclusions in the analysis.
-
Low risk: no missing data; or reasons for missing data were not related to outcome, were balanced across groups with similar reasons or numbers of participants missing, or plausible effect size was not enough to change observed effect.
-
Unclear risk: attrition and exclusions reported but reasons were not included.
-
High risk: incomplete outcome data were not addressed.
Free of selective outcome reporting
We stated how the possibility of selective outcome reporting was examined by the review authors and what was found.
-
Low risk: all pre‐specified outcomes were reported in a pre‐specified way.
-
Unclear risk: expected outcomes were reported but not pre‐specified.
-
High risk: outcomes were not reported as planned or expected; or the outcomes were reported in a way they could not be used in the review, e.g. only direction of effect and significance.
Other sources of bias
Comments were made regarding the following.
-
If the treatment groups were similar at baseline regarding the most important prognostic factors.
-
If the trial was stopped early using a data‐dependent process (including formal stopping rule).
-
If analysis was by intention to treat (or enough data were provided to replicate such an analysis i.e. number of withdrawals, dropouts and losses to follow‐up in each group).
We contacted authors of the primary trial reports, when necessary, to clarify data and provide missing information. We entered the characteristics and outcomes of the included trials and details of the excluded trials into our database.
Each selected study was assessed as low, unclear or high risk of bias based on assessments of the domains described above (random sequence generation, allocation concealment, blinding, incomplete data addressed, free of selective outcome reporting and other sources of bias). Since the selected studies had different levels of risk of bias (with most being of high or unclear risk of bias), we conducted a primary analysis including all trials and then performed a sensitivity analysis to show how the conclusions were affected if studies of unclear or high risk of bias were excluded.
Measures of treatment effect
We extracted the hazard ratio (HR) and associated variances for overall survival and progression‐free survival (or time to progression) directly from the trial publications.
We obtained a pooled HR through the generic inverse variance approach, from the log HR and the standard error of the log HR, using fixed‐effect and random‐effects models along with assessments of heterogeneity (Deeks 2006). The pooled HR represented the overall risk of an event on combination chemotherapy regimens compared to single agent sequential chemotherapy.
We reported ratios of treatment effects for time‐to‐event outcomes so that HRs less than 1.0 favoured combination chemotherapy regimens and values greater than 1.0 favoured single agent sequential chemotherapy regimens. The forest plots for overall survival and progression‐free survival presented the hazard ratio (HR) and 95% confidence interval (CI).
We analysed an indicator of response as a dichotomous variable (complete or partial response versus stable disease or no response) and derived a pooled relative risk (RR). We reported responses on an intention‐to‐treat basis. If the majority of trials only reported results based on assessable (not randomised) patients, we used assessable responses. We reported ratios of treatment effects for response so that risk ratios (RRs) more than 1.0 favoured combination chemotherapy regimens and values less than 1.0 favoured single agent sequential chemotherapy regimens.
Unit of analysis issues
Four trials were three‐arm studies (Cresta 2004; Koroleva 2001; Sledge 2003Soto 2006). Two out of three of the arms in each of these trials were combined. For Cresta 2004, there was one combination arm of doxorubicin and docetaxel, a single agent arm where these two drugs were given on an alternating schedule, and another single agent arm where the drugs were given sequentially. The two single agent arms were combined in this trial. In Koroleva 2001 there were two combination arms using doxorubicin and docetaxel but at different doses, and one sequential single agent arm. The two combination arms were combined in this trial. In Sledge 2003 there was one combination arm that included doxorubicin and paclitaxel, one single agent arm that started with doxorubicin, and another single agent arm that began treatment with paclitaxel. The two single agent arms were combined in this arm. In Soto 2006 there was one sequential single agent arm that included capecitabine followed by a taxane (either docetaxel or paclitaxel), a combination arm that included capecitabine and docetaxel, and another combination arm that included capecitabine and paclitaxel. The two combination arms were combined in this trial.
Dealing with missing data
If data were missing, we made multiple attempts to contact the original investigators. This was successful in the case of four studies (Alba 2004Fountzilas 2001Park 2010; Sledge 2003). When we were unable to obtain data, two authors extracted data from published Kaplan‐Meier curves (Tierney 2007). If there was a discrepancy between authors, we took an average of the two values at each time point and used the averaged values to generate a new HR. To allow for premature follow‐up, we adjusted the numbers at risk based upon estimated minimum and maximum follow‐up times. If these were not reported we estimated minimum follow‐up using the estimated time taken to complete treatment. We estimated maximum follow‐up using the last event reported in the relevant time‐to‐event curve. We have presented these follow‐up estimates in the Characteristics of included studies table under 'Notes'.
Assessment of heterogeneity
We included all outcomes available from the individual studies in the meta‐analysis with heterogeneity reported by the Q (Chi2) and the I2 statistics. Statistical significance of the Q statistic was judged as P < 0.10 because of the low statistical power of the test. The I2 statistic indicates the per cent variability due to between‐study (or inter‐study) variability, as opposed to within‐study (or intra‐study) variability. An I2 statistic greater than 50% was considered large (Higgins 2002), however this was considered alongside the magnitude and direction of effects and the P value from the Chi2 test for heterogeneity.
Assessment of reporting biases
Reporting bias was assessed using the Cochrane Collaboration's assessment tool (Table 8.6a) in the Cochrane Handbook for Systematic Reviews of Interventions (Higgins 2011).
Data synthesis
We used a fixed‐effect model for meta‐analysis. HRs and RRs were calculated with a generic inverse variance fixed‐effect model analysis. Response rates were analysed as dichotomous variables and we derived a pooled relative risk. We used the Mantel‐Haenszel method with zero‐cell corrections for the analysis of treatment‐related deaths because this was a rare event, however we used the inverse variance method to pool the RRs for the other toxicity outcomes (neutropenia, febrile neutropenia and nausea and vomiting) because these outcomes are not rare events. We also analysed all toxicity outcomes using conditional logistic regression.
Subgroup analysis and investigation of heterogeneity
As outlined in the protocol, we pre‐specified three subgroups. We extracted data on these subgroups from all trial publications, where available.
-
Schedule of single agent: schema 1 versus schema 2 (see Objectives).
-
Dose of chemotherapy: trials where the dose used in the combination regimen was the same as the doses of the single agents compared to trials where the doses were not equivalent in the two arms of the study.
-
Line of chemotherapy for metastatic breast cancer (first‐line versus second‐line or third‐line chemotherapy).
Sensitivity analysis
A sensitivity analysis comparing the outcomes using studies at low risk of bias with outcomes of studies of unclear or high risk of bias was performed. Trials were assessed for quality by the degree to which they addressed the following seven domains: random sequence generation, allocation concealment, blinding of participants and personnel, blinding of outcome assessors, incomplete outcome data, selective outcome reporting, and if the analysis was by intention to treat. Each selected study was assessed as low, unclear or high risk of bias based on assessing each of these domains. If the majority of the seven categories (that is four or more out of seven) were considered at unclear or high risk of bias the trial was considered to be at risk of bias.
Results
Description of studies
See: Characteristics of included studies and Characteristics of excluded studies.
Results of the search
We searched the Cochrane Breast Cancer Group Specialised Register, EMBASE, MEDLINE, the WHO ICTRP and ClinicalTrials.gov. From these databases 2299 were coded as references to studies of advanced breast cancer and chemotherapy (Figure 1). Of these 160 were duplicate studies, leaving 2139 remaining studies. Of these 18 were trials that compared combination chemotherapy with drugs given as sequential single agents. Two were excluded because the drugs given in the sequential arm were different from those in the combination arm. Two studies (Campone 2013; Zhang 2013) were categorised as 'study awaiting classification' because the trials were completed but with insufficient data for inclusion at present. The results from these two small trials will be included in an updated version of this review. The remaining 14 references reported the results of 14 randomised trials. One report (Chlebowski 1989) combined the results from two separate but similar trials, both of which were reported earlier (Chlebowski 1979; Smalley 1976). Both of these publications were therefore excluded from the review. The 12 eligible trials reported on nine treatment comparisons, summarised in Table 1. The details of the chemotherapy protocols used are detailed in Table 2. The trials included in the forest plots are labelled by primary author and date of publication. Nine of the trials were published in full while three were only available in abstract form.

Results of search strategy applied 31 October 2013 for combination versus sequential single agent chemotherapy for metastatic breast cancer.
| Combination | Sequential | Number of trials |
| doxorubicin + docetaxel | doxorubicin → docetaxel | Cresta 2004(included alternating regimen) Koroleva 2001 (included 2 combination arms with different doses) |
| 5‐fluorouracil + cyclophosphamide + vincristine | 5‐fluorouracil → cyclophosphamide → vincristine | |
| capecitabine + docetaxel or paclitaxel | capecitabine → docetaxel or paclitaxel | |
| 5‐fluorouracil + cyclophosphamide + prednisone + thyroxine or vincristine | 5‐fluorouracil → cyclophosphamide → thyroxine or vincristine → prednisone | |
| epirubicin + paclitaxel | epirubicin → paclitaxel | |
| epirubicin + paclitaxel | dose dense epirubicin→ paclitaxel | |
| gemcitabine + vinorelbine | gemcitabine → vinorelbine | |
| doxorubicin + paclitaxel | doxorubicin → paclitaxel or paclitaxel → doxorubicin | |
| docetaxel + gemcitabine | docetaxel → gemcitabine |
| Trial name | Arm I | Arm II |
| Alba 2004 | Arm I: AT= Doxorubicin 50 mg/m2 and docetaxel 75 mg/m2 both on day 1. Cycles repeated every 21 days for 6 cycles. If prior anthracyclines: given 3 cycles of AT at above doses followed by 3 cycles of docetaxel 100 mg/m2 | Arm II: A→T= Doxorubicin 75 mg/m2 intravenously day 1 for 3 cycles followed by docetaxel 100 mg/m2 intravenously day 1 for 3 cycles. If prior anthracyclines given 2 cycles of doxorubicin 75 mg/m2 followed by 4 cycles of docetaxel 100 mg/m2. Cycles repeated every 21 days |
| Baker 1974 | Arm I: FCV= 5‐fluorouracil 7.5 mg/kg intravenously days 1‐5 plus cyclophosphamide 4 mg/kg intravenously days 1 to 5 plus vincristine 0.015 mg/kg intravenously days 1 and 8. Cycles repeated every 28 days until disease progression | Arm II: F→C→V= 5‐fluorouracil 15 mg/kg intravenously days 1 to 5 every 28 days until disease progression then cyclophosphamide 8 mg/kg intravenously days 1 to 5 every 28 days until disease progression then vincristine 0.02 mg/kg intravenously weekly until disease progression |
| Beslija 2006 | Arm I: XT= Capecitabine (Xeloda, X) 1250 mg/m2 twice daily orally from days 1 to 14 and docetaxel (Taxotere, T) 75 mg/m2 intravenously day 1. Cycle repeated every 21 days until disease progression | Arm II: T→X= Docetaxel 100 mg/m2 intravenously day 1 until disease progression then capecitabine 1250 mg/m2 twice daily orally from days 1 to 14 until disease progression. Cycles repeated every 21 days |
| Chlebowski 1989 | WCSG Arm I: CMFTP= Cyclophosphamide 2 mg/kg/day orally, plus 5‐fluorouracil 15 mg/kg every 2 weeks intravenously from day 1, plus methotrexate 30 mg/m2 every 2 weeks intravenously beginning on day 8, plus prednisone 0.5 mg/kg/day orally, plus triiodothyronine 0.005 mg daily. Cycle repeated until disease progression. SECSG Arm I: Cyclophosphamide 400 mg/m2 intravenously day 1 every 28 days, plus 5‐fluorouracil 400 mg/m2 intravenously day 1 and day 8 every 28 days, plus methotrexate 30 mg/m2 intravenously day 1 and day 8 every 28 days, plus vincristine 1 mg/m2 intravenously day 1 and day 8 every 28 days, plus prednisone 80mg orally daily from days 1 to 7 every 28 days. Cycle repeated until disease progression. or Cyclophosphamide 100 mg orally daily, plus 5‐fluorouracil 400 mg/m2 intravenously weekly, plus methotrexate 20 mg/m2 orally weekly, plus vincristine 1 mg/m2 intravenously weekly, plus prednisone 45 mg orally daily for 14 days, then 30 mg daily for 14 days then 15 mg daily for 28 days. Cycle repeated until disease progression | WCSG Arm II: F→C→TP→M= 5‐fluorouracil 15 mg/kg weekly intravenously from day 1 for a minimum of 4 weeks until disease progression then cyclophosphamide 2 mg/kg/day orally for a minimum of 4 weeks until disease progression then triiodothyronine 0.005 mg daily plus prednisone 0.5 mg/kg/day for a minimum of 6 weeks until disease progression then methotrexate 30 mg/m2 intravenously weekly for a minimum of 4 weeks SECSG Arm II: F→MC→V→P= 5‐fluorouracil 600 mg/m2 intravenously weekly until disease progression then methotrexate 20 mg/m2 orally biweekly until disease progression then cyclophosphamide 100 mg/m2 orally daily until disease progression then vincristine 1 mg/m2 intravenously weekly until disease progression then prednisone 45 mg orally daily for 14 days then 30 mg daily for 14 days then 15 mg daily for 30 days |
| Conte 2004 | Arm I: EP= Epirubicin 90 mg/m2 plus paclitaxel 200 mg/m2 intravenously day 1. Cycles repeated every 21 days for 8 cycles | Arm II: E→P= Epirubicin 120 mg/m2 intravenously day 1 for 4 cycles then paclitaxel 250 mg/m2 intravenously day 1 for 4 cycles. Cycles repeated every 21 days |
| Cresta 2003 | Arm I: AT= Doxorubicin 60 mg/m2 plus docetaxel 60 mg/m2 intravenously day. Cycles repeated every 21 days for 8 cycles | Arm II: A→T (sequential regimen)= Doxorubicin 75 mg/m2 intravenously on day 1 for 4 cycles followed by docetaxel 75 mg/m2 intravenously on day 1 for 4 cycles. Cycles repeated every 21 days. Maximum 8 cycles. Arm III: T then A (alternating regimen)= Docetaxel 100 mg/m2 intravenously on day 1 for 4 cycles alternating with doxorubicin 75 mg/m2 intravenously on day 1 for 4 cycles. Cycles repeated every 21 days. Maximum 8 cycles |
| Fountzilas 2001 | Arm I: P= Epirubicin 80 mg/m2 plus paclitaxel 175 mg/m2 intravenously day 1. Cycles repeated every 21 days for 6 cycles | Arm II: E→P Epirubicin 110 mg/m2 intravenously day 1 for 4 cycles followed by paclitaxel 225 mg/m2 intravenously day 1 for 4 cycles. Cycles repeated every 14 days with G‐CSF support (dose dense regimen) |
| Koroleva 2001 | Arm I: AT= Doxorubicin 50 mg/m2 plus docetaxel 75 mg/m2 intravenously day 1. Cycles repeated every 21 days for 8 cycles | Arm II: T→A= Docetaxel 100 mg/m2 intravenously day 1 for 4 cycles followed by doxorubicin 75 mg/m2 intravenously day 1 for 4 cycles. Cycles repeated every 21 days. Arm III: AT= Doxorubicin 60 mg/m2 plus docetaxel 60 mg/m2 intravenously day 1. Cycles repeated every 21 days for 8 cycles |
| Park 2010 | Arm I: GV= Gemcitabine 1,000 mg/m2 plus vinorelbine 25 mg/m2 intravenously days 1 and 8. Cycles repeated every 21 days until disease progression | Arm II: G→V= Gemcitabine 1,200 mg/m2 intravenously on days 1 and 8 until disease progression then vinorelbine 30 mg/m2 intravenously days 1 and 8 until disease progression. Cycles repeated every 21 days |
| Sledge 2003 | Arm I: AT= Doxorubicin 50 mg/m2 plus paclitaxel 150 mg/m2 over 24 hours intravenously day 1. Cycles repeated every 21 days until disease progression | Arm II: A (→P)= Doxorubicin 60 mg/m2 intravenously day 1 for a maximum of 8 cycles. If disease progressed crossed over to paclitaxel 175 mg/m2 intravenously over 24 hours on day 1. Cycles repeated every 21 days. Arm III: P (→A)= Paclitaxel 175 mg/m2 intravenously over 24 hours on day 1. If disease progressed crossed over to doxorubicin 60 mg/m2 intravenously day 1. Cycles repeated every 21 days |
| Soto 2006 | Arm I: XT= Capecitabine 825 mg/m2 twice daily orally from days 1 to 14 plus docetaxel 75 mg/m2 intravenously on day 1 until disease progression. Cycles repeated every 21 days | Arm II: X→T (docetaxel or paclitaxel)= Capecitabine 1250 mg/m2 twice daily orally days 1 to 14 until disease progression then docetaxel 100 mg/m2 or paclitaxel 175 mg/m2 intravenously on day 1 until disease progression. Cycles repeated every 21 days. Arm III: XP= Capecitabine 825 mg/m2 twice daily orally from days 1 to 14 plus paclitaxel 175 mg/m2 intravenously on day 1 until disease progression. Cycles repeated every 21 days |
| Tomova 2010 | Arm I: TG= Docetaxel 75 mg/m2 intravenously on day 1 plus gemcitabine 1,000 mg/m2 intravenously on days 1 and 8. Cycles repeated every 21 days for 8 cycles | Arm II: T→G= Docetaxel 100 mg/m2 intravenously on day 1 for 4 cycles followed by gemcitabine 1,250 mg/m2 intravenously on days 1 and 1 for 4 cycles. Cycles repeated every 21 days |
Of the 12 eligible trials, only one allowed crossover from one arm to the other. This occurred in Sledge 2003 between the two single agent arms but did not include the combination arm. At the time of progression, patients in the doxorubicin arm crossed over to paclitaxel, and those in the paclitaxel arm crossed over to doxorubicin. These two single agent arms were therefore equivalent to two sequential single agent arms and were analysed as such in this review.
Included studies
See: Results of the search.
Excluded studies
See: Results of the search.
Risk of bias in included studies
See: 'Risk of bias' graph (Figure 2).

Risk of bias graph: review authors' judgements about each risk of bias item presented as percentages across all included studies.
Allocation
Sequence generation was clearly reported in three trials (Baker 1974; Conte 2004Fountzilas 2001) and was unclear in the remaining nine trials (Alba 2004; Beslija 2006Chlebowski 1989Cresta 2004Koroleva 2001Park 2010Sledge 2003Soto 2006Tomova 2010). Two trials had adequate allocation concealment (Chlebowski 1989Conte 2004). In nine trials allocation concealment was unclear (Alba 2004Beslija 2006Cresta 2004Fountzilas 2001Koroleva 2001Park 2010Sledge 2003Soto 2006Tomova 2010). However, in all of these trials there were no large differences in baseline characteristics between the two treatment arms. In one trial (Baker 1974) there was no allocation concealment: "all patients treated with chemotherapy during this time period were entered onto the study, despite the fact that the physician might have known which branch the patient would be entered into prior to the initiation of therapy...this...probably accounted for the difference in size of the two divisions".
Blinding
In all but one trial it was unclear if there was blinding of participants or personnel. In the one trial where it was clear, there was not blinding of study personnel (Baker 1974). In two trials there was blinding of outcome assessors (Fountzilas 2001Park 2010) but in the remaining 10 trials it was unclear if there was blinding of the outcome assessors.
Incomplete outcome data
Completeness of outcome data was adequate in 10 trials. The remaining two trials (Koroleva 2001Soto 2006) reported attrition rates or exclusions but reasons were not provided so complete reporting of outcomes was judged as unclear.
Selective reporting
For eight trials, completeness of all outcome data was adequate for use in the review. Outcome data were either directly extracted from the paper (Beslija 2006Park 2010), provided after contacting the authors (Alba 2004Fountzilas 2001Sledge 2003) or calculated from Kaplan‐Meier curves in the case of HRs (Baker 1974Conte 2004Tomova 2010). In one trial the majority of outcomes had adequate completeness although there was one outcome which was unclear, progression‐free survival (Chlebowski 1989). The remaining three trials had inadequate completeness of outcome data for both overall and progression‐free survival (Cresta 2004Koroleva 2001Soto 2006). Only the direction of effect and P value were provided in these trials. All trials reported the response rate and toxicity. Only three trials reported quality of life (Conte 2004Park 2010Sledge 2003).
Three trials in the review were in the form of abstracts (Beslija 2006Koroleva 2001Soto 2006) so in the background section they hypothesised that combination chemotherapy prolongs overall survival, progression‐free survival and response rate, which implied that these were pre‐specified outcomes. Toxicity was not usually pre‐specified. The abstracts did not describe how the outcomes were reported and this was not explained in the methods section. However, reporting of outcomes was adequate in Beslija 2006 but not in Koroleva 2001 or Soto 2006.
Other potential sources of bias
The main other potential source of bias was that in seven trials the analysis was not by intention to treat (Baker 1974Conte 2004Koroleva 2001Park 2010, Sledge 2003Soto 2006Tomova 2010). To overcome this problem, when we extracted the data from these trials we analysed the results by intention to treat.
The review has been amended (21 November 2014) to highlight an important source of bias which was not sufficiently acknowledged in the original review. This source of bias is the comparison of progression‐free survival in the combination arm to progression‐free survival in the sequential single agent arm. This problem arises for the trials that use Schema 1 (where drugs changed on disease progression). The issue does not arise for drugs that use Schema 2 (where the drugs are changed after a set number of cycles before disease progression has occurred). There are four trials that use Schema 1 in the review: Baker 1974, Beslija 2006, Park 2010 and Sledge 2003. Among the schema 1 trials, Baker 1974 and Beslija 2006 reported time to first progression in the sequential single agent arm compared to time to first progression in the combination arm. However, the other two Schema 1 trials, Park 2010 and Sledge 2003, measured time to progression from the date of randomization to the date of progression or death after second progression for the single agents but after first progression for the combination arm. This biases progression‐free survival in favour of sequential therapy. Our original progression‐free survival results (now labelled as Analysis 2.2, Analysis 9.2, Analysis 16.2, Analysis 23.2, Analysis 30.2) are heavily weighted to the Sledge 2003 results because it is the largest trial. This means that in our original progression‐free survival analysis it is likely that we have over‐estimated the benefit of sequential single agent chemotherapy on progression‐free survival. In this amendment, we have included an updated progression‐free survival analysis that compares time to progression in the combination arm to time to first progression in the sequential arm. For this analysis Park 2010 was excluded (data were not available) and new data were included for Sledge 2003 after contacting the authors for this new information (Analysis 2.1, Analysis 9.1, Analysis 16.1, Analysis 23.1, Analysis 30.1). We have retained the original progression‐free survival analysis for comparison.
Effects of interventions
The ratios of treatment effects for time‐to‐event outcomes were reported so that hazard ratios (HRs) less than 1.0 favoured the combination arm and HRs more than 1.0 favoured the sequential arm. We have reported ratios of treatment effects for response so that a risk ratio (RR) of more than 1.0 favoured the combination arm.
Of the 12 trials, the primary outcome in most trials (eight out of 12) was the objective response rate (Beslija 2006Conte 2004; Cresta 2004Fountzilas 2001Koroleva 2001Park 2010Sledge 2003; Soto 2006). In two trials the primary outcome was overall survival (Baker 1974Chlebowski 1989); in one trial the primary outcome was time to progression (Tomova 2010); and in one trial the primary outcome was toxicity (Alba 2004). Most trials had a superiority design, although one trial used a noninferiority design (Conte 2004). See: the Characteristics of included studies, Table 1 on treatment comparisons used in the included studies, and Table 2 detailing the chemotherapy regimens used in the included studies.
The results for the pooled data, from all trials that had extractable data, are detailed first followed by four subgroup analyses.
All trials
Overall survival ‐ all trials
There are 12 trials in this review, which included nine treatment comparisons. A total of 2317 women were randomised. Time‐to‐event data were extractable for overall survival from nine trials, which included nine treatment comparisons. This represented 77% of all patients randomised (1786/2317). There were 1023 deaths in 2317 women randomised. The overall HR for overall survival was 1.04 (95% CI 0.93 to 1.16; P = 0.45) (Figure 3) and there was no statistically significant heterogeneity (I2 = 24%; P = 0.23).

Forest plot of comparison: 1 Overall survival, outcome: 1.1 Overall survival (all trials).
Progression‐free survival ‐ all trials
In the amended analysis (comparing time to progression in the combination arm to time to first progression in the sequential single agent arm), progression‐free survival data were available from seven trials, which included seven treatment comparisons. Park 2010 was excluded because these data were not available. There were 637 women who progressed out of 846 randomised. There was weak evidence that combination chemotherapy had a higher risk of progression that sequential single agent chemotherapy with an overall HR of 1.11 (95% CI 0.99 to 1.25; P = 0.08) and there was no statistically significant heterogeneity (I2 = 21%; P = 0.27) (Analysis 2.1; Figure 4).

Forest plot of comparison: 2 Progression‐free survival, outcome: 2.1 Progression‐free survival (amended analysis).
In the original analysis, progression‐free survival data were available from eight trials, which included eight treatment comparisons. This represented 68% of all patients randomised (1564/2317). There were 678 women who progressed out of 886 randomised. Combination chemotherapy had a higher risk of progression than sequential single agent chemotherapy with an overall HR of 1.16 (95% CI 1.03 to 1.31; P = 0.01; Analysis 2.2) and there was no statistically significant heterogeneity (I2 = 26%; P = 0.22).
Overall tumour response rate ‐ all trials
Tumour response rates for assessable patients were available for all 12 trials in the review. This represented 92% of all patients randomised (2140/2317). Combination chemotherapy was associated with a higher overall tumour response rate compared to sequential single agent chemotherapy with an RR of 1.16 (95% CI 1.06 to 1.28; P = 0.001) (Figure 5). There was statistically significant heterogeneity for this outcome across the trials (I2 = 72%; P < 0.0001).

Forest plot of comparison: 3 Overall response, outcome: 3.1 Overall response (all trials).
Toxicity ‐ all trials
Treatment‐related deaths were reported in seven trials. This represented 39% of all patients randomised (902/2317). There were 24 treatment‐related deaths of which 16 occurred in the combination arm and eight occurred in the sequential arm. This was not statistically significant (RR 1.53; 95% CI 0.71 to 3.29; P = 0.28) (Analysis 4.1). There was no statistically significant heterogeneity (I2 = 29%; P = 0.22).
All 12 trials provided extractable data on grade III or IV toxicity. Of these, 12 reported on neutropenia or leukopenia (2351 patients), nine on febrile neutropenia (2328 patients), and eight on nausea and vomiting (1719 patients). Regarding neutropenia and leukopenia, data on grade III or IV leukopenia was included if neutropenia was not reported (Baker 1974Chlebowski 1989Tomova 2010). In trials where the toxicity was described as 'severe' we assumed they assessed toxicity similarly to the trials with toxicity grade III or IV using the WHO criteria (Baker 1974Chlebowski 1989).
There was no difference in the risk of neutropenia or leukopenia (RR 0.94; 95% CI 0.87 to 1.02; P = 0.12) (Analysis 5.1) but there was significant heterogeneity between trials (I2 = 78%; P <0.00001). However, combination chemotherapy was associated with an increased likelihood of febrile neutropenia (RR 1.32; 95% CI 1.06 to 1.65; P = 0.01) (Analysis 6.1). There was no significant heterogeneity (I2 = 42%; P = 0.09). There was no difference in the risk of nausea and vomiting (RR 0.88; 95% CI 0.57 to 1.34; P = 0.55) (Analysis 7.1) and there was no significant heterogeneity (I2 = 0%; P = 0.58).
When the toxicity outcomes were analysed using conditional logistic regression the results were similar to those provided by the Mantel‐Haenszel method for treatment‐related deaths and the inverse variance method for the other toxicity measures (neutropenia, febrile neutropenia, and nausea and vomiting).
Quality of life ‐ all trials
Quality of life data were reported in three trials. This represented 25% of all patients randomised (589/2317). Two of these trials used the European Organisation for Research and Treatment of Cancer (EORTC) Quality of Life Questionnaire (QLQ C‐30) (Conte 2004Park 2010) and one used FACT‐B (Sledge 2003) to measure quality of life. In Conte 2004 emotional functioning was better in the combination arm (score differences 3.53; 95% CI ‐6.99 to ‐0.06). There was no significant difference for the seven symptom scales or for financial impact. In Park 2010 there was no difference in baseline subscale scores between the two arms, and no significant difference in symptom scale scores during treatment. However, the combination arm had statistically better scores in role functioning, social functioning, and global health compared to the sequential arm (P < 0.05). In Sledge 2003 there was no statistically significant difference between treatment arms on any quality of life subscales.
Subgroup analyses
Low versus high or unclear risk of bias
We conducted a pre‐specified subgroup analysis to investigate the treatment effect in trials with a low risk of bias compared to the trials considered at high or unclear risk of bias. In total, there were two trials considered low risk of bias and 10 trials with a high or unclear risk of bias.
Overall survival
Data for overall survival were available for both trials with a low risk of bias. In the trials with a low risk of bias, there was no difference in overall survival between the combination and sequential arms, with a HR of 1.21 (95% CI 0.93 to 1.58; P = 0.16) (Analysis 8.1), and no significant heterogeneity (I2 = 0%; P = 0.93).
Data for overall survival was available for seven out of the 10 trials with a high or unclear risk of bias. In these trials there was no difference in overall survival, with a HR of 1.01 (95% CI 0.90 to 1.14; P = 0.85) (Analysis 8.1), and no significant heterogeneity (I2 = 34%; P = 0.17).
A test for interaction between the two groups for overall survival revealed no significant interaction (P = 0.23).
Progression‐free survival
In the amended analysis, data for progression‐free survival were available for both trials with a low risk of bias. In the trials with a low risk of bias there was no difference in progression‐free survival, with a HR of 1.15 (95% CI 0.94 to 1.41; P = 0.17) (Analysis 9.1), and no significant heterogeneity (I2 = 0%; P = 0.54). Data for progression‐free survival was available for five of the 10 trials with a high or unclear risk of bias. In these trials there was no difference in progression‐free survival with a HR of 1.09 (95% CI 0.94 to 1.26, P = 0.26) (Analysis 9.1) and no significant heterogeneity (I2 = 43%; P = 0.13).
A test for interaction between the two groups for progression‐free survival revealed no significant interaction (P = 0.66).
In the original analysis, the data for progression‐free survival in trials with a low risk of bias were the same as the amended analysis (refer to Analysis 9.2). Data for progression‐free survival was available for six of the 10 trials with a high or unclear risk of bias. In these trials there was a higher risk of progression in the combination arm compared to the sequential arm with a HR of 1.17 (95% CI 1.01 to 1.35, P = 0.03) (Analysis 9.2) and no significant heterogeneity (I2 = 45%; P = 0.11).
A test for interaction between the two groups for progression‐free survival revealed no significant interaction (P = 0.93).
Overall response
Data for overall response rate were available for both trials with a low risk of bias. There was no difference in overall tumour response, with a HR of 0.91 (95% CI 0.76 to 1.10; P = 0.35) (Analysis 10.1), and no significant heterogeneity (I2 = 49%; P = 0.16).
Tumour response data were available for all 10 trials with a high or unclear risk of bias. There was a higher overall tumour response rate in these trials for the combination arm compared to the sequential arm with a HR of 1.26 (95% CI 1.13 to 1.39; P < 0.0001) (Analysis 10.1) but there was significant heterogeneity (I2 = 70%; P = 0.0005).
A test for interaction between the two group for overall tumour response revealed a significant interaction (P = 0.004).
Treatment‐related deaths
Data were available for one out of the two trials with a low risk of bias. In this trial with a low risk of bias (Conte 2004) there were three deaths in the combination arm compared to one death in the sequential arm with no difference in treatment‐related deaths (HR 2.60; 95% CI 0.28 to 24.60; P = 0.40) (Analysis 11.1).
Data were available for six out of the 10 trials with a high or unclear risk of bias. In these trials there were 13 deaths in the combination arm and seven deaths in the sequential arm. There was no statistically significant difference, with a HR of 1.41 (95% CI 0.62 to 3.20; P = 0.42) (Analysis 11.1), and no significant heterogeneity (I2 = 42%; P = 0.14).
A test for interaction between the two groups for treatment‐related deaths revealed no significant interaction (P = 0.61).
Neutropenia
Data were available for both trials with a low risk of bias. In these two trials with a low risk of bias there was a decreased risk of neutropenia in the sequential arm compared to the combination arm (RR 0.62; 95% CI 0.50 to 0.76; P < 0.00001) (Analysis 12.1) however there was significant heterogeneity (I2 = 91%; P = 0.0006).
Data were available for all 10 trials with a high or unclear risk of bias. In these trials there was no difference in the rates of neutropenia (RR 1.00; 95% CI 0.92 to 1.09; P = 0.98) (Analysis 12.1) however there was significant heterogeneity (I2 = 59%; P = 0.009).
A test for interaction between the two groups for neutropenia revealed a significant interaction (P < 0.0001).
Febrile neutropenia
Data were available for both of the trials with a low risk of bias. In these two trials with a low risk of bias there was no significant difference in the rates of febrile neutropenia (RR 1.60; 95% CI 0.72 to 3.57; P = 0.25) (Analysis 13.1) and there was no significant heterogeneity (I2 = 0%; P = 0.55).
Data were available for seven out of the 10 trials with a high or unclear risk of bias. In these trials there was an increased risk of febrile neutropenia in the combination arm compared to the sequential arm (RR 1.30; 95% CI 1.03 to 1.64; P = 0.03) (Analysis 13.1) but with significant heterogeneity (I2 = 54%; P = 0.04).
A test for interaction between the two groups for febrile neutropenia revealed no significant interaction (P = 0.63).
Nausea and vomiting
Data were available for one out of the two trials with a low risk of bias. This trial showed no difference in the rates of nausea and vomiting (RR 1.03; 95% CI 0.21 to 4.99; P = 0.97) (Analysis 14.1).
Data were available for seven out of the 10 trials with a high or unclear risk of bias. In these trials there was no difference in the rates of nausea and vomiting (RR 0.87; 95% CI 0.56 to 1.35; P = 0.52) (Analysis 14.1) and no significant heterogeneity (I2 = 0%; P = 0.46).
A test for interaction between the two groups for nausea and vomiting revealed no significant interaction (P = 0.83).
First‐line versus second‐line or third‐line chemotherapy
We conducted a pre‐specified subgroup analysis to investigate the treatment effect in trials of first‐line chemotherapy compared to trials of second‐line or third‐line chemotherapy. In total, there were nine trials with first‐line chemotherapy and three trials for second‐line or third‐line chemotherapy.
Overall survival
Data were available for seven out of nine trials with first‐line chemotherapy. In the trials of first‐line chemotherapy there was no difference in overall survival between the combination and sequential arms, with a HR of 1.04 (95% CI 0.93 to 1.18; P = 0.47) (Analysis 15.1), and no significant heterogeneity (I2 = 34%; P = 0.17).
Data were available for two out of the three trials of second‐ or third‐line chemotherapy. In these trials there was no difference in overall survival, with a HR of 1.03 (95% CI 0.76 to 1.40; P = 0.84) (Analysis 15.1), and no significant heterogeneity (I2 = 28%; P = 0.24).
A test for interaction between the two groups for overall survival revealed no significant interaction (P = 0.94).
Progression‐free survival
In the amended analysis, data were available for six out of nine trials of first‐line chemotherapy. In the trials of first‐line chemotherapy there was weak evidence of a higher risk of progression in the combination arm compared to the sequential arm with a HR of 1.11 (95% CI 0.99 to 1.26; P = 0.08) (Analysis 16.1) and no significant heterogeneity (I2 = 33%; P = 0.19). Data were available for one out of the three trials of second‐ or third‐line chemotherapy. In this trial, there was no difference in progression‐free survival, with a HR of 0.85 (95% CI 0.24 to 2.99; P = 0.80) (Analysis 16.1).
A test for interaction between the two groups for progression‐free survival revealed no significant interaction (P = 0.67).
In the original analysis, data were available for six out of nine trials of first‐line chemotherapy. In the trials of first‐line chemotherapy there was a higher risk of progression in the combination arm compared to the sequential arm with a HR of 1.16 (95% CI 1.02 to 1.31; P = 0.02) (Analysis 16.2) and no significant heterogeneity (I2 = 44%; P = 0.11). Data were available for two out of the three trials of second‐ or third‐line chemotherapy. In these trials there was no difference in progression‐free survival, with a HR of 1.25 (95% CI 0.80 to 1.95; P = 0.33) (Analysis 16.2), and no significant heterogeneity (I2 = 0%; P = 0.52).
A test for interaction between the two groups for progression‐free survival revealed no significant interaction (P = 0.74).
Overall response
Data were available for all nine trials investigating first‐line chemotherapy. In these trials of first‐line chemotherapy there was evidence of a difference in overall tumour response rate in the combination arm compared to the sequential arm, with a HR 1.10 (95% CI 1.00 to 1.22; P = 0.05) (Analysis 17.1), but there was significant heterogeneity (I2 = 74%; P = 0.0001).
Data were available for all three trials of second‐ or third‐line chemotherapy. In these trials there was a higher overall tumour response rate in the combination compared to the sequential arm with a HR of 1.54 (95% CI 1.22 to 1.93; P = 0.0002) (Analysis 17.1) and there was no significant heterogeneity (I2 = 0%; P = 0.40).
A test for interaction between the two groups for overall tumour response revealed a significant interaction (P = 0.009).
Treatment‐related deaths
Data were available for five of the nine trials of first‐line chemotherapy. In the trials of first‐line chemotherapy there were 14 deaths in the combination arm and six deaths in the sequential arm but this was not statistically different (HR 1.72; 95% CI 0.70 to 4.18; P = 0.23) (Analysis 18.1) and there was no significant heterogeneity (I2 = 33%; P = 0.21).
Data were available for two out of the three trials of second‐ or third‐line chemotherapy. In these trials there were two deaths in the combination arm and two deaths in the sequential arm and this was not statistically different (HR 1.06; 95% CI 0.23 to 4.94; P = 0.94) (Analysis 18.1) and there was no significant heterogeneity (I2 = 59%; P = 0.12).
A test for interaction between the two groups for treatment‐related deaths revealed no significant interaction (P = 0.59).
Neutropenia
Data were available for all nine trials of first‐line chemotherapy. In the trials of first‐line chemotherapy there was no difference in rates of neutropenia (RR 0.96; 95% CI 0.87 to 1.05; P = 0.39) (Analysis 19.1) but there was significant heterogeneity between the trials (I2 = 81%; P < 0.00001).
Data were available for all three trials of second‐ or third‐line chemotherapy. In these trials there were higher rates of neutropenia in the sequential arm compared to the combination arm (RR 0.64; 95% CI 0.48 to 0.85; P = 0.002) (Analysis 19.1) and there was no significant heterogeneity (I2 = 0%; P = 0.62).
A test for interaction between the two groups for neutropenia revealed a significant interaction (P = 0.007).
Febrile neutropenia
Data were available for seven out of nine trials of first‐line chemotherapy. In these trials there were higher rates of febrile neutropenia in the combination arm compared to the sequential arm (RR 1.34; 95% CI 1.07 to 1.68; P = 0.01) (Analysis 20.1) and there was significant heterogeneity (I2 = 48%; P = 0.07).
Data were available for two out of the three trials of second‐ or third‐line chemotherapy. In these trials there was no difference in the rates of febrile neutropenia (RR 0.86; 95% CI 0.24 to 3.15; P = 0.82) (Analysis 20.1) and no significant heterogeneity (I2 = 43%; P = 0.18).
A test for interaction between the two groups for febrile neutropenia revealed no significant interaction (P = 0.51).
Nausea and vomiting
Data were available for five out of nine trials of first‐line chemotherapy. There was no difference in the rate of nausea and vomiting (RR 0.85; 95% CI 0.55 to 1.33; P = 0.48) (Analysis 21.1) and no significant heterogeneity (I2 = 0%; P = 0.53).
Data were available for all three trials of second‐ or third‐line chemotherapy. There was no difference in the rate of nausea and vomiting (RR 1.25; 95% CI 0.27 to 5.74; P = 0.78) (Analysis 21.1) and no significant heterogeneity (I2 = 25%; P = 0.25).
A test for interaction between the two groups for nausea and vomiting revealed no significant interaction (P = 0.64).
Chemotherapy given on disease progression (schema 1) versus chemotherapy given for a set number of cycles (schema 2)
We conducted a pre‐specified subgroup analysis to investigate the treatment effect in trials where the combination or sequential arms were given until disease progression (schema 1) compared to trials where the combination or sequential arms were given for a set number of cycles (schema 2). In total, there were six trials that used schema 1 and six trials that used schema 2.
Overall survival
Data were available for five out of the six trials that used schema 1. In trials where chemotherapy was given on disease progression there was no difference in overall survival, with a HR of 0.98 (95% CI 0.86 to 1.12; P = 0.77) (Analysis 22.1), and there was no significant heterogeneity (I2 = 47%; P = 0.11).
Data were available for four out of the six trials that used schema 2. In trials where chemotherapy was given for a set number of cycles there was no difference in overall survival, with a HR of 1.22 (95% CI 0.99 to 1.49; P = 0.06) (Analysis 22.1), and there was no significant heterogeneity (I2 = 0%; P = 1.00).
A test for interaction between the two groups for overall survival revealed no significant interaction (P = 0.08).
Progression‐free survival
In the amended analysis, data were available for three out of the six trials that used schema 1. In trials where chemotherapy was given on disease progression there was no difference in progression‐free survival in the combination arm compared to the sequential arm with a HR of 1.11 (95% CI 0.94 to 1.31; P = 0.23) (Analysis 23.1) but there was significant heterogeneity (I2 = 70%; P = 0.03). Data were available for four out of the six trials that used schema 2. In trials where chemotherapy was given for a set number of cycles, there was no difference in progression‐free survival, with a HR of 1.12 (95% CI 0.94 to 1.33; P = 0.22) (Analysis 23.1), and there was no significant heterogeneity (I2 = 0%; P = 0.84).
A test for interaction between the two groups for progression‐free survival revealed no significant interaction (P = 0.95).
In the original analysis, data were available for four out of the six trials that used schema 1. In trials where chemotherapy was given on disease progression there was a higher risk of progression in the combination arm compared to the sequential arm with a HR of 1.20 (95% CI 1.03 to 1.40; P = 0.02) (Analysis 23.2) but there was significant heterogeneity (I2 = 63%; P = 0.04). Data were available for four out of the six trials that used schema 2. In trials where chemotherapy was given for a set number of cycles there was no difference in progression‐free survival, with a HR of 1.12 (95% CI 0.94 to 1.33; P = 0.22) (Analysis 23.2), and there was no significant heterogeneity (I2 = 0%; P = 0.84).
A test for interaction between the two groups for progression‐free survival revealed no significant interaction (P = 0.54).
Overall response
Data were available for all six trials that used schema 1. In trials where chemotherapy was given on disease progression there was a higher overall tumour response in the combination arm compared to the sequential arm with a HR of 1.46 (95% CI 1.28 to 1.65; P < 0.00001) (Figure 6) but there was significant heterogeneity (I2 = 58%; P = 0.04).

Forest plot of comparison: 24 Overall response ‐ schema 1 versus schema 2, outcome: 24.1 Overall response ‐ schema 1 versus schema 2.
Data were available for all six trials that used schema 2. In trials where chemotherapy was given for a set number of cycles there was no significant difference in overall tumour response in the combination compared to the sequential arm, with a HR of 0.92 (95% CI 0.80 to 1.04; P = 0.19) (Figure 6), and there was no significant heterogeneity (I2 = 0%; P = 0.65).
A test for interaction between the two groups for overall tumour response revealed a significant interaction (P < 0.00001).
Treatment‐related deaths
Data were available for three out of the six trials that used schema 1. In trials where chemotherapy was given on disease progression there were nine deaths in the combination arm and seven deaths in the sequential arm, with no significant difference in treatment‐related deaths (HR of 0.94; 95% CI 0.36 to 2.44; P = 0.90) (Analysis 25.1) and no significant heterogeneity (I2 = 58%; P = 0.09).
Data were available for four out of the six trials that used schema 2. In trials where chemotherapy was given for a set number of cycles there were seven deaths in the combination arm and one death in the sequential arm, with no significant difference (HR 4.00; 95% CI 0.87 to 18.35; P = 0.07) (Analysis 25.1) and no significant heterogeneity (I2 = 0%; P = 0.89).
A test for interaction between the two groups for treatment‐related deaths revealed no significant interaction (P = 0.11).
Neutropenia
Data were available for all six trials that used schema 1. In trials where chemotherapy was given on disease progression there was no difference in the rates of neutropenia (RR 0.99; 95% CI 0.87 to 1.14; P = 0.92) (Analysis 26.1) and there was significant heterogeneity (I2 = 47%; P = 0.09).
Data were available for all six trials that used schema 2. In trials where chemotherapy was given for a set number of cycles there was no difference in the rates of neutropenia (RR 0.92; 95% CI 0.84 to 1.01; P = 0.07) (Analysis 26.1) but there was significant heterogeneity (I2 = 88%; P < 0.00001).
A test for interaction between the two groups for neutropenia revealed no significant interaction (P = 0.35).
Febrile neutropenia
Data were available for three out of six trials that used schema 1. In trials where chemotherapy was given on disease progression there was an increased risk of febrile neutropenia in the combination arm compared to the sequential arm (RR 1.76; 95% CI 1.14 to 2.73; P = 0.01) (Analysis 27.1) and no significant heterogeneity (I2 = 19%; P = 0.29).
Data were available for all six trials that used schema 2. In trials where chemotherapy was given for a set number of cycles there was no difference in the risk of febrile neutropenia (RR 1.19; 95% CI 0.92 to 1.55; P =0.18) (Analysis 27.1) and no significant heterogeneity (I2 = 44%; P = 0.11).
A test for interaction between the two groups for febrile neutropenia revealed no significant interaction (P = 0.13).
Nausea and vomiting
Data were available for three out of six trials that used schema 1. In trials where chemotherapy was given on disease progression there was no difference in the risk of nausea and vomiting (RR 0.75; 95% CI 0.39 to 1.46; P = 0.40) (Analysis 28.1) and no significant heterogeneity (I2 = 0%; P = 0.97).
Data were available for five out of six trials that used schema 2. In trials where chemotherapy was given for a set number of cycles there was no difference in the risk of nausea and vomiting (RR 0.98; 95% CI 0.56 to 1.71; P = 0.94) (Analysis 28.1) and no significant heterogeneity (I2 = 8%; P = 0.36).
A test for interaction between the two groups for nausea and vomiting revealed no significant interaction (P = 0.56).
Relative dose intensity
We conducted a pre‐specified subgroup analysis to investigate the treatment effect in trials that contained arms with a similar relative dose intensity (RDI) compared to trials where there was a different RDI. In total, there were three trials with a similar RDI and three trials with a different RDI.
Overall survival
Data were available for two out of the three trials with a similar RDI between the combination and sequential arms. In the trials with a similar RDI between arms there was no difference in overall survival, with a HR of 1.23 (95% CI 0.93 to 1.62; P = 0.15) (Analysis 29.1), and no significant heterogeneity (I2 = 0%; P = 0.96).
Data were available for two out of the three trials with a different RDI. There was no difference in overall survival, with a HR of 1.03 (95% CI 0.76 to 1.40; P = 0.84) (Analysis 29.1), and no significant heterogeneity (I2 = 28%; P = 0.24).
A test for interaction between the two groups for overall survival revealed no significant interaction (P = 0.42).
Progression‐free survival
In the amended analysis, data were available for two out of the three trials with a similar RDI. There was no difference in progression, with a HR of 1.15 (95% CI 0.91 to 1.45; P = 0.26) (Analysis 30.1), and no significant heterogeneity (I2 = 0%; P = 0.44). Data were available for one of the three trials with a different RDI. There was no difference in progression, with a HR of 0.85 (95% CI 0.24 to 2.99; P = 0.80) (Analysis 30.1).
A test for interaction between the two groups for progression‐free survival revealed no significant interaction (P = 0.65).
In the original analysis, data were available for two out of the three trials with a similar RDI and the results were the same as the amended analysis (refer to Analysis 30.2). Data were available for two out of the three trials with a different RDI. There was no difference in progression, with a HR of 1.25 (95% CI 0.80 to 1.95; P = 0.33) (Analysis 30.2), and no significant heterogeneity (I2 = 0%; P = 0.52).
A test for interaction between the two groups for progression‐free survival revealed no significant interaction (P = 0.74).
Overall response
Data were available for all three trials with a similar RDI between the combination and sequential arms. There was no difference in overall tumour response, with a HR of 0.88 (95% CI 0.72 to 1.07; P = 0.20) (Analysis 31.1), and no significant heterogeneity (I2 = 0%; P = 0.43).
Data were available for all three trials with a different RDI between the combination and sequential arms. There was no difference in overall tumour response, with a HR of 0.93 (95% CI 0.72 to 1.20; P = 0.55) Analysis 31.1), and no significant heterogeneity (I2 = 46%; P = 0.16).
A test for interaction between the two groups for overall tumour response revealed no significant interaction (P = 0.76).
Treatment‐related deaths
Data were available for one out of three trials with a similar RDI. In this trial with a similar RDI in the combination and sequential arms there were no treatment‐related deaths in either arm.
Data were available for all three trials with a different RDI between the combination and sequential arms. There were four deaths in the combination arm and two deaths in the sequential arm but this was not statistically significant, with a HR of 1.66 (95% CI 0.45 to 6.10; P = 0.44) (Analysis 32.1), and was without significant heterogeneity (I2 = 37%; P = 0.20).
A test for interaction was not applicable.
Neutropenia
Data were available for all three trials with a similar RDI. There was no difference in the rates of neutropenia (RR 1.08; 95% CI 0.97 to 1.20; P = 0.15) (Analysis 33.1) and no significant heterogeneity (I2 = 60%; P = 0.08).
Data were available for all three trials with a different RDI. In trials with differing RDIs there were higher rates of neutropenia in the sequential arm compared to the combination arm (RR 0.67; 95% CI 0.51 to 0.87; P = 0.003) (Analysis 33.1) and no significant heterogeneity (I2 = 12%; P = 0.32).
A test for interaction revealed a significant difference for neutropenia between the two groups (P = 0.001).
Febrile neutropenia
Data were available for all three trials with a similar RDI. There was a higher rate of febrile neutropenia in the combination arm compared to the sequential arm (RR 2.36; 95% CI 1.21 to 4.62; P = 0.01) (Analysis 34.1) and there was no significant heterogeneity (I2 = 36%; P = 0.21).
Data were available for all three trials with a different RDI. In trials with differing RDIs there was no difference in the rates of febrile neutropenia (RR 1.07; 95% CI 0.80 to 1.42; P = 0.66) (Analysis 34.1) and no significant heterogeneity (I2 = 0%; P = 0.39).
A test for interaction revealed a significant difference for febrile neutropenia between the two groups (P = 0.03).
Nausea and vomiting
Data were available for all three trials with a similar RDI. There was no difference in the rates of nausea and vomiting (RR 1.14; 95% CI 0.50 to 2.60; P = 0.75) (Analysis 35.1) and no significant heterogeneity (I2 = 19%; P = 0.29).
Data were available for all three trials with a different RDI. There was no difference in the rates of nausea and vomiting (RR 0.86; 95% CI 0.40 to 1.83; P = 0.69) (Analysis 35.1) and no significant heterogeneity (I2 = 39%; P = 0.20).
A test for interaction between the two groups for nausea and vomiting revealed no significant interaction (P = 0.62).
Discussion
Summary of main results
There was no statistically significant benefit in overall survival for combination compared to sequential single agent chemotherapy in the first‐, second‐ or third‐line treatment of metastatic breast cancer. This result was consistent in the four subgroups analysed (that is trials judged as high versus low risk of bias, first‐line versus second‐ or third‐line, schema 1 versus schema 2, and similar versus different dose intensity). In particular, there was no difference in outcome according to the type of sequential schema of chemotherapy.
In this amended version of the review, where progression‐free survival in the combination arm was compared to time to first progression in the sequential arm, there was only weak evidence that combination therapy had a higher risk of progression than sequential therapy (HR 1.11; 95% CI 0.99 to 1.25; P = 0.08), with no significant heterogeneity. This result was consistent in all subgroups. In the original progression‐free survival analysis, time to progression in the combination arm was compared to time to second progression in the sequential arm and showed that combination chemotherapy had a statistically significant higher risk of progression than sequential therapy (HR1.16; 95% CI 1.03 to 1.31; P = 0.01). However it is likely that this analysis is biased in favour of the sequential arm, particularly given that the Sledge 2003 is the largest trial, and is given the greatest weight.
Overall tumour response rates were higher for combination therapy compared to sequential therapy (RR 1.16; 95% CI 1.06 to 1.28; P = 0.001) but there was significant heterogeneity for this outcome across the trials. In trials with a high or unclear risk of bias there was a higher rate of tumour response (RR 1.26; 95% CI 1.13 to 1.39; P < 0.0001) than in the two trials which had a low risk of bias (RR 0.91; 95% CI 0.76 to 1.10; P = 0.35), however there was significant heterogeneity in the trials of high or unclear risk of bias. A test for interaction revealed a difference between these two groups (P = 0.004). There was evidence of an effect of combination chemotherapy on tumour response rate for trials of first‐line chemotherapy (RR 1.10; 95% 1.00 to 1.22; P = 0.05) but there was significant heterogeneity. The effect was greater in trials of second‐ or third‐line chemotherapy (RR 1.54; 95% CI 1.22 to 1.93; P = 0.0002) and the test for interaction revealed a difference in these subgroups (P = 0.009). The effect on tumour response was greater in trials where chemotherapy was changed on disease progression (schema 1, RR 1.46; 95% CI 1.28 to 1.65; P < 0.00001) but with significant heterogeneity compared to trials where chemotherapy was given for a set number of cycles (schema 2, RR 0.92; 95% CI 0.80 to 1.04; P = 0.19). The test for interaction confirmed a difference between schema 1 and schema 2 (P < 0.00001).
As aforementioned, there was no difference in overall survival or progression‐free survival according to the schema of chemotherapy drugs given. Given this result, it seems preferable to use combination chemotherapy, and change treatment on disease progression (schema 1), in the setting of rapidly progressive disease when a greater response rate is desired.
In the seven trials that reported treatment‐related deaths, there were 16 deaths for combination therapy compared to eight deaths for sequential therapy but there was no statistically significant difference (RR 1.53; 95% CI 0.71 to 3.29; P = 0.28). The confidence interval was wide due to the small number of events.
The risk of febrile neutropenia was higher for combination therapy (RR 1.32; 95% CI 1.06 to 1.65; P = 0.01). This outcome was consistent amongst all subgroups, although there was a higher risk of febrile neutropenia in trials with a similar RDI (RR 2.36; 95% CI 1.21 to 4.62; P = 0.01) compared to trials where there was a different dose intensity (RR 1.07; 95% CI 0.80 to 1.42; P = 0.66), and the test of interaction between these groups was significant (P = 0.03).
Overall, there was no significant difference in the risk of neutropenia (RR 0.94; 95% CI 0.87 to 1.02; P = 0.12) but there was significant heterogeneity between these trials (P < 0.00001). The risk of neutropenia was lower for combination therapy than for sequential therapy in trials which had a low risk of bias (RR 0.62; 95% CI 0.50 to 0.76; P < 0.00001) compared to those with a high risk of bias (RR 1.00; 95% CI 0.92 to 1.09; P = 0.98) and the test for interaction between these groups was significant (P < 0.0001). There was significant heterogeneity between the trials in both of these subgroups. Neutropenia rates were also lower for the combination therapy compared to the sequential therapy in trials of second‐ or third‐line chemotherapy (RR 0.64; 95% CI 0.48 to 0.85; P = 0.002) compared to trials of first‐line chemotherapy (RR 0.96; 95% CI 0.87 to 1.05; P = 0.39). The test of interaction between these groups was significant (P = 0.007). Neutropenia rates were lower in the combination therapy compared to the sequential therapy in trials using a different RDI (RR 0.67; 95% CI 0.51 to 0.87; P = 0.003) compared to trials that used a similar RDI (RR 1.08; 95% CI 0.97 to 1.20; P = 0.15). The test of interaction between these groups was significant (P = 0.001).
There was no significant difference in the risk of nausea and vomiting between the combination and sequential single agent therapies (RR 0.88; 95% CI 0.57 to 1.37; P = 0.55) and this was consistent across all subgroups analysed.
Quality of life was only measured in three out of the 12 trials in this review. In Sledge 2003 there was no difference in quality of life between the two arms, however in Conte 2004 and Park 2010 there was a suggestion of a better quality of life in some domains in the combination arm compared to the sequential arm. In Conte 2004 the trend towards inferior quality of life in the sequential arm was thought to be due to the higher doses of the single agents, which caused more haematological and neurological toxicity. In Park 2010 increased functional scores (role function, social function) and global health in the combination arm were postulated to be due to the better response rate in the combination arm. This is consistent with studies of quality of life in the palliative setting where quality of life was related to how responsive the tumour was to chemotherapy (Modi 2002Shin 2008).
Overall completeness and applicability of evidence
While data for overall and progression‐free survival could be extracted for the majority of trials (nine of 12 trials for overall survival, and seven of 12 trials for progression‐free survival in the amended analysis), the evidence would be more complete if these data were available for all trials. In the trials where the data were missing, two were published in abstract form (Koroleva 2001Soto 2006). In Cresta 2004, HRs were not published for overall survival or progression‐free survival, and survival curves were not included in the paper. Chlebowski 1989 did not publish a HR for progression‐free survival, or include a survival curve. Despite some missing data, the evidence is still applicable to clinical practice because survival data were available for the majority of trials and the results in the subgroup analyses were consistent with the overall HRs. All trials provided data on tumour response and neutropenia. There was a paucity of quality of life data, which means it is not possible to generalise about the effect of combination versus sequential single agent chemotherapy on quality of life.
Quality of the evidence
The majority of trials (10 out of 12) were classified as having an unclear or high risk of bias. For most of these trials this classification was made because it was not clearly explained in the trial methods if factors such as randomisation and blinding were done properly. Randomisation and blinding make up four out of a total of seven factors on which the risk of bias is assessed (random sequence generation, allocation concealment, blinding of participants and personnel, and blinding of outcome assessment). As a result, there was a tendency for most trials to score poorly for risk of bias. While unclear risk is categorised with a high risk of bias it may be that this is an unfair assumption and randomisation may in fact have been done properly. Also, blinding is rarely feasible in chemotherapy trials. The risk of bias in the randomised controlled trials included in this review may therefore be overestimated and the quality of the trials may be better than this scoring system implies.
Potential biases in the review process
There were no potential biases in the review process.
Agreements and disagreements with other studies or reviews
The higher overall tumour response rate for combination therapy is consistent with other reviews of combination chemotherapy in metastatic breast cancer (Butters 2011; Carrick 2009). Butters 2011 aimed to assess the effect of adding a chemotherapy drug, or drugs, to an established chemotherapy regimen in metastatic breast cancer and demonstrated an advantage for tumour response for adding one or more drugs, but there was no difference in overall survival or time to progression. There was more toxicity with the addition of one or more drugs to a regimen. Carrick 2009 aimed to assess the effect of combination chemotherapy compared to single agent chemotherapy in metastatic breast cancer and found that combination chemotherapy had superior overall survival, time to progression and response rates, but more toxicity. Both of these Cochrane reviews found a high rate of toxicity for neutropenia, alopecia and nausea and vomiting. Febrile neutropenia was not analysed separately. Our review found higher rates of febrile neutropenia for combination therapy but no overall difference in the rates of neutropenia or nausea and vomiting. We did not analyse rates of alopecia. The higher risk of detection of neutropenia for sequential therapy compared to combination therapy in some subgroups is likely due to the higher doses of the single agents used.
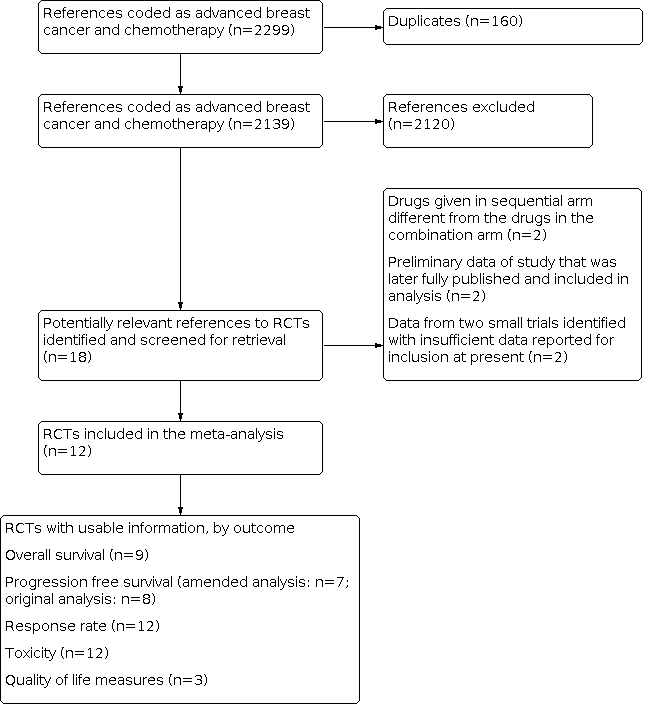
Results of search strategy applied 31 October 2013 for combination versus sequential single agent chemotherapy for metastatic breast cancer.

Risk of bias graph: review authors' judgements about each risk of bias item presented as percentages across all included studies.

Forest plot of comparison: 1 Overall survival, outcome: 1.1 Overall survival (all trials).

Forest plot of comparison: 2 Progression‐free survival, outcome: 2.1 Progression‐free survival (amended analysis).

Forest plot of comparison: 3 Overall response, outcome: 3.1 Overall response (all trials).

Forest plot of comparison: 24 Overall response ‐ schema 1 versus schema 2, outcome: 24.1 Overall response ‐ schema 1 versus schema 2.

Comparison 1: Overall survival, Outcome 1: Overall survival (all trials)

Comparison 2: Progression‐free survival, Outcome 1: Progression‐free survival (amended analysis)

Comparison 2: Progression‐free survival, Outcome 2: Progression‐free survival (all trials)

Comparison 3: Overall response, Outcome 1: Overall response (all trials)

Comparison 4: Treatment‐related deaths, Outcome 1: Treatment‐related deaths (all trials)

Comparison 5: Neutropenia, Outcome 1: Neutropaenia

Comparison 6: Febrile neutropenia, Outcome 1: Febrile neutropenia

Comparison 7: Nausea and vomiting, Outcome 1: Nausea and vomiting

Comparison 8: Overall survival ‐ risk of bias, Outcome 1: Overall survival ‐ risk of bias

Comparison 9: Progression‐free survival ‐ risk of bias, Outcome 1: Progression‐free survival ‐ risk of bias (amended analysis)

Comparison 9: Progression‐free survival ‐ risk of bias, Outcome 2: Progression‐free survival ‐ risk of bias

Comparison 10: Overall response ‐ risk of bias, Outcome 1: Overall response ‐ risk of bias

Comparison 11: Treatment‐related deaths ‐ risk of bias, Outcome 1: Treatment‐related deaths ‐ risk of bias

Comparison 12: Neutropenia ‐ risk of bias, Outcome 1: Neutropaenia ‐ risk of bias

Comparison 13: Febrile neutropenia ‐ risk of bias, Outcome 1: Febrile neutropenia ‐ risk of bias

Comparison 14: Nausea and vomiting ‐ risk of bias, Outcome 1: Nausea and vomiting ‐ risk of bias

Comparison 15: Overall survival ‐ line of chemotherapy, Outcome 1: Overall survival ‐ line of chemotherapy

Comparison 16: Progression‐free survival ‐ line of chemotherapy, Outcome 1: Progression free survival ‐ line of chemotherapy (amended analysis)

Comparison 16: Progression‐free survival ‐ line of chemotherapy, Outcome 2: Progression free survival ‐ line of chemotherapy

Comparison 17: Overall response ‐ line of chemotherapy, Outcome 1: Overall response ‐ subgroup analysis, line of chemotherapy

Comparison 18: Treatment‐related deaths ‐ line of chemotherapy, Outcome 1: Treatment‐related deaths ‐ line of chemotherapy

Comparison 19: Neutropenia ‐ line of chemotherapy, Outcome 1: Neutropaenia ‐ line of chemotherapy

Comparison 20: Febrile neutropenia ‐ line of chemotherapy, Outcome 1: Febrile neutropenia ‐ line of chemotherapy

Comparison 21: Nausea and vomiting ‐ line of chemotherapy, Outcome 1: Nausea and vomiting ‐ line of chemotherapy

Comparison 22: Overall survival ‐ schema 1 versus schema 2, Outcome 1: Overall survival ‐ Schema 1 versus Schema 2

Comparison 23: Progression‐free survival ‐ schema 1 versus schema 2, Outcome 1: Progression‐free survival ‐ Schema 1 versus Schema 2 (amended analysis)

Comparison 23: Progression‐free survival ‐ schema 1 versus schema 2, Outcome 2: Progression‐free survival ‐ Schema 1 versus Schema 2

Comparison 24: Overall response ‐ schema 1 versus schema 2, Outcome 1: Overall response ‐ Schema 1 versus Schema 2

Comparison 25: Treatment‐related deaths ‐ schema 1 versus schema 2, Outcome 1: Treatment‐related deaths ‐ Schema 1 versus Schema 2

Comparison 26: Neutropenia ‐ schema 1 versus schema 2, Outcome 1: Neutropaenia ‐ subgroup analysis, Schema 1 versus Schema 2

Comparison 27: Febrile neutropenia ‐ schema 1 versus schema 2, Outcome 1: Febrile neutropenia ‐ Schema 1 versus Schema 2

Comparison 28: Nausea and vomiting ‐ schema 1 versus schema 2, Outcome 1: Nausea and vomiting ‐ Schema 1 versus Schema 2

Comparison 29: Overall survival ‐ relative dose intensity, Outcome 1: Overall survival ‐ relative dose intensity

Comparison 30: Progression‐free survival ‐ relative dose intensity, Outcome 1: Progression‐free survival ‐ relative dose intensity (amended analysis)

Comparison 30: Progression‐free survival ‐ relative dose intensity, Outcome 2: Progression‐free survival ‐ relative dose intensity

Comparison 31: Overall response ‐ relative dose intensity, Outcome 1: Overall response ‐ relative dose intensity

Comparison 32: Treatment‐related deaths ‐ relative dose intensity, Outcome 1: Treatment‐related deaths ‐ relative dose intensity

Comparison 33: Neutropenia ‐ relative dose intensity, Outcome 1: Neutropaenia ‐ relative dose intensity

Comparison 34: Febrile neutropenia ‐ relative dose intensity, Outcome 1: Febrile neutropenia ‐ relative dose intensity

Comparison 35: Nausea and vomiting ‐ relative dose intensity, Outcome 1: Nausea and vomiting ‐ relative dose intensity
| Combination | Sequential | Number of trials |
| doxorubicin + docetaxel | doxorubicin → docetaxel | Cresta 2004(included alternating regimen) Koroleva 2001 (included 2 combination arms with different doses) |
| 5‐fluorouracil + cyclophosphamide + vincristine | 5‐fluorouracil → cyclophosphamide → vincristine | |
| capecitabine + docetaxel or paclitaxel | capecitabine → docetaxel or paclitaxel | |
| 5‐fluorouracil + cyclophosphamide + prednisone + thyroxine or vincristine | 5‐fluorouracil → cyclophosphamide → thyroxine or vincristine → prednisone | |
| epirubicin + paclitaxel | epirubicin → paclitaxel | |
| epirubicin + paclitaxel | dose dense epirubicin→ paclitaxel | |
| gemcitabine + vinorelbine | gemcitabine → vinorelbine | |
| doxorubicin + paclitaxel | doxorubicin → paclitaxel or paclitaxel → doxorubicin | |
| docetaxel + gemcitabine | docetaxel → gemcitabine |
| Trial name | Arm I | Arm II |
| Alba 2004 | Arm I: AT= Doxorubicin 50 mg/m2 and docetaxel 75 mg/m2 both on day 1. Cycles repeated every 21 days for 6 cycles. If prior anthracyclines: given 3 cycles of AT at above doses followed by 3 cycles of docetaxel 100 mg/m2 | Arm II: A→T= Doxorubicin 75 mg/m2 intravenously day 1 for 3 cycles followed by docetaxel 100 mg/m2 intravenously day 1 for 3 cycles. If prior anthracyclines given 2 cycles of doxorubicin 75 mg/m2 followed by 4 cycles of docetaxel 100 mg/m2. Cycles repeated every 21 days |
| Baker 1974 | Arm I: FCV= 5‐fluorouracil 7.5 mg/kg intravenously days 1‐5 plus cyclophosphamide 4 mg/kg intravenously days 1 to 5 plus vincristine 0.015 mg/kg intravenously days 1 and 8. Cycles repeated every 28 days until disease progression | Arm II: F→C→V= 5‐fluorouracil 15 mg/kg intravenously days 1 to 5 every 28 days until disease progression then cyclophosphamide 8 mg/kg intravenously days 1 to 5 every 28 days until disease progression then vincristine 0.02 mg/kg intravenously weekly until disease progression |
| Beslija 2006 | Arm I: XT= Capecitabine (Xeloda, X) 1250 mg/m2 twice daily orally from days 1 to 14 and docetaxel (Taxotere, T) 75 mg/m2 intravenously day 1. Cycle repeated every 21 days until disease progression | Arm II: T→X= Docetaxel 100 mg/m2 intravenously day 1 until disease progression then capecitabine 1250 mg/m2 twice daily orally from days 1 to 14 until disease progression. Cycles repeated every 21 days |
| Chlebowski 1989 | WCSG Arm I: CMFTP= Cyclophosphamide 2 mg/kg/day orally, plus 5‐fluorouracil 15 mg/kg every 2 weeks intravenously from day 1, plus methotrexate 30 mg/m2 every 2 weeks intravenously beginning on day 8, plus prednisone 0.5 mg/kg/day orally, plus triiodothyronine 0.005 mg daily. Cycle repeated until disease progression. SECSG Arm I: Cyclophosphamide 400 mg/m2 intravenously day 1 every 28 days, plus 5‐fluorouracil 400 mg/m2 intravenously day 1 and day 8 every 28 days, plus methotrexate 30 mg/m2 intravenously day 1 and day 8 every 28 days, plus vincristine 1 mg/m2 intravenously day 1 and day 8 every 28 days, plus prednisone 80mg orally daily from days 1 to 7 every 28 days. Cycle repeated until disease progression. or Cyclophosphamide 100 mg orally daily, plus 5‐fluorouracil 400 mg/m2 intravenously weekly, plus methotrexate 20 mg/m2 orally weekly, plus vincristine 1 mg/m2 intravenously weekly, plus prednisone 45 mg orally daily for 14 days, then 30 mg daily for 14 days then 15 mg daily for 28 days. Cycle repeated until disease progression | WCSG Arm II: F→C→TP→M= 5‐fluorouracil 15 mg/kg weekly intravenously from day 1 for a minimum of 4 weeks until disease progression then cyclophosphamide 2 mg/kg/day orally for a minimum of 4 weeks until disease progression then triiodothyronine 0.005 mg daily plus prednisone 0.5 mg/kg/day for a minimum of 6 weeks until disease progression then methotrexate 30 mg/m2 intravenously weekly for a minimum of 4 weeks SECSG Arm II: F→MC→V→P= 5‐fluorouracil 600 mg/m2 intravenously weekly until disease progression then methotrexate 20 mg/m2 orally biweekly until disease progression then cyclophosphamide 100 mg/m2 orally daily until disease progression then vincristine 1 mg/m2 intravenously weekly until disease progression then prednisone 45 mg orally daily for 14 days then 30 mg daily for 14 days then 15 mg daily for 30 days |
| Conte 2004 | Arm I: EP= Epirubicin 90 mg/m2 plus paclitaxel 200 mg/m2 intravenously day 1. Cycles repeated every 21 days for 8 cycles | Arm II: E→P= Epirubicin 120 mg/m2 intravenously day 1 for 4 cycles then paclitaxel 250 mg/m2 intravenously day 1 for 4 cycles. Cycles repeated every 21 days |
| Cresta 2003 | Arm I: AT= Doxorubicin 60 mg/m2 plus docetaxel 60 mg/m2 intravenously day. Cycles repeated every 21 days for 8 cycles | Arm II: A→T (sequential regimen)= Doxorubicin 75 mg/m2 intravenously on day 1 for 4 cycles followed by docetaxel 75 mg/m2 intravenously on day 1 for 4 cycles. Cycles repeated every 21 days. Maximum 8 cycles. Arm III: T then A (alternating regimen)= Docetaxel 100 mg/m2 intravenously on day 1 for 4 cycles alternating with doxorubicin 75 mg/m2 intravenously on day 1 for 4 cycles. Cycles repeated every 21 days. Maximum 8 cycles |
| Fountzilas 2001 | Arm I: P= Epirubicin 80 mg/m2 plus paclitaxel 175 mg/m2 intravenously day 1. Cycles repeated every 21 days for 6 cycles | Arm II: E→P Epirubicin 110 mg/m2 intravenously day 1 for 4 cycles followed by paclitaxel 225 mg/m2 intravenously day 1 for 4 cycles. Cycles repeated every 14 days with G‐CSF support (dose dense regimen) |
| Koroleva 2001 | Arm I: AT= Doxorubicin 50 mg/m2 plus docetaxel 75 mg/m2 intravenously day 1. Cycles repeated every 21 days for 8 cycles | Arm II: T→A= Docetaxel 100 mg/m2 intravenously day 1 for 4 cycles followed by doxorubicin 75 mg/m2 intravenously day 1 for 4 cycles. Cycles repeated every 21 days. Arm III: AT= Doxorubicin 60 mg/m2 plus docetaxel 60 mg/m2 intravenously day 1. Cycles repeated every 21 days for 8 cycles |
| Park 2010 | Arm I: GV= Gemcitabine 1,000 mg/m2 plus vinorelbine 25 mg/m2 intravenously days 1 and 8. Cycles repeated every 21 days until disease progression | Arm II: G→V= Gemcitabine 1,200 mg/m2 intravenously on days 1 and 8 until disease progression then vinorelbine 30 mg/m2 intravenously days 1 and 8 until disease progression. Cycles repeated every 21 days |
| Sledge 2003 | Arm I: AT= Doxorubicin 50 mg/m2 plus paclitaxel 150 mg/m2 over 24 hours intravenously day 1. Cycles repeated every 21 days until disease progression | Arm II: A (→P)= Doxorubicin 60 mg/m2 intravenously day 1 for a maximum of 8 cycles. If disease progressed crossed over to paclitaxel 175 mg/m2 intravenously over 24 hours on day 1. Cycles repeated every 21 days. Arm III: P (→A)= Paclitaxel 175 mg/m2 intravenously over 24 hours on day 1. If disease progressed crossed over to doxorubicin 60 mg/m2 intravenously day 1. Cycles repeated every 21 days |
| Soto 2006 | Arm I: XT= Capecitabine 825 mg/m2 twice daily orally from days 1 to 14 plus docetaxel 75 mg/m2 intravenously on day 1 until disease progression. Cycles repeated every 21 days | Arm II: X→T (docetaxel or paclitaxel)= Capecitabine 1250 mg/m2 twice daily orally days 1 to 14 until disease progression then docetaxel 100 mg/m2 or paclitaxel 175 mg/m2 intravenously on day 1 until disease progression. Cycles repeated every 21 days. Arm III: XP= Capecitabine 825 mg/m2 twice daily orally from days 1 to 14 plus paclitaxel 175 mg/m2 intravenously on day 1 until disease progression. Cycles repeated every 21 days |
| Tomova 2010 | Arm I: TG= Docetaxel 75 mg/m2 intravenously on day 1 plus gemcitabine 1,000 mg/m2 intravenously on days 1 and 8. Cycles repeated every 21 days for 8 cycles | Arm II: T→G= Docetaxel 100 mg/m2 intravenously on day 1 for 4 cycles followed by gemcitabine 1,250 mg/m2 intravenously on days 1 and 1 for 4 cycles. Cycles repeated every 21 days |
| Outcome or subgroup title | No. of studies | No. of participants | Statistical method | Effect size |
| 1.1 Overall survival (all trials) Show forest plot | 9 | 1786 | Hazard Ratio (IV, Fixed, 95% CI) | 1.04 [0.93, 1.16] |
| Outcome or subgroup title | No. of studies | No. of participants | Statistical method | Effect size |
| 2.1 Progression‐free survival (amended analysis) Show forest plot | 7 | 1483 | Hazard Ratio (IV, Fixed, 95% CI) | 1.11 [0.99, 1.25] |
| 2.2 Progression‐free survival (all trials) Show forest plot | 8 | Hazard Ratio (IV, Fixed, 95% CI) | 1.16 [1.03, 1.31] | |
| Outcome or subgroup title | No. of studies | No. of participants | Statistical method | Effect size |
| 3.1 Overall response (all trials) Show forest plot | 12 | 2140 | Risk Ratio (IV, Fixed, 95% CI) | 1.16 [1.06, 1.28] |
| Outcome or subgroup title | No. of studies | No. of participants | Statistical method | Effect size |
| 4.1 Treatment‐related deaths (all trials) Show forest plot | 7 | 902 | Risk Ratio (M‐H, Fixed, 95% CI) | 1.53 [0.71, 3.29] |
| Outcome or subgroup title | No. of studies | No. of participants | Statistical method | Effect size |
| 5.1 Neutropaenia Show forest plot | 12 | Risk Ratio (IV, Fixed, 95% CI) | 0.94 [0.87, 1.02] | |
| Outcome or subgroup title | No. of studies | No. of participants | Statistical method | Effect size |
| 6.1 Febrile neutropenia Show forest plot | 9 | Risk Ratio (IV, Fixed, 95% CI) | 1.32 [1.06, 1.65] | |
| Outcome or subgroup title | No. of studies | No. of participants | Statistical method | Effect size |
| 7.1 Nausea and vomiting Show forest plot | 8 | Risk Ratio (IV, Fixed, 95% CI) | 0.88 [0.57, 1.34] | |
| Outcome or subgroup title | No. of studies | No. of participants | Statistical method | Effect size |
| 8.1 Overall survival ‐ risk of bias Show forest plot | 9 | Hazard Ratio (IV, Fixed, 95% CI) | 1.04 [0.93, 1.16] | |
| 8.1.1 Low risk of bias | 2 | Hazard Ratio (IV, Fixed, 95% CI) | 1.21 [0.93, 1.58] | |
| 8.1.2 High/unclear risk of bias | 7 | Hazard Ratio (IV, Fixed, 95% CI) | 1.01 [0.90, 1.14] | |
| Outcome or subgroup title | No. of studies | No. of participants | Statistical method | Effect size |
| 9.1 Progression‐free survival ‐ risk of bias (amended analysis) Show forest plot | 7 | Hazard Ratio (IV, Fixed, 95% CI) | 1.11 [0.99, 1.25] | |
| 9.1.1 Low risk of bias | 2 | Hazard Ratio (IV, Fixed, 95% CI) | 1.15 [0.94, 1.41] | |
| 9.1.2 High/unclear risk of bias | 5 | Hazard Ratio (IV, Fixed, 95% CI) | 1.09 [0.94, 1.26] | |
| 9.2 Progression‐free survival ‐ risk of bias Show forest plot | 8 | Hazard Ratio (IV, Fixed, 95% CI) | 1.16 [1.03, 1.31] | |
| 9.2.1 Low risk of bias | 2 | Hazard Ratio (IV, Fixed, 95% CI) | 1.15 [0.94, 1.41] | |
| 9.2.2 High/unclear risk of bias | 6 | Hazard Ratio (IV, Fixed, 95% CI) | 1.17 [1.01, 1.35] | |
| Outcome or subgroup title | No. of studies | No. of participants | Statistical method | Effect size |
| 10.1 Overall response ‐ risk of bias Show forest plot | 12 | 2140 | Risk Ratio (IV, Fixed, 95% CI) | 1.16 [1.06, 1.28] |
| 10.1.1 Low risk of bias | 2 | 381 | Risk Ratio (IV, Fixed, 95% CI) | 0.91 [0.76, 1.10] |
| 10.1.2 High/unclear risk of bias | 10 | 1759 | Risk Ratio (IV, Fixed, 95% CI) | 1.26 [1.13, 1.39] |
| Outcome or subgroup title | No. of studies | No. of participants | Statistical method | Effect size |
| 11.1 Treatment‐related deaths ‐ risk of bias Show forest plot | 7 | 902 | Risk Ratio (M‐H, Fixed, 95% CI) | 1.53 [0.71, 3.29] |
| 11.1.1 Low risk of bias | 1 | 198 | Risk Ratio (M‐H, Fixed, 95% CI) | 2.60 [0.28, 24.60] |
| 11.1.2 High/unclear risk of bias | 6 | 704 | Risk Ratio (M‐H, Fixed, 95% CI) | 1.41 [0.62, 3.20] |
| Outcome or subgroup title | No. of studies | No. of participants | Statistical method | Effect size |
| 12.1 Neutropaenia ‐ risk of bias Show forest plot | 12 | Risk Ratio (IV, Fixed, 95% CI) | 0.94 [0.87, 1.02] | |
| 12.1.1 Low risk of bias | 2 | Risk Ratio (IV, Fixed, 95% CI) | 0.62 [0.50, 0.76] | |
| 12.1.2 High/unclear risk of bias | 10 | Risk Ratio (IV, Fixed, 95% CI) | 1.00 [0.92, 1.09] | |
| Outcome or subgroup title | No. of studies | No. of participants | Statistical method | Effect size |
| 13.1 Febrile neutropenia ‐ risk of bias Show forest plot | 9 | Risk Ratio (IV, Fixed, 95% CI) | 1.32 [1.06, 1.65] | |
| 13.1.1 Low risk of bias | 2 | Risk Ratio (IV, Fixed, 95% CI) | 1.60 [0.72, 3.57] | |
| 13.1.2 High/unclear risk of bias | 7 | Risk Ratio (IV, Fixed, 95% CI) | 1.30 [1.03, 1.64] | |
| Outcome or subgroup title | No. of studies | No. of participants | Statistical method | Effect size |
| 14.1 Nausea and vomiting ‐ risk of bias Show forest plot | 8 | Risk Ratio (IV, Fixed, 95% CI) | 0.88 [0.57, 1.34] | |
| 14.1.1 Low risk of bias | 1 | Risk Ratio (IV, Fixed, 95% CI) | 1.03 [0.21, 4.99] | |
| 14.1.2 High/unclear risk of bias | 7 | Risk Ratio (IV, Fixed, 95% CI) | 0.87 [0.56, 1.35] | |
| Outcome or subgroup title | No. of studies | No. of participants | Statistical method | Effect size |
| 15.1 Overall survival ‐ line of chemotherapy Show forest plot | 9 | Hazard Ratio (IV, Fixed, 95% CI) | 1.04 [0.93, 1.16] | |
| 15.1.1 First line chemotherapy | 7 | Hazard Ratio (IV, Fixed, 95% CI) | 1.04 [0.93, 1.18] | |
| 15.1.2 Second/third line chemotherapy | 2 | Hazard Ratio (IV, Fixed, 95% CI) | 1.03 [0.76, 1.40] | |
| Outcome or subgroup title | No. of studies | No. of participants | Statistical method | Effect size |
| 16.1 Progression free survival ‐ line of chemotherapy (amended analysis) Show forest plot | 7 | Hazard Ratio (IV, Fixed, 95% CI) | 1.11 [0.99, 1.25] | |
| 16.1.1 First line chemotherapy | 6 | Hazard Ratio (IV, Fixed, 95% CI) | 1.11 [0.99, 1.26] | |
| 16.1.2 Second/third line chemotherapy | 1 | Hazard Ratio (IV, Fixed, 95% CI) | 0.85 [0.24, 2.99] | |
| 16.2 Progression free survival ‐ line of chemotherapy Show forest plot | 8 | Hazard Ratio (IV, Fixed, 95% CI) | 1.16 [1.03, 1.31] | |
| 16.2.1 First line chemotherapy | 6 | Hazard Ratio (IV, Fixed, 95% CI) | 1.16 [1.02, 1.31] | |
| 16.2.2 Second/third line chemotherapy | 2 | Hazard Ratio (IV, Fixed, 95% CI) | 1.25 [0.80, 1.95] | |
| Outcome or subgroup title | No. of studies | No. of participants | Statistical method | Effect size |
| 17.1 Overall response ‐ subgroup analysis, line of chemotherapy Show forest plot | 12 | 2140 | Risk Ratio (IV, Fixed, 95% CI) | 1.16 [1.06, 1.28] |
| 17.1.1 First line chemotherapy | 9 | 1778 | Risk Ratio (IV, Fixed, 95% CI) | 1.10 [1.00, 1.22] |
| 17.1.2 Second/third line chemotherapy | 3 | 362 | Risk Ratio (IV, Fixed, 95% CI) | 1.54 [1.22, 1.93] |
| Outcome or subgroup title | No. of studies | No. of participants | Statistical method | Effect size |
| 18.1 Treatment‐related deaths ‐ line of chemotherapy Show forest plot | 7 | 902 | Risk Ratio (M‐H, Fixed, 95% CI) | 1.53 [0.71, 3.29] |
| 18.1.1 First line chemotherapy | 5 | 722 | Risk Ratio (M‐H, Fixed, 95% CI) | 1.72 [0.70, 4.18] |
| 18.1.2 Second/third line chemotherapy | 2 | 180 | Risk Ratio (M‐H, Fixed, 95% CI) | 1.06 [0.23, 4.94] |
| Outcome or subgroup title | No. of studies | No. of participants | Statistical method | Effect size |
| 19.1 Neutropaenia ‐ line of chemotherapy Show forest plot | 12 | Risk Ratio (IV, Fixed, 95% CI) | 0.92 [0.84, 1.01] | |
| 19.1.1 First‐line chemotherapy | 9 | Risk Ratio (IV, Fixed, 95% CI) | 0.96 [0.87, 1.05] | |
| 19.1.2 Second/third‐line chemotherapy | 3 | Risk Ratio (IV, Fixed, 95% CI) | 0.64 [0.48, 0.85] | |
| Outcome or subgroup title | No. of studies | No. of participants | Statistical method | Effect size |
| 20.1 Febrile neutropenia ‐ line of chemotherapy Show forest plot | 9 | Risk Ratio (IV, Fixed, 95% CI) | 1.32 [1.06, 1.65] | |
| 20.1.1 First‐line chemotherapy | 7 | Risk Ratio (IV, Fixed, 95% CI) | 1.34 [1.07, 1.68] | |
| 20.1.2 Second/third‐line chemotherapy | 2 | Risk Ratio (IV, Fixed, 95% CI) | 0.86 [0.24, 3.15] | |
| Outcome or subgroup title | No. of studies | No. of participants | Statistical method | Effect size |
| 21.1 Nausea and vomiting ‐ line of chemotherapy Show forest plot | 8 | Risk Ratio (IV, Fixed, 95% CI) | 0.88 [0.57, 1.34] | |
| 21.1.1 First‐line chemotherapy | 5 | Risk Ratio (IV, Fixed, 95% CI) | 0.85 [0.55, 1.33] | |
| 21.1.2 Second/third‐line chemotherapy | 3 | Risk Ratio (IV, Fixed, 95% CI) | 1.25 [0.27, 5.74] | |
| Outcome or subgroup title | No. of studies | No. of participants | Statistical method | Effect size |
| 22.1 Overall survival ‐ Schema 1 versus Schema 2 Show forest plot | 9 | Hazard Ratio (IV, Fixed, 95% CI) | 1.04 [0.93, 1.16] | |
| 22.1.1 Schema 1 | 5 | Hazard Ratio (IV, Fixed, 95% CI) | 0.98 [0.86, 1.12] | |
| 22.1.2 Schema 2 | 4 | Hazard Ratio (IV, Fixed, 95% CI) | 1.22 [0.99, 1.49] | |
| Outcome or subgroup title | No. of studies | No. of participants | Statistical method | Effect size |
| 23.1 Progression‐free survival ‐ Schema 1 versus Schema 2 (amended analysis) Show forest plot | 7 | Hazard Ratio (IV, Fixed, 95% CI) | 1.11 [0.99, 1.25] | |
| 23.1.1 Schema 1 | 3 | Hazard Ratio (IV, Fixed, 95% CI) | 1.11 [0.94, 1.31] | |
| 23.1.2 Schema 2 | 4 | Hazard Ratio (IV, Fixed, 95% CI) | 1.12 [0.94, 1.33] | |
| 23.2 Progression‐free survival ‐ Schema 1 versus Schema 2 Show forest plot | 8 | Hazard Ratio (IV, Fixed, 95% CI) | 1.16 [1.03, 1.31] | |
| 23.2.1 Schema 1 | 4 | Hazard Ratio (IV, Fixed, 95% CI) | 1.20 [1.03, 1.40] | |
| 23.2.2 Schema 2 | 4 | Hazard Ratio (IV, Fixed, 95% CI) | 1.12 [0.94, 1.33] | |
| Outcome or subgroup title | No. of studies | No. of participants | Statistical method | Effect size |
| 24.1 Overall response ‐ Schema 1 versus Schema 2 Show forest plot | 12 | 2140 | Risk Ratio (IV, Fixed, 95% CI) | 1.16 [1.06, 1.28] |
| 24.1.1 Schema 1 | 6 | 1344 | Risk Ratio (IV, Fixed, 95% CI) | 1.46 [1.28, 1.65] |
| 24.1.2 Schema 2 | 6 | 796 | Risk Ratio (IV, Fixed, 95% CI) | 0.92 [0.80, 1.04] |
| Outcome or subgroup title | No. of studies | No. of participants | Statistical method | Effect size |
| 25.1 Treatment‐related deaths ‐ Schema 1 versus Schema 2 Show forest plot | 7 | 902 | Risk Ratio (M‐H, Fixed, 95% CI) | 1.53 [0.71, 3.29] |
| 25.1.1 Schema 1 | 3 | 379 | Risk Ratio (M‐H, Fixed, 95% CI) | 0.94 [0.36, 2.44] |
| 25.1.2 Schema 2 | 4 | 523 | Risk Ratio (M‐H, Fixed, 95% CI) | 4.00 [0.87, 18.35] |
| Outcome or subgroup title | No. of studies | No. of participants | Statistical method | Effect size |
| 26.1 Neutropaenia ‐ subgroup analysis, Schema 1 versus Schema 2 Show forest plot | 12 | Risk Ratio (IV, Fixed, 95% CI) | 0.94 [0.87, 1.02] | |
| 26.1.1 Schema 1 | 6 | Risk Ratio (IV, Fixed, 95% CI) | 0.99 [0.87, 1.14] | |
| 26.1.2 Schema 2 | 6 | Risk Ratio (IV, Fixed, 95% CI) | 0.92 [0.84, 1.01] | |
| Outcome or subgroup title | No. of studies | No. of participants | Statistical method | Effect size |
| 27.1 Febrile neutropenia ‐ Schema 1 versus Schema 2 Show forest plot | 9 | Risk Ratio (IV, Fixed, 95% CI) | 1.32 [1.06, 1.65] | |
| 27.1.1 Schema 1 | 3 | Risk Ratio (IV, Fixed, 95% CI) | 1.76 [1.14, 2.73] | |
| 27.1.2 Schema 2 | 6 | Risk Ratio (IV, Fixed, 95% CI) | 1.19 [0.92, 1.55] | |
| Outcome or subgroup title | No. of studies | No. of participants | Statistical method | Effect size |
| 28.1 Nausea and vomiting ‐ Schema 1 versus Schema 2 Show forest plot | 8 | Risk Ratio (IV, Fixed, 95% CI) | 0.88 [0.57, 1.34] | |
| 28.1.1 Schema 1 | 3 | Risk Ratio (IV, Fixed, 95% CI) | 0.75 [0.39, 1.46] | |
| 28.1.2 Schema 2 | 5 | Risk Ratio (IV, Fixed, 95% CI) | 0.98 [0.56, 1.71] | |
| Outcome or subgroup title | No. of studies | No. of participants | Statistical method | Effect size |
| 29.1 Overall survival ‐ relative dose intensity Show forest plot | 4 | Hazard Ratio (IV, Fixed, 95% CI) | 1.14 [0.92, 1.39] | |
| 29.1.1 Similar dose intensity | 2 | Hazard Ratio (IV, Fixed, 95% CI) | 1.23 [0.93, 1.62] | |
| 29.1.2 Different dose intensity | 2 | Hazard Ratio (IV, Fixed, 95% CI) | 1.03 [0.76, 1.40] | |
| Outcome or subgroup title | No. of studies | No. of participants | Statistical method | Effect size |
| 30.1 Progression‐free survival ‐ relative dose intensity (amended analysis) Show forest plot | 3 | Hazard Ratio (IV, Fixed, 95% CI) | 1.13 [0.90, 1.43] | |
| 30.1.1 Similar dose intensity | 2 | Hazard Ratio (IV, Fixed, 95% CI) | 1.15 [0.91, 1.45] | |
| 30.1.2 Different dose intensity | 1 | Hazard Ratio (IV, Fixed, 95% CI) | 0.85 [0.24, 2.99] | |
| 30.2 Progression‐free survival ‐ relative dose intensity Show forest plot | 4 | Hazard Ratio (IV, Fixed, 95% CI) | 1.17 [0.95, 1.44] | |
| 30.2.1 Similar dose intensity | 2 | Hazard Ratio (IV, Fixed, 95% CI) | 1.15 [0.91, 1.45] | |
| 30.2.2 Different dose intensity | 2 | Hazard Ratio (IV, Fixed, 95% CI) | 1.25 [0.80, 1.95] | |
| Outcome or subgroup title | No. of studies | No. of participants | Statistical method | Effect size |
| 31.1 Overall response ‐ relative dose intensity Show forest plot | 6 | 679 | Risk Ratio (IV, Fixed, 95% CI) | 0.90 [0.77, 1.05] |
| 31.1.1 Similar dose intensity | 3 | 355 | Risk Ratio (IV, Fixed, 95% CI) | 0.88 [0.72, 1.07] |
| 31.1.2 Different dose intensity | 3 | 324 | Risk Ratio (IV, Fixed, 95% CI) | 0.93 [0.72, 1.20] |
| Outcome or subgroup title | No. of studies | No. of participants | Statistical method | Effect size |
| 32.1 Treatment‐related deaths ‐ relative dose intensity Show forest plot | 4 | 406 | Risk Ratio (M‐H, Fixed, 95% CI) | 1.66 [0.45, 6.10] |
| 32.1.1 Similar dose intensity | 1 | 82 | Risk Ratio (M‐H, Fixed, 95% CI) | Not estimable |
| 32.1.2 Different dose intensity | 3 | 324 | Risk Ratio (M‐H, Fixed, 95% CI) | 1.66 [0.45, 6.10] |
| Outcome or subgroup title | No. of studies | No. of participants | Statistical method | Effect size |
| 33.1 Neutropaenia ‐ relative dose intensity Show forest plot | 6 | Risk Ratio (IV, Fixed, 95% CI) | 1.01 [0.92, 1.12] | |
| 33.1.1 Similar dose intensity | 3 | Risk Ratio (IV, Fixed, 95% CI) | 1.08 [0.97, 1.20] | |
| 33.1.2 Different dose intensity | 3 | Risk Ratio (IV, Fixed, 95% CI) | 0.67 [0.51, 0.87] | |
| Outcome or subgroup title | No. of studies | No. of participants | Statistical method | Effect size |
| 34.1 Febrile neutropenia ‐ relative dose intensity Show forest plot | 6 | Risk Ratio (IV, Fixed, 95% CI) | 1.21 [0.93, 1.57] | |
| 34.1.1 Similar dose intensity | 3 | Risk Ratio (IV, Fixed, 95% CI) | 2.36 [1.21, 4.62] | |
| 34.1.2 Different dose intensity | 3 | Risk Ratio (IV, Fixed, 95% CI) | 1.07 [0.80, 1.42] | |
| Outcome or subgroup title | No. of studies | No. of participants | Statistical method | Effect size |
| 35.1 Nausea and vomiting ‐ relative dose intensity Show forest plot | 6 | Risk Ratio (IV, Fixed, 95% CI) | 0.98 [0.56, 1.71] | |
| 35.1.1 Similar dose intensity | 3 | Risk Ratio (IV, Fixed, 95% CI) | 1.14 [0.50, 2.60] | |
| 35.1.2 Different dose intensity | 3 | Risk Ratio (IV, Fixed, 95% CI) | 0.86 [0.40, 1.83] | |